 🏗️ New Construction
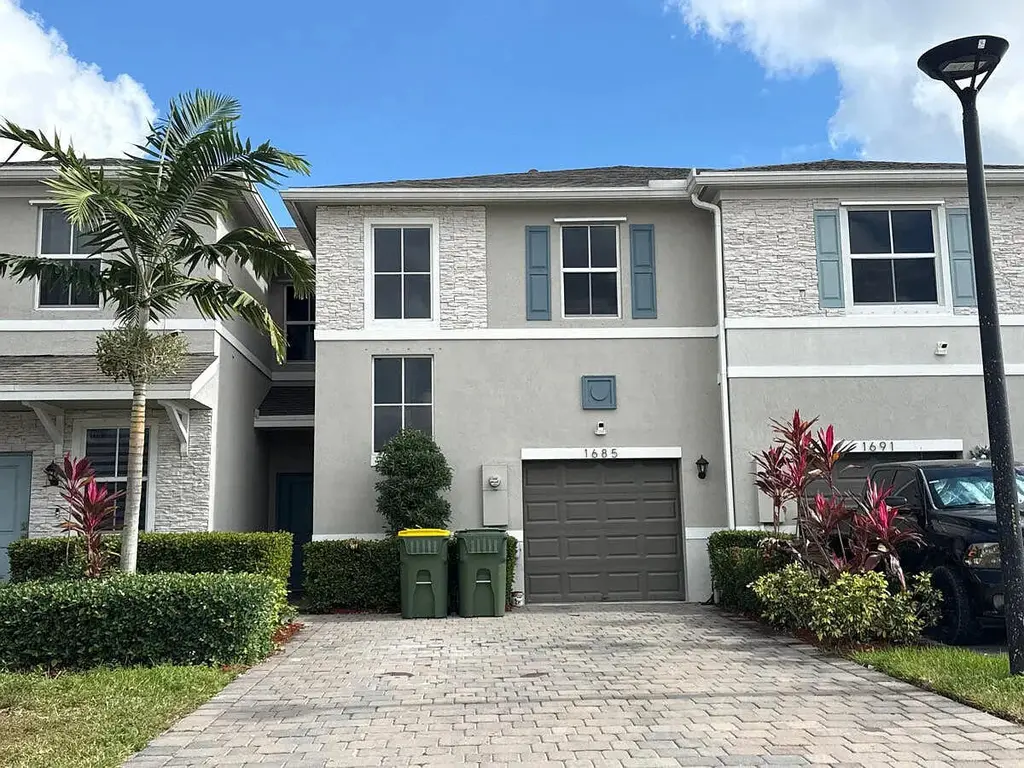
1685 SE 8th Ave · Homestead, FL
Flood risk 5/10 · Moderate
- FEMA flood zone
- AH
- Chance of flooding over 30 yrs
- 0.14%
- Est. flood insurance / yr
- $1,142 – $2,507
Fire risk 3/10 · Minor
- Est. fire insurance / yr
- $947 – $1,759
Heat risk 10/10 · Severe
- Hot days now (above 106°F)
- 7 days/yr
- Hot days in 30 yrs
- 31 days/yr
Wind risk 10/10 · Severe
- Chance of severe wind over 30 yrs
- 99.0%
Air-quality risk 2/10 · Minimal
- Unhealthy air days now
- 0 days/yr
- Unhealthy air days in 30 yrs
- 1 days/yr
Risk factors via First Street. Map © Google.
Why this score? — see what drove the F grade
The composite is a weighted blend of 9 inputs, each scored 0–100. Each bar is that input's sub-score; the figure is the points it added to the 100-point composite (weight × sub-score).
- ARV discount +7.5/15.0
- Cash flow +6.5/30.0
- Schools +4.2/10.0
- Livability +3.9/5.0
- Condition / age +2.5/5.0
- Rent growth +1.8/5.0
- 1% rule +1.6/10.0
- DSCR +0.8/10.0
- Appreciation +0.0/10.0
$5,000
🖨 Deal sheet (PDF) 📄 Offer letter ✓ Due diligence
Listing remarks MLS
Beautiful Spacious 3 bedrooms, 2.5 baths New Construction Townhome located close to the Florida City Outlets and at the entrance to the Keys. Paved driveway, professionally designed landscaping, stainless steel appliances, Home is Connected package. * Pictures, photographs, features, colors and sizes are approximate for illustration purposes only and will vary from the homes as built. These photos are not of the actual home but are similar to the home being built.
Key facts
- Garage
- Built 2023
- Listed 12 days
Property features AI
Finance
- Other: No deed restrictions; Pets: see remarks; Rentals not allowed; One total unit
- Financial info: Property listed at auction
- HOA & community: No association fee; Association fee covers other items
Exterior
- Parking: Attached garage
- Utilities: Utilities: other (see remarks)
- Home design: Single-family type; Built in 2023; Less than 1/4 acre lot; Other zoning
- Construction: Other construction
- Exterior features: No waterfront or waterview; Dockage: other dockage
Interior
- Bedrooms: Three bedrooms
- Bathrooms: Two full bathrooms and one half bathroom
- Interior features: Other appliances (see remarks)
Neighborhood map
What this means for you Summary
Snapshot
- This is a 3-bed/2.0-bath townhouse listed at $5k.
Deal economics
- At list price, monthly cash flow is $-890 ($-11k/yr) — negative.
- The deal already cash-flows at list — no discount required.
- Meets the 1% rule at list price ($3k rent vs $5k).
- Cap rate 4.3% vs local median 3.5% in Homestead — meaningfully above typical; check what's discounted (condition, days-on-market, listing class) to confirm the premium yield is real.
Location & tenants
- Location reads 78/100 on livability (#158 in FL, #2,408 nationally) — a middle-class / working-renter tenant base. Strengths: commute A+, housing A+, health & safety A+; Watch: employment C-.
- Miami-Dade (suburban): math 45% / reading 54% proficiency, ranked #40 of 73 in FL (top 55%) — families likely to look elsewhere, expect single-tenant / working-renter base with shorter leases; 64% free/reduced lunch — lower-income household profile, screen leases tightly.
- Market conditions: Rents soft (-2.9%/yr); 615 active listings in the ZIP; 40 comparable units currently listed for rent nearby; rentals at typical pace (median 19d on market — plan ~3-4 weeks tenant-placement turnaround); 10,051 units permitted in Miami-Dade County in 2024 (7,758 in 5+ unit buildings).
- At $2,925/mo this rent would consume 74% of the median local household income ($47k/yr) (locally 1516% of renters already pay >50% of income on rent) — very limited rent-growth headroom before tenants either downsize or default.
Forward outlook
- Local home prices are declining (-3.0%/yr); year-one equity from $3k of loan paydown is wiped out by about $13k of value loss. Plan a longer hold.
- Miami-Dade County population projected at +28% by 2050 — long-run rental-demand tailwind backs the buy-and-hold thesis.
Negotiation context
- Only 13 days on market — expect competitive offers; lowballing is unlikely to land.
- 3 sale attempts since 3y ago with the ask held roughly flat each time — persistent listings suggest the price (not the market) is what's stuck; bring a comps-based counter.
Risks & watch-outs
- Watch-outs: property tax is 132.4% of price; flood insurance adds $152/mo.
- Climate carrying-cost: in FEMA flood zone AH (mandatory federal flood insurance); severe wind risk, 99% chance of damaging wind over 30y; extreme-heat days projected 7→31/yr by 2055 (HVAC capex compounding) — expect insurance premiums to compound above CPI over the hold.
Questions for the listing agent
- What do current leases actually rent for vs. the listed asking? Can we see a recent rent roll and the last 12 months of T-12 income?
- Property tax is high relative to price — has the assessment been appealed recently, and will the sale trigger a re-assessment?
- What's the actual annual flood-insurance premium (NFIP or private), and is the property in a SFHA with mandatory coverage?
- Is there a deadline driving the sale (1031 exchange, divorce, estate, relocation)? That informs how much negotiation room exists.
- Schools are B-rated — typically a magnet for longer-tenancy family renters. What's the average tenant stay here, and is there a school-zone premium baked into asking?
- The area grade is low — what's the realistic commute time and amenity access for the typical tenant pool here? Any planned neighborhood developments (good or bad) we should know about?
- What's the average days-on-market for RENTAL listings here right now (not sales)? A rising rental-DOM trend means longer vacancies and softer asking-rent achievability than the comps imply.
- What's the recent tenant-quality profile in this submarket — average credit score on applications, eviction rate, late-payment / NSF rate, and stable-employment percentage? A property-management company in the area should have these aggregated.
- How much new for-sale + rental construction is in the pipeline within 1–3 miles? Heavy new supply typically softens prices + rents 12–24 months out; constrained supply supports both.
Investment metrics
- 1% rule
- 0.66% ✗
- Cap rate
- 4.29%
- Cash-on-cash
- -7.17%
- DSCR
- 0.68
- GRM
- 12.6
CMA / ARV
- ARV (on-the-fly)
- $441,188
- Comps found
- 3
Show comp detail 3 sales within ~0.75 mi
| Address | Dist | Beds/Ba | Sqft | Sold | Price | $/sf | Match |
|---|---|---|---|---|---|---|---|
| 727 SE 14 St | 0.19mi | 3/3.5 | 1,746 (+7%) | 21mo | $472,404 | $271 | 56 |
| 700 SE 15 St | 0.11mi | 4/3.5 (+1) | 1,804 (+11%) | 22mo | $504,000 | $279 | 47 |
| 371 NE 16 St | 0.64mi | 3/2.5 | 1,456 (-11%) | 4mo | $394,000 | $271 | 47 |
Match score weights: distance 35% · size 25% · config 20% · recency 20%. Top-matched comps best support the ARV.
Projected returns pro-forma
-3.0% appreciation · 0.0% rent growth · sell at horizon
- IRR
- -35.1%
- Equity multiple
- -0.11×
- Total profit
- $-136,621
- Equity at exit
- $65,783
- IRR
- -70.9%
- Equity multiple
- -0.82×
- Total profit
- $-224,541
- Equity at exit
- $38,146
Cash invested: $123,533 (down + closing). Projections, not guarantees.
Landlord ↔ Tenant lean methodology
- Overall (STATE)
- 87 Strongly Landlord-Friendly
- State Florida
- 87 Strongly Landlord-Friendly · R+3
- County
- — inherits STATE
- City
- — inherits STATE
ZIP-level market 33034
- Home prices YoY
- -5.9%
- Rents YoY
- -2.9%
- Active inventory
- 615
- Price-to-rent
- 0.1×
Monthly cashflow live
- Estimated rent
- $2,925 high interval (Pro) →
- Mortgage (P&I)
- −$2,314
- Tax est. 1.5%
- −$551 /mo · $6,618/yr
- Insurance
- −$184
- Flood insurance flood zone
- −$152 /mo · $1,824/yr
- HOA
- −$0
- Vacancy / Maint / Mgmt
- −$614
- Net cashflow
- $-890
Break-even live
Sensitivity live
| Price | -10% $-585 | -5% $-738 | +0% $-890 | +5% $-1,043 | +10% $-1,195 |
|---|---|---|---|---|---|
| Rent | -10% $-1,121 | -5% $-1,006 | +0% $-890 | +5% $-775 | +10% $-659 |
| Rate | -1.0pp $-668 | -0.5pp $-778 | base $-890 | +0.5pp $-1,004 | +1.0pp $-1,121 |
UW: 25.0% down · 7.5% · 30yr · 1.5% tax · 5.0% vac · 8.0% maint · 8.0% mgmt
Financing live
Cash to close
- Down payment
- $110,297
- Closing costs
- $13,236
- Reserves months
- —
- Total cash needed
- —
Loan-product check · same deal, 3 products live
Conventional
25% down · 7.5% · 30yr
- Down + closing
- —
- Monthly P&I
- —
- Monthly cashflow
- —
- DSCR
- —
- Eligible?
- —
Personal DTI + credit; lowest rate.
DSCR
20% down · 8.5% · 30yr
- Down + closing
- —
- Monthly P&I
- —
- Monthly cashflow
- —
- DSCR
- —
- Eligible?
- —
No personal income docs; deal must DSCR.
Hard money
10% down · 12.0% · 12mo
- Down + closing
- —
- Monthly P&I
- —
- Monthly cashflow
- —
- DSCR
- —
- Eligible?
- —
Short-term bridge; refi at stabilization.
Rent comps 40 comps
| Address | Beds | Baths | Sqft | Rent | $/sqft | DOM | Units | Dist |
|---|---|---|---|---|---|---|---|---|
| 818 SE 17th St Homestead, FL | 3.0 | 3.0 | 1712 | $2,900 | $1.69 | 25d | 1 | 0.04mi |
| 1783 SE 7th Ter Homestead, FL | 4.0 | 3.0 | 1757 | $3,100 | $1.76 | 19d | 1 | 0.07mi |
| 1783 SE 7th Ter Homestead, FL | 4.0 | 3.0 | 1757 | $3,100 | $1.76 | 25d | 1 | 0.07mi |
| 525 NE 6th Pl Florida City, FL | 4.0 | 3.0 | 2126 | $3,600 | $1.69 | 25d | 1 | 0.07mi |
| 791 SE 18th St Unit 791 Homestead, FL | 3.0 | 2.5 | 1712 | $3,200 | $1.87 | 12d | 1 | 0.08mi |
| 791 SE 18th St Unit 791 Homestead, FL | 3.0 | 2.5 | 1712 | $3,200 | $1.87 | 5d | 1 | 0.08mi |
| 779 SE 18th St Unit 779 Florida City, FL | 3.0 | 2.5 | 1628 | $2,985 | $1.83 | 25d | 1 | 0.08mi |
| 805 SE 18th St Unit 805 Homestead, FL | 3.0 | 2.5 | 1628 | $2,900 | $1.78 | 25d | 1 | 0.08mi |
| 831 SE 16th Ct Homestead, FL | 3.0 | 2.5 | 1628 | $2,750 | $1.69 | 0d | 1 | 0.09mi |
| 804 SE 18th St Homestead, FL | 4.0 | 3.0 | 1757 | $3,100 | $1.76 | 12d | 1 | 0.10mi |
| 804 SE 18th St Unit 804 Homestead, FL | 4.0 | 3.0 | 1757 | $3,100 | $1.76 | 19d | 1 | 0.10mi |
| 648 NE 5th Way Florida City, FL | 3.0 | 2.0 | 1521 | $3,300 | $2.17 | 25d | 1 | 0.13mi |
| 1720 SE 9th Ave Florida City, FL | 3.0 | 2.5 | 1488 | $2,300 | $1.55 | 19d | 1 | 0.14mi |
| 1710 SE 9th Ave Florida City, FL | 3.0 | 2.5 | 1488 | $3,000 | $2.02 | 25d | 1 | 0.14mi |
| 784 SE 19th St #784 Florida City, FL | 3.0 | 2.5 | 1712 | $2,895 | $1.69 | 25d | 1 | 0.14mi |
| 1780 SE 9th Ave Florida City, FL | 3.0 | 2.5 | 1542 | $2,500 | $1.62 | 2d | 1 | 0.15mi |
| 1780 SE 9th Ave Florida City, FL | 3.0 | 2.5 | 1542 | $2,700 | $1.75 | 4d | 1 | 0.15mi |
| 728 SE 14th Ct Homestead, FL | 3.0 | 3.5 | 1694 | $3,200 | $1.89 | 25d | 1 | 0.16mi |
| 906 SE 17th St Homestead, FL | 3.0 | 2.5 | 1464 | $3,000 | $2.05 | 4d | 1 | 0.16mi |
| 1427 SE 7th Ter Unit 1427 Homestead, FL | 3.0 | 2.5 | 1642 | $2,750 | $1.67 | 25d | 1 | 0.18mi |
| 643 SE 15th St Homestead, FL | 3.0 | 2.5 | 1642 | $2,800 | $1.71 | 3d | 1 | 0.19mi |
| 643 SE 15th St Homestead, FL | 3.0 | 2.5 | 1642 | $2,850 | $1.74 | 13d | 1 | 0.19mi |
| 656 SE 14th Ct Homestead, FL | 3.0 | 3.5 | 1746 | $2,600 | $1.49 | 25d | 1 | 0.20mi |
| 1921 SE 8th Pl Homestead, FL | 3.0 | 3.0 | 1483 | $3,100 | $2.09 | 25d | 1 | 0.20mi |
| 639 SE 14th Ct Homestead, FL | 3.0 | 3.5 | 2106 | $3,177 | $1.51 | 25d | 1 | 0.22mi |
| 1371 SE 7th Ter Unit 1371 Homestead, FL | 4.0 | 3.5 | 1790 | $3,000 | $1.68 | 5d | 1 | 0.23mi |
| 1371 SE 7th Ter Homestead, FL | 4.0 | 3.5 | 1790 | $3,000 | $1.68 | 3d | 1 | 0.23mi |
| 708 SE 13th Ct Homestead, FL | 3.0 | 3.5 | 1694 | $2,700 | $1.59 | 25d | 1 | 0.24mi |
| 708 SE 13th Ct Homestead, FL | 3.0 | 3.5 | 1694 | $2,700 | $1.59 | 6d | 1 | 0.24mi |
| 496 NE 5th St Unit 496 Florida City, FL | 2.0 | 2.5 | 1208 | $2,250 | $1.86 | 12d | 1 | 0.25mi |
| 496 NE 5th St Unit 496 Florida City, FL | 2.0 | 2.5 | 1208 | $2,250 | $1.86 | 9d | 1 | 0.25mi |
| 541 NE 4th Ln Florida City, FL | 3.0 | 3.0 | 1272 | $2,400 | $1.89 | 25d | 1 | 0.25mi |
| 540 NE 5th Ln Florida City, FL | 2.0 | 2.5 | 1208 | $2,200 | $1.82 | 17d | 1 | 0.25mi |
| 487 NE 5th St Florida City, FL | 3.0 | 3.0 | 1272 | $2,550 | $2.00 | 23d | 1 | 0.26mi |
| 479 NE 5th Way Unit 479 Florida City, FL | 3.0 | 3.0 | 1272 | $2,400 | $1.89 | 0d | 1 | 0.26mi |
| 1500 Jefferson Dr Unit 1500K Homestead, FL | 3.0 | 2.0 | 1195 | $2,000 | $1.67 | 9d | 1 | 0.27mi |
| 1500 Jefferson Dr Unit 1500L Homestead, FL | 3.0 | 2.0 | 1195 | $2,500 | $2.09 | 23d | 1 | 0.27mi |
| 621 SE 13th Street Cir Unit 1 Homestead, FL | 3.0 | 3.5 | 1694 | $2,500 | $1.48 | 9d | 1 | 0.28mi |
| 621 SE 13th Street Cir Unit 1 Homestead, FL | 3.0 | 3.5 | 1694 | $2,500 | $1.48 | 25d | 1 | 0.28mi |
| 631 SE 13th Street Cir Homestead, FL | 4.0 | 3.5 | 1850 | $3,200 | $1.73 | 25d | 1 | 0.28mi |
Listing history 8 events
-
2026-06-21days on market $5,000 Active 13 DOM
-
2026-06-18days on market $5,000 Active 10 DOM
-
2026-06-17days on market $5,000 Active 9 DOM
-
2026-06-16days on market $5,000 Active 8 DOM
-
2026-06-15days on market $5,000 Active 7 DOM
-
2026-06-13days on market $5,000 Active 5 DOM
-
2026-06-08remarks 298-char remark
-
2026-06-08$5,000 Active 1 DOM
ⓘ Source: listings_history table (triggers on properties + properties_extension) + one-shot
backfill from property_details.listing_events for pre-trigger history.
Climate risk First Street
- Flood 5/10 Major FEMA zone AH · 14% chance over 30 yrs
- Wildfire 3/10 Moderate
- Heat 10/10 Extreme 7 d/yr ≥106°F today · 31 d/yr by 30 yrs out
- Wind 10/10 Extreme 99% chance of damaging wind over 30 yrs
- Air quality 2/10 Low 0 unhealthy d/yr today · 1 by 30 yrs out
Nearby sold comps map
Loading sold comps map…
Walkable amenities ~0.75 mi
Loading nearby amenities…
Taxation est. · year 1
- Rental income
- $35,101
- − Mortgage interest
- −$24,713
- − Property taxes
- −$6,618
- − Insurance
- −$4,030
- − Repairs & maintenance
- −$2,808
- − Management
- −$2,808
- − Depreciation
- −$12,835
- Taxable loss
- −$18,711
- Est. tax savings @ 24.0%
- +$4,491
- After-tax cash flow
- $-6,191/yr
For passive investors: Depreciation is non-cash, so a rental often shows a tax loss while cash-flowing — sheltering income. Rental losses are passive: they offset passive income freely, and up to $25,000/yr can offset ordinary (W-2) income if you actively participate and your MAGI is under $100k (phasing out to $0 by $150k); unused losses carry forward. On sale, claimed depreciation is recaptured at up to 25%, and gains may owe capital-gains tax (a 1031 exchange can defer both). Figures are a year-1 estimate at your 24.0% rate — not tax advice; consult a CPA.
Schools (NCES district)
- District
- Miami-Dade
- NCES district ID
- 1200390
- Math proficiency
- 45% ▼ -16.00%
- Reading proficiency
- 54% ▼ -5.00%
- Median HH income
- $43,928
- Composite
- 41.76/100
- National rank
- #3397
- State rank
- #40 of 73 in FL
Livability — Homestead
- Score
- 78/100
- State rank
- #158
- US rank
- #2408
Category grades
Schools grade is shown separately in the Schools card above.
Census & demographics
- Census place
- Homestead, FL
- County
- Miami-Dade County · 2,697,751 people
- City population
- 191,470
- Metro
- Miami-Fort Lauderdale-Pompano Beach, FL
- Population (ZIP)
- 23,823
- Household income
- $47,170
- Rent vs Own
- Severe rent burden
- 1516.0
Population outlook (Miami-Dade County) Hauer SSP2
- Today (2025)
- 3,126,439 people
- By 2030
- 3,325,765 · +6.4%
- By 2040
- 3,697,561 · +18.3%
- By 2050
- 4,012,134 · +28.3%
- By 2075
- 4,605,612 · +47.3%
- By 2100
- 4,866,598 · +55.7%
Race, ethnicity, and origin ACS 2023
- Neighborhood character
- Majority Hispanic (62%)
- Race & ethnicity
- Hispanic / Latino 62% Black 28% Two or more races 24% White 8%
- Hispanic origin (detail)
- Mexican 20% Puerto Rican 5% Cuban 13% Dominican 2%
- Common ancestry
- Hispanic 4%
- Foreign-born
- 34% · Canada, Dominican Republic, Guatemala
- Languages at home
- 38% English-only · Spanish 56% French/Haitian/Cajun 5%
Political lean MEDSL · Miami-Dade
- 2024 margin
- R (+11.4) · D 43.9% · R 55.4%
- 2008→2024 swing
- -27.6pp toward R · 2008: 16.1pp · 2024: -11.4pp
- All cycles
- 2024: R+11.4 2020: D+7.3 2016: D+29.6 2012: D+23.7 2008: D+16.1
Not yet ingested
- Civics
- —
Market trends
- HPI YoY
- ▼ -32.64%
- Current HPI
- 521.6856
- Rent YoY
- ▼ -2.85%
- Metro
- Miami-Fort Lauderdale-Pompano Beach, FL
- State GDP YoY
- ▲ 3.28%
- F500 in state
- 36
Industry mix (Fortune 500 HQ in FL)
| Industry | F500 HQs | Revenue |
|---|---|---|
| Industrial Technology | 2 | $29B |
|
||
| Insurance | 2 | $17B |
|
||
| Retail | 1 | $60B |
|
||
| Technology Distribution | 1 | $58B |
|
||
| Homebuilding | 1 | $35B |
|
||
| Technology Manufacturing | 1 | $35B |
|
||
Price history
-98.9% since first listed7 events — show timeline
- 2026-06-08 Listed $5,000 FLKMLS
- 2026-02-02 Listing Removed — FLKMLS
- 2026-01-21 Listed $5,000 FLKMLS
- 2023-06-20 Sold (MLS) $475,790 MARMLS
- 2023-02-24 Pending — MARMLS
- 2023-02-02 Price Changed $475,790 MARMLS
- 2023-01-27 Listed $473,790 MARMLS
Property tax history
+51.3%/yrLatest (2025): $8,142 · -8.7% YoY. Source: county tax records.
Cash-flow waterfall
monthlySold comps — $/sqft
last 12 mo · ≤1 miLoading sold comps…