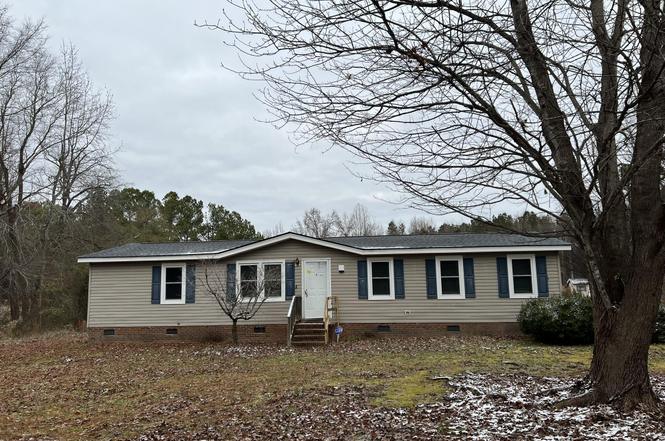
175 Wakeline Dr · Wendell, NC
Flood risk 1/10 · Minimal
- FEMA flood zone
- X (unshaded)
- Chance of flooding over 30 yrs
- 0.0%
- Est. flood insurance / yr
- $507 – $1,088
Fire risk 4/10 · Minor
- Est. fire insurance / yr
- $906 – $1,684
Heat risk 6/10 · Moderate
- Hot days now (above 105°F)
- 7 days/yr
- Hot days in 30 yrs
- 17 days/yr
Wind risk 6/10 · Moderate
- Chance of severe wind over 30 yrs
- 62.0%
Air-quality risk 2/10 · Minimal
- Unhealthy air days now
- 2 days/yr
- Unhealthy air days in 30 yrs
- 2 days/yr
Risk factors via First Street. Map © Google.
Why this score? — see what drove the C+ grade
The composite is a weighted blend of 9 inputs, each scored 0–100. Each bar is that input's sub-score; the figure is the points it added to the 100-point composite (weight × sub-score).
- Cash flow +21.1/30.0
- ARV discount +15.0/15.0
- DSCR +6.7/10.0
- 1% rule +4.5/10.0
- Livability +3.9/5.0
- Schools +3.5/10.0
- Rent growth +3.4/5.0
- Condition / age +2.5/5.0
- Appreciation +0.0/10.0
$199,900
🖨 Deal sheet 📄 Offer letter ✓ Due diligence
Listing remarks
Just Reduced! Saddle up and bring your horse—this inviting manufactured home offers the perfect blend of country charm and opportunity. Nestled on nearly 2 acres just over the Wake County line in tranquil Johnston County, the property provides a peaceful setting with plenty of space to enjoy the outdoors. Inside, you'll find three bedrooms, two full bathrooms, a comfortable living room, and a sunken den with sliding doors that bathe the space in natural light. Located within the Johnston County Public Schools district, families will appreciate access to quality education. The property also features a large-wired shed and a covered back area, ideal for storing equipment or tackling wee
Key facts
- Large-wired shed
- Covered back area
- Nearly 2 acres
Tags
Neighborhood map
What this means for you Summary
Snapshot
- This is a 3-bed/2.0-bath manufactured listed at $200k.
Deal economics
- At list price, monthly cash flow is $286 ($3k/yr) — positive.
- The deal already cash-flows at list — no discount required.
- To meet the 1% rule (rent ≥ 1% of price), the offer needs to be $190k (4.7% below list).
- Recommended offer: $190k (4.7% below list) — sets the bar for 1% rule.
- Cap rate 8.0% vs local median 3.7% in Wendell — top-decile yield for the area; either an underpriced asset or a hidden risk that comps aren't pricing in. Stress-test before assuming the spread holds.
Location & tenants
- Location reads 78/100 on livability (#25 in NC, #2,391 nationally) — a middle-class / working-renter tenant base. Strengths: housing A+, health & safety A+, crime A; Watch: amenities D.
- Johnston County Public Schools (rural): math 39% / reading 42% proficiency, ranked #105 of 178 in NC (top 59%) — families likely to look elsewhere, expect single-tenant / working-renter base with shorter leases.
- Zoned schools: Archer Lodge Middle (math 43% / reading 47%, grade D, #160 of 475 statewide, top 35%, 1,219 students, 40% FRL); Corinth Holders High (math 50% / reading 61%, grade C, #265 of 535 statewide, top 50%, 2,219 students, 32% FRL) — zoned schools at 36% FRL track the district average.
- Market conditions: Rents rising (+3.4%/yr); 822 active listings in the ZIP; solid renter incomes; 2,783 units permitted in Johnston County in 2024 (6 in 5+ unit buildings).
Forward outlook
- Local home prices are declining (-3.0%/yr); year-one equity from $1k of loan paydown is wiped out by about $6k of value loss. Plan a longer hold.
- Johnston County population projected at +37% by 2050 — long-run rental-demand tailwind backs the buy-and-hold thesis.
Negotiation context
- It's been on market 26 days — a 2% lower offer ($197k) is reasonable based on typical stale-listing flexibility.
- 7 sale attempts since 22y ago; this cycle's ask has dropped $18k (8%) from the opening price — seller is motivated, your offer sets the floor, not the list.
- Current owner paid $107k; list at $200k implies a 87% gain — meaningful room to come down on a strong offer.
Risks & watch-outs
- Climate carrying-cost: major wind risk, 62% chance of damaging wind over 30y; extreme-heat days projected 7→17/yr by 2055 (HVAC capex compounding) — expect insurance premiums to compound above CPI over the hold.
Questions for the listing agent
- Is there a deadline driving the sale (1031 exchange, divorce, estate, relocation)? That informs how much negotiation room exists.
- Schools are D-rated, which usually means shorter tenancies and higher turnover. Who's the typical renter profile here, and what's been the actual vacancy rate?
- What's the average days-on-market for RENTAL listings here right now (not sales)? A rising rental-DOM trend means longer vacancies and softer asking-rent achievability than the comps imply.
- What's the recent tenant-quality profile in this submarket — average credit score on applications, eviction rate, late-payment / NSF rate, and stable-employment percentage? A property-management company in the area should have these aggregated.
- How much new for-sale + rental construction is in the pipeline within 1–3 miles? Heavy new supply typically softens prices + rents 12–24 months out; constrained supply supports both.
Investment metrics
- 1% rule
- 0.95% ✗
- Cap rate
- 8.01%
- Cash-on-cash
- 6.14%
- DSCR
- 1.27
- GRM
- 8.7
CMA / ARV
- ARV (on-the-fly)
- $274,560
- Comps found
- 2
Show comp detail 2 sales within ~0.75 mi
| Address | Dist | Beds/Ba | Sqft | Sold | Price | $/sf | Match |
|---|---|---|---|---|---|---|---|
| 165 Wakeline Dr | 0.04mi | 3/2.0 | 1,512 (-9%) | 12mo | $245,000 | $162 | 72 |
| 140 Wakeline Dr | 0.16mi | 2/2.0 (-1) | 1,816 (+9%) | 18mo | $300,000 | $165 | 57 |
Match score weights: distance 35% · size 25% · config 20% · recency 20%. Top-matched comps best support the ARV.
Projected returns pro-forma
-3.0% appreciation · 3.4% rent growth · sell at horizon
- IRR
- -6.5%
- Equity multiple
- 0.76×
- Total profit
- $-13,468
- Equity at exit
- $29,806
- IRR
- 3.6%
- Equity multiple
- 1.26×
- Total profit
- $14,634
- Equity at exit
- $17,284
Cash invested: $55,972 (down + closing). Projections, not guarantees.
Landlord ↔ Tenant lean methodology
- Overall (STATE)
- 85 Strongly Landlord-Friendly
- State North Carolina
- 85 Strongly Landlord-Friendly · R+3
- County
- — inherits STATE
- City
- — inherits STATE
ZIP-level market 27591
- Home prices YoY
- -28.3%
- Rents YoY
- 3.4%
- Active inventory
- 822
- Price-to-rent
- 8.7×
Monthly cashflow live
- Estimated rent
- $1,904 medium interval (Pro) →
- Mortgage (P&I)
- −$1,048
- Tax from tax record
- −$86 /mo · $1,038/yr
- Insurance
- −$83
- HOA
- −$0
- Vacancy / Maint / Mgmt
- −$400
- Net cashflow
- $286
Break-even live
UW: 25.0% down · 7.5% · 30yr · 1.5% tax · 5.0% vac · 8.0% maint · 8.0% mgmt
Financing live
Cash to close
- Down payment
- $49,975
- Closing costs
- $5,997
- Reserves months
- —
- Total cash needed
- —
Loan-product check · same deal, 3 products live
Conventional
25% down · 7.5% · 30yr
- Down + closing
- —
- Monthly P&I
- —
- Monthly cashflow
- —
- DSCR
- —
- Eligible?
- —
Personal DTI + credit; lowest rate.
DSCR
20% down · 8.5% · 30yr
- Down + closing
- —
- Monthly P&I
- —
- Monthly cashflow
- —
- DSCR
- —
- Eligible?
- —
No personal income docs; deal must DSCR.
Hard money
10% down · 12.0% · 12mo
- Down + closing
- —
- Monthly P&I
- —
- Monthly cashflow
- —
- DSCR
- —
- Eligible?
- —
Short-term bridge; refi at stabilization.
Listing history 19 events
-
2026-02-12status Pending
-
2026-02-07price $199,900
-
2026-01-30status Active
-
2025-12-29status Pending
-
2025-12-15$217,500 Active
-
2025-10-01status Pending
-
2025-10-01historical
-
2025-09-05$217,500 Active
-
2025-09-02historical
-
2025-09-01$217,500 Active
-
2005-02-04soldstatus $107,000
-
2005-02-03soldstatus $107,000
-
2004-12-11historical
-
2004-07-12$105,000
-
2004-07-12historical
-
2004-07-08$114,900
-
2004-07-08historical
-
2004-03-17$114,900
-
1995-01-01soldstatus $15,000
ⓘ Source: listings_history table (triggers on properties + properties_extension) + one-shot
backfill from property_details.listing_events for pre-trigger history.
Tax reassessment forecast NC · Resets to sale price
- Current annual tax
- $1,038 · $86/mo
- Projected year-2 tax
- $1,639 · $137/mo
- Expected delta
- +$601/yr (+$50/mo · 57.9%)
ⓘ Screening estimate from a state-policy table — verify with the county assessor before closing.
Climate risk First Street
- Flood 1/10 Low FEMA zone X (unshaded) · 0% chance over 30 yrs
- Wildfire 4/10 Moderate
- Heat 6/10 Major 7 d/yr ≥105°F today · 17 d/yr by 30 yrs out
- Wind 6/10 Major 62% chance of damaging wind over 30 yrs
- Air quality 2/10 Low 2 unhealthy d/yr today · 2 by 30 yrs out
Nearby sold comps map
Loading sold comps map…
Walkable amenities ~0.75 mi
Loading nearby amenities…
Taxation est. · year 1
- Rental income
- $22,850
- − Mortgage interest
- −$11,198
- − Property taxes
- −$1,038
- − Insurance
- −$1,000
- − Repairs & maintenance
- −$1,828
- − Management
- −$1,828
- − Depreciation
- −$5,815
- Taxable income
- $143
- Est. tax owed @ 24.0%
- −$34
- After-tax cash flow
- $3,400/yr
For passive investors: Depreciation is non-cash, so a rental often shows a tax loss while cash-flowing — sheltering income. Rental losses are passive: they offset passive income freely, and up to $25,000/yr can offset ordinary (W-2) income if you actively participate and your MAGI is under $100k (phasing out to $0 by $150k); unused losses carry forward. On sale, claimed depreciation is recaptured at up to 25%, and gains may owe capital-gains tax (a 1031 exchange can defer both). Figures are a year-1 estimate at your 24.0% rate — not tax advice; consult a CPA.
Schools (NCES district)
- District
- Johnston County Public Schools
- NCES district ID
- 3702370
- Math proficiency
- 39% ▲ 4.00%
- Reading proficiency
- 42% ▲ 2.00%
- Median HH income
- $50,912
- Composite
- 34.99/100
- National rank
- #5052
- State rank
- #105 of 178 in NC
Livability — Wendell
- Score
- 78/100
- State rank
- #25
- US rank
- #2391
Category grades
Schools grade is shown separately in the Schools card above.
Census & demographics
- County
- Wake County · 1,216,256 people
- City population
- 29,838
- Metro
- Raleigh-Cary, NC
- Population (ZIP)
- 29,838
- Household income
- $85,224
- Rent vs Own
- Severe rent burden
- 369.0
Population outlook (Johnston County) Hauer SSP2
- Today (2025)
- 222,440 people
- By 2030
- 240,227 · +8.0%
- By 2040
- 274,616 · +23.5%
- By 2050
- 304,915 · +37.1%
- By 2075
- 369,507 · +66.1%
- By 2100
- 406,280 · +82.6%
Race, ethnicity, and origin ACS 2023
- Neighborhood character
- Diverse neighborhood (Simpson 0.66)
- Race & ethnicity
- White 46% Hispanic / Latino 27% Black 22% Two or more races 11%
- Hispanic origin (detail)
- Mexican 14% Puerto Rican 4% Dominican 1%
- Common ancestry
- Slovak 2% Serbian 2% Lithuanian 1%
- Foreign-born
- 14% · Canada, Jamaica
- Languages at home
- 79% English-only · Spanish 18% Tagalog/Filipino 1%
Political lean MEDSL · Johnston
- 2024 margin
- Strong R (+21.5) · D 38.7% · R 60.2% · Other 1.1%
- 2008→2024 swing
- +2.2pp toward D · 2008: -23.7pp · 2024: -21.5pp
- All cycles
- 2024: R+21.5 2020: R+24.3 2016: R+30.7 2012: R+27.8 2008: R+23.7
Not yet ingested
- Civics
- —
Market trends
- HPI YoY
- ▼ -92.20%
- Current HPI
- 233.2846
- Rent YoY
- ▲ 3.40%
- Metro
- Raleigh-Cary, NC
- State GDP YoY
- ▲ 3.28%
- F500 in state
- 26
Industry mix (Fortune 500 HQ in NC)
| Industry | F500 HQs | Revenue |
|---|---|---|
| Financial Services | 2 | $213B |
|
||
| Retail | 2 | $95B |
|
||
| Industrial Conglomerate | 1 | $38B |
|
||
| Metals / Steel | 1 | $35B |
|
||
| Utilities | 1 | $30B |
|
||
| Industrial Machinery | 1 | $19B |
|
||
Price history
+1232.7% since first listed19 events — show timeline
- 2026-02-12 Pending — TMLS
- 2026-02-07 Price Changed $199,900 TMLS
- 2026-01-30 Relisted — TMLS
- 2025-12-29 Pending — TMLS
- 2025-12-15 Listed $217,500 TMLS
- 2025-10-01 Pending — TMLS
- 2025-10-01 Listing Removed — TMLS
- 2025-09-05 Listed $217,500 TMLS
- 2025-09-02 Listing Removed — TMLS
- 2025-09-01 Listed $217,500 TMLS
- 2005-02-04 Sold (Public Records) $107,000 Public Records
- 2005-02-03 Sold (MLS) $107,000 TMLS
- 2004-12-11 Listing Removed — TMLS
- 2004-07-12 Listing Removed — TMLS
- 2004-07-12 Listed $105,000 TMLS
- 2004-07-08 Listing Removed — TMLS
- 2004-07-08 Listed $114,900 TMLS
- 2004-03-17 Listed $114,900 TMLS
- 1995-01-01 Sold (Public Records) $15,000 Public Records
Property tax history
+2.3%/yrLatest (2025): $1,038 · +193.0% YoY. Source: county tax records.
Cash-flow waterfall
monthlySold comps — $/sqft
last 12 mo · ≤1 miLoading sold comps…