 Multi-family
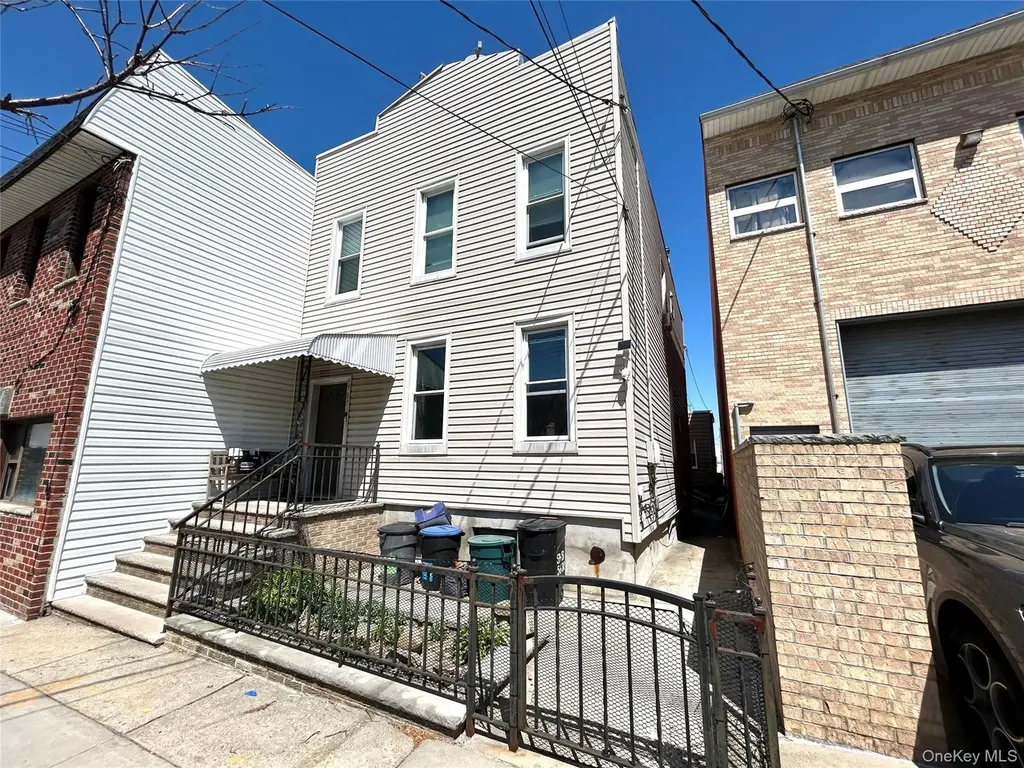
5951 56th Dr · New York, NY
Flood risk 1/10 · Minimal
- FEMA flood zone
- X (unshaded)
- Chance of flooding over 30 yrs
- 0.0%
- Est. flood insurance / yr
- $507 – $1,088
Fire risk 1/10 · Minimal
- Est. fire insurance / yr
- $691 – $1,283
Heat risk 6/10 · Moderate
- Hot days now (above 99°F)
- 7 days/yr
- Hot days in 30 yrs
- 14 days/yr
Wind risk 6/10 · Moderate
- Chance of severe wind over 30 yrs
- 39.0%
Air-quality risk 5/10 · Moderate
- Unhealthy air days now
- 6 days/yr
- Unhealthy air days in 30 yrs
- 8 days/yr
Risk factors via First Street. Map © Google.
Why this score? — see what drove the D+ grade
The composite is a weighted blend of 9 inputs, each scored 0–100. Each bar is that input's sub-score; the figure is the points it added to the 100-point composite (weight × sub-score).
- Cash flow +14.4/30.0
- ARV discount +8.3/15.0
- Rent growth +5.0/5.0
- Schools +5.0/10.0
- DSCR +4.4/10.0
- Livability +3.8/5.0
- 1% rule +3.1/10.0
- Condition / age +2.5/5.0
- Appreciation +0.0/10.0
$1,088,000
🖨 Deal sheet (PDF) 📄 Offer letter ✓ Due diligence
Multi-family units
County records classify this as Multi-Family (2-4 Unit). Listing-text estimate: 1 unit. estimate disagrees with records
Listing remarks
Legal 3-Family property for Sale - Prime Location in Maspeth, Queens. There are TWO buildings on this lot. Front building is a Two family (22' x 38') with finished basement and Rear building is a single family (23' x 24') with unfinished basement. This house has total of 6 bedrooms and 4 bathroom. Great layout and spacing for all your living and rental needs. All gas and electric meters are individually separated, making landlord management hassle-free. Rear Building need some TLC. Street Parking. Minutes Away from Buses, Supermarket. Come check it out before it's gone
Key facts
- Unfinished basement
- Finished basement
- Two buildings
Tags
Property features AI
Exterior
- Parking: No designated parking; No carport
- Utilities: Public sewer; Cable available
- Home design: Triplex
- Construction: Vinyl-sided construction
- Exterior features: Vinyl siding; Not waterfront
Interior
- Bedrooms: Includes a bedroom on the first floor
- Heating & cooling: Steam heating; Wall/window air conditioning units
- Interior features: First-floor bedroom; Finished basement
Neighborhood map
What this means for you Summary
Snapshot
- This is a multifamily listed at $1.09M.
Deal economics
- At list price, monthly cash flow is $218 ($3k/yr) — positive.
- The deal already cash-flows at list — no discount required.
- To meet the 1% rule (rent ≥ 1% of price), the offer needs to be $880k (19.1% below list).
- Recommended offer: $880k (19.1% below list) — sets the bar for 1% rule.
- Cap rate 6.5% vs local median 2.6% in New York — top-decile yield for the area; either an underpriced asset or a hidden risk that comps aren't pricing in. Stress-test before assuming the spread holds.
Location & tenants
- Location reads 75/100 on livability (#268 in NY, #4,188 nationally) — a middle-class / working-renter tenant base. Strengths: amenities A+, commute A+, health & safety A; Watch: crime F, cost of living F.
- Zoned schools: Ps 153 Maspeth Elementary (math 67% / reading 77%, grade A-, #378 of 2,108 statewide, top 20%, 847 students, 68% FRL); Is 73 Frank Sansivieri Intermediate School (The) (math 48% / reading 71%, grade B, #161 of 729 statewide, top 24%, 1,799 students, 72% FRL); Midwood High School (math 94% / reading 96%, grade A+, #83 of 1,100 statewide, top 8%, 4,062 students, 73% FRL).
- Market conditions: Rents rising fast (+11.9%/yr); 134 active listings in the ZIP; 2 comparable units currently listed for rent nearby; solid renter incomes; 5,302 units permitted in Queens County in 2024 (4,918 in 5+ unit buildings).
- At $8,797/mo this rent would consume 123% of the median local household income ($86k/yr) (locally 1573% of renters already pay >50% of income on rent) — very limited rent-growth headroom before tenants either downsize or default.
Forward outlook
- Local home prices are declining (-3.0%/yr); year-one equity from $8k of loan paydown is wiped out by about $33k of value loss. Plan a longer hold.
- Queens County population projected at +16% by 2050 — long-run rental-demand tailwind backs the buy-and-hold thesis.
Negotiation context
- It's been on market 34 days — a 3% lower offer ($1.06M) is reasonable based on typical stale-listing flexibility.
- 2 sale attempts with the ask held roughly flat each time — persistent listings suggest the price (not the market) is what's stuck; bring a comps-based counter.
- Current owner paid $700k; list at $1.09M implies a 55% gain — meaningful room to come down on a strong offer.
Risks & watch-outs
- Watch-outs: built in 1925 — expect roof / HVAC / electrical / plumbing capex.
- Climate carrying-cost: major wind risk, 39% chance of damaging wind over 30y; extreme-heat days projected 7→14/yr by 2055 (HVAC capex compounding) — expect insurance premiums to compound above CPI over the hold.
Questions for the listing agent
- It's been on market 34 days. Have you received any prior offers? Is the seller open to a 19% concession, seller financing, or rate buy-down credit?
- Built in 1925 — when were the roof, HVAC, electrical panel, plumbing, and water heater last replaced?
- Is there a deadline driving the sale (1031 exchange, divorce, estate, relocation)? That informs how much negotiation room exists.
- Schools are B-rated — typically a magnet for longer-tenancy family renters. What's the average tenant stay here, and is there a school-zone premium baked into asking?
- Crime grade is F in this area — have there been break-ins, vandalism, or insurance claims at this property in the last 3 years? What carrier currently insures it and at what premium?
- The area grade is low — what's the realistic commute time and amenity access for the typical tenant pool here? Any planned neighborhood developments (good or bad) we should know about?
- What's the average days-on-market for RENTAL listings here right now (not sales)? A rising rental-DOM trend means longer vacancies and softer asking-rent achievability than the comps imply.
- What's the recent tenant-quality profile in this submarket — average credit score on applications, eviction rate, late-payment / NSF rate, and stable-employment percentage? A property-management company in the area should have these aggregated.
- How much new apartment / multifamily construction is in the pipeline within 1–3 miles? Heavy new supply (>2% of stock underway) typically softens rents 12–24 months out; light construction supports rent growth.
Investment metrics
- 1% rule
- 0.81% ✗
- Cap rate
- 6.53%
- Cash-on-cash
- 0.86%
- DSCR
- 1.04
- GRM
- 10.3
CMA / ARV
- ARV (on-the-fly)
- $1,106,490
- Comps found
- 12
Show comp detail 12 sales within ~0.75 mi
| Address | Dist | Beds/Ba | Sqft | Sold | Price | $/sf | Match |
|---|---|---|---|---|---|---|---|
| 61-54 56th Ave | 0.24mi | 4/— | 2,400 (+4%) | 3mo | $910,000 | $379 | 80 |
| 57-40 63rd St | 0.32mi | 6/2.0 | 2,200 (-5%) | 3mo | $1,347,500 | $613 | 74 |
| 5738 63rd St | 0.32mi | 5/2.0 | 2,200 (-5%) | 6mo | $1,250,000 | $568 | 72 |
| 6060 Flushing Ave | 0.28mi | 5/2.0 | 2,008 (-13%) | 0mo | $860,000 | $428 | 65 |
| 5611 Remsen Pl | 0.33mi | 4/2.0 | 2,598 (+12%) | 6mo | $999,000 | $385 | 59 |
| 5741 58th St | 0.30mi | 2/— | 2,610 (+13%) | 6mo | $1,250,000 | $479 | 59 |
| 6923 59th Rd | 0.72mi | 5/3.0 | 2,177 (-6%) | 1mo | $999,000 | $459 | 56 |
| 6077 55th St | 0.67mi | 8/3.0 | 2,500 (+8%) | 3mo | $1,080,000 | $432 | 53 |
| 6212 60th Dr | 0.67mi | 8/3.0 | 2,096 (-9%) | 2mo | $1,235,000 | $589 | 52 |
| 62-18 60 Dr | 0.67mi | 5/2.0 | 2,050 (-11%) | 1mo | $950,000 | $463 | 49 |
| 62-31 60th Rd | 0.59mi | 5/2.0 | 2,026 (-12%) | 6mo | $990,000 | $489 | 47 |
| 69-31 59th Rd | 0.73mi | 4/— | 2,016 (-13%) | 5mo | $1,130,000 | $561 | 40 |
Match score weights: distance 35% · size 25% · config 20% · recency 20%. Top-matched comps best support the ARV.
Projected returns pro-forma
-3.0% appreciation · 8.0% rent growth · sell at horizon
- IRR
- -10.0%
- Equity multiple
- 0.62×
- Total profit
- $-116,261
- Equity at exit
- $162,224
- IRR
- 4.7%
- Equity multiple
- 1.42×
- Total profit
- $126,833
- Equity at exit
- $94,070
Cash invested: $304,640 (down + closing). Projections, not guarantees.
Landlord ↔ Tenant lean methodology
- Overall (CITY)
- 0 Strongly Tenant-Friendly
- State New York
- 15 Strongly Tenant-Friendly · D+10
- County
- — inherits STATE
- City New York
- 0 Strongly Tenant-Friendly · D+34
ZIP-level market 11378
- Home prices YoY
- -21.9%
- Rents YoY
- 11.9%
- Active inventory
- 134
- Price-to-rent
- 30.9×
Monthly cashflow live
- Estimated rent
- $8,797 medium interval (Pro) →
- Mortgage (P&I)
- −$5,706
- Tax from tax record
- −$572 /mo · $6,869/yr
- Insurance
- −$453
- HOA
- −$0
- Vacancy / Maint / Mgmt
- −$1,847
- Net cashflow
- $218
Break-even live
Sensitivity live
| Price | -10% $834 | -5% $526 | +0% $218 | +5% $-90 | +10% $-398 |
|---|---|---|---|---|---|
| Rent | -10% $-477 | -5% $-129 | +0% $218 | +5% $566 | +10% $913 |
| Rate | -1.0pp $766 | -0.5pp $495 | base $218 | +0.5pp $-64 | +1.0pp $-350 |
3-unit breakdown (identical units grouped — click to expand)
| Units | Beds | Baths | Est. rent |
|---|---|---|---|
| 3× units | 2 | 1 | $8,796 |
| #1 | 2 | 1 | $2,932 |
| #2 | 2 | 1 | $2,932 |
| #3 | 2 | 1 | $2,932 |
| Total (3 units) | $8,797 | ||
UW: 25.0% down · 7.5% · 30yr · 1.5% tax · 5.0% vac · 8.0% maint · 8.0% mgmt
Financing live
Cash to close
- Down payment
- $272,000
- Closing costs
- $32,640
- Reserves months
- —
- Total cash needed
- —
Loan-product check · same deal, 3 products live
Conventional
25% down · 7.5% · 30yr
- Down + closing
- —
- Monthly P&I
- —
- Monthly cashflow
- —
- DSCR
- —
- Eligible?
- —
Personal DTI + credit; lowest rate.
DSCR
20% down · 8.5% · 30yr
- Down + closing
- —
- Monthly P&I
- —
- Monthly cashflow
- —
- DSCR
- —
- Eligible?
- —
No personal income docs; deal must DSCR.
Hard money
10% down · 12.0% · 12mo
- Down + closing
- —
- Monthly P&I
- —
- Monthly cashflow
- —
- DSCR
- —
- Eligible?
- —
Short-term bridge; refi at stabilization.
Rent comps 2 comps
| Address | Beds | Baths | Sqft | Rent | $/sqft | DOM | Units | Dist |
|---|---|---|---|---|---|---|---|---|
| 1823 Menahan St Ridgewood, NY | 2.0 | 1.0 | 2650 | $3,600 | $1.36 | 24d | 1 | 1.30mi |
| 1720 Menahan St Ridgewood, NY | 3.0 | 1.0 | 3252 | $3,500 | $1.08 | 26d | 1 | 1.43mi |
Listing history 10 events
-
2026-06-04days on market $1,088,000 Active 34 DOM
-
2026-06-03days on market $1,088,000 Active 33 DOM
-
2026-06-01days on market $1,088,000 Active 31 DOM
-
2026-05-31days on market $1,088,000 Active 30 DOM
-
2026-05-01$1,088,000 Active
-
2025-10-15soldstatus $700,000
-
2025-05-26status Pending
-
2025-05-09historical
-
2025-05-02$925,000 Active
-
1991-06-04soldstatus $70,000
ⓘ Source: listings_history table (triggers on properties + properties_extension) + one-shot
backfill from property_details.listing_events for pre-trigger history.
Tax reassessment forecast NY · Partial reset (capped growth)
- Current annual tax
- $6,869 · $572/mo
- Projected year-2 tax
- $12,628 · $1,052/mo
- Expected delta
- +$5,759/yr (+$480/mo · 83.8%)
ⓘ Screening estimate from a state-policy table — verify with the county assessor before closing.
Climate risk First Street
- Flood 1/10 Low FEMA zone X (unshaded) · 0% chance over 30 yrs
- Wildfire 1/10 Low
- Heat 6/10 Major 7 d/yr ≥99°F today · 14 d/yr by 30 yrs out
- Wind 6/10 Major 39% chance of damaging wind over 30 yrs
- Air quality 5/10 Major 6 unhealthy d/yr today · 8 by 30 yrs out
Nearby sold comps map
Loading sold comps map…
Walkable amenities ~0.75 mi
Loading nearby amenities…
Taxation est. · year 1
- Rental income
- $105,564
- − Mortgage interest
- −$60,945
- − Property taxes
- −$6,869
- − Insurance
- −$5,440
- − Repairs & maintenance
- −$8,445
- − Management
- −$8,445
- − Depreciation
- −$31,651
- Taxable loss
- −$16,231
- Est. tax savings @ 24.0%
- +$3,895
- After-tax cash flow
- $6,515/yr
For passive investors: Depreciation is non-cash, so a rental often shows a tax loss while cash-flowing — sheltering income. Rental losses are passive: they offset passive income freely, and up to $25,000/yr can offset ordinary (W-2) income if you actively participate and your MAGI is under $100k (phasing out to $0 by $150k); unused losses carry forward. On sale, claimed depreciation is recaptured at up to 25%, and gains may owe capital-gains tax (a 1031 exchange can defer both). Figures are a year-1 estimate at your 24.0% rate — not tax advice; consult a CPA.
Schools (NCES district)
No district data.
Livability — New York
- Score
- 75/100
- State rank
- #268
- US rank
- #4188
Category grades
Schools grade is shown separately in the Schools card above.
Census & demographics
- Census place
- New York, NY
- County
- Queens County · 1,914,869 people
- City population
- 7,731,280
- Metro
- New York-Newark-Jersey City, NY-NJ-PA
- Population (ZIP)
- 36,392
- Household income
- $85,830
- Rent vs Own
- Severe rent burden
- 1573.0
Population outlook (Queens County) Hauer SSP2
- Today (2025)
- 2,546,320 people
- By 2030
- 2,643,059 · +3.8%
- By 2040
- 2,815,563 · +10.6%
- By 2050
- 2,944,423 · +15.6%
- By 2075
- 3,123,338 · +22.7%
- By 2100
- 3,098,688 · +21.7%
Race, ethnicity, and origin ACS 2023
- Neighborhood character
- Diverse neighborhood (Simpson 0.63)
- Race & ethnicity
- White 48% Hispanic / Latino 35% Asian 15% Two or more races 11%
- Hispanic origin (detail)
- Mexican 5% Puerto Rican 6% Dominican 4%
- Common ancestry
- Romanian 16% Italian 1% Scotch-Irish 1%
- Foreign-born
- 41% · Canada, China, Jamaica
- Languages at home
- 39% English-only · Spanish 27% Russian/Polish/Slavic 16% Chinese 8%
Political lean MEDSL · Queens
- 2024 margin
- Strong D (+24.6) · D 62.3% · R 37.7%
- 2008→2024 swing
- -26.2pp toward R · 2008: 50.8pp · 2024: 24.6pp
- All cycles
- 2024: D+24.6 2020: D+45.2 2016: D+53.4 2012: D+58.5 2008: D+50.8
Not yet ingested
- Civics
- —
Market trends
- HPI YoY
- ▼ -100.25%
- Current HPI
- 358.595
- Rent YoY
- ▲ 11.88%
- Metro
- New York-Newark-Jersey City, NY-NJ-PA
- State GDP YoY
- ▲ 2.60%
- F500 in state
- 92
Industry mix (Fortune 500 HQ in NY)
| Industry | F500 HQs | Revenue |
|---|---|---|
| Financial Services | 10 | $950B |
|
||
| Consumer Goods | 9 | $162B |
|
||
| Insurance | 4 | $225B |
|
||
| Telecommunications | 2 | $144B |
|
||
| Pharmaceuticals | 2 | $112B |
|
||
| Media / Entertainment | 2 | $69B |
|
||
Price history
+1454.3% since first listed6 events — show timeline
- 2026-05-01 Listed $1,088,000 OneKey® MLS as Distributed by MLS Grid
- 2025-10-15 Sold (Public Records) $700,000 Public Records
- 2025-05-26 Pending — OneKey® MLS as Distributed by MLS Grid
- 2025-05-09 Listing Removed — OneKey® MLS as Distributed by MLS Grid
- 2025-05-02 Listed $925,000 OneKey® MLS as Distributed by MLS Grid
- 1991-06-04 Sold (Public Records) $70,000 Public Records
Property tax history
+4.7%/yrLatest (2025): $6,869 · +3.4% YoY. Source: county tax records.
Cash-flow waterfall
monthlySold comps — $/sqft
last 12 mo · ≤1 miLoading sold comps…