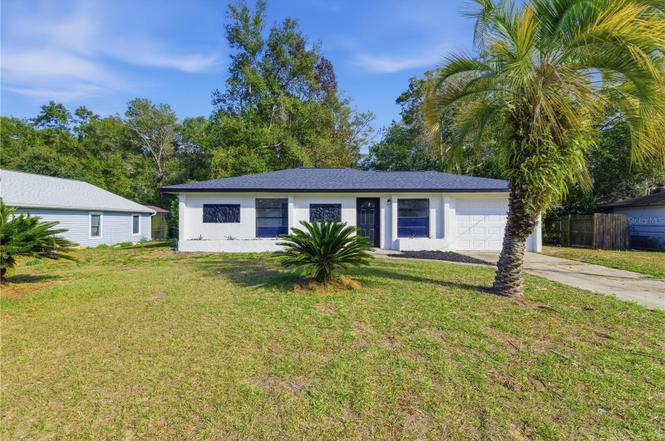
3717 SW Idlewild St · Rainbow Lakes Estates, FL
Flood risk 1/10 · Minimal
- FEMA flood zone
- X (unshaded)
- Chance of flooding over 30 yrs
- 0.0%
- Est. flood insurance / yr
- $507 – $1,088
Fire risk 4/10 · Minor
- Est. fire insurance / yr
- $947 – $1,759
Heat risk 8/10 · Major
- Hot days now (above 106°F)
- 4 days/yr
- Hot days in 30 yrs
- 14 days/yr
Wind risk 9/10 · Severe
- Chance of severe wind over 30 yrs
- 99.0%
Air-quality risk 2/10 · Minimal
- Unhealthy air days now
- 0 days/yr
- Unhealthy air days in 30 yrs
- 1 days/yr
Risk factors via First Street. Map © Google.
Why this score? — see what drove the D+ grade
The composite is a weighted blend of 9 inputs, each scored 0–100. Each bar is that input's sub-score; the figure is the points it added to the 100-point composite (weight × sub-score).
- Cash flow +14.3/30.0
- ARV discount +12.3/15.0
- DSCR +4.4/10.0
- 1% rule +3.8/10.0
- Schools +3.6/10.0
- Rent growth +2.5/5.0
- Livability +2.5/5.0
- Condition / age +2.5/5.0
- Appreciation +0.0/10.0
$183,000
🖨 Deal sheet 📄 Offer letter ✓ Due diligence
Listing remarks MLS
Neat as a Pin. Cute as a Button. New roof 2006, new A/C, water heater and refrigerator in 2006. New tiled back splash in kitchen. Wood flooring, nice neutral colors throughout the home. Very well kept and very well priced. Great starter or winder home.
Key facts
- Brand new roof
- Water heater
- Modern appliances
Tags
Property features AI
Finance
- Other: Property type: Residential, single family; Zoning: R1
- HOA & community: Located in Rainbow Lakes Estates; No association reported
Exterior
- Parking: Attached garage with 1 parking space
- Utilities: Public water; Public sewer; Electricity connected
- Home design: Single family residence; One story; Faces southeast
- Construction: Block and stucco construction; Shingle roof; Slab foundation; Built on a 75 x 140 lot (approx. 0.24 acres)
- Exterior features: Outdoor lighting; Paved road access
Interior
- Kitchen: Dishwasher; Microwave; Range; Refrigerator
- Bedrooms: 2 bedrooms
- Bathrooms: 1 full bathroom
- Heating & cooling: Heat pump heating; Central air conditioning
- Interior features: Ceiling fans
- Laundry & utility: Washer hookup; Electric dryer hookup
Neighborhood map
What this means for you Summary
Snapshot
- This is a 2-bed/1.0-bath single-family listed at $183k.
Deal economics
- At list price, monthly cash flow is $35 ($419/yr) — positive.
- The deal already cash-flows at list — no discount required.
- To meet the 1% rule (rent ≥ 1% of price), the offer needs to be $160k (12.4% below list).
- Recommended offer: $160k (12.4% below list) — sets the bar for 1% rule.
- Cap rate 6.5% vs local median 4.5% in Rainbow Lakes Estates — top-decile yield for the area; either an underpriced asset or a hidden risk that comps aren't pricing in. Stress-test before assuming the spread holds.
Location & tenants
- Location reads: area grade D — affects rentability + tenant quality, not the cash-flow math above.
- Marion (rural): math 42% / reading 43% proficiency, ranked #61 of 73 in FL (top 84%) — families likely to look elsewhere, expect single-tenant / working-renter base with shorter leases; 61% free/reduced lunch — lower-income household profile, screen leases tightly.
- Market conditions: 553 active listings in the ZIP; 4 comparable units currently listed for rent nearby; rentals leasing fast (median 14d on market — plan ~1-2 weeks tenant-placement turnaround); 7,071 units permitted in Marion County in 2024 (534 in 5+ unit buildings).
- This rent runs 34% of the median local income ($57k/yr) — at the standard rent-burdened threshold; future hikes will face affordability resistance.
Forward outlook
- Local home prices are declining (-3.0%/yr); year-one equity from $1k of loan paydown is wiped out by about $5k of value loss. Plan a longer hold.
- Marion County population projected at +13% by 2050 — modest demand growth; plan on rents tracking national, not racing it.
Negotiation context
- It's been on market 52 days — a 3% lower offer ($178k) is reasonable based on typical stale-listing flexibility.
- 6 sale attempts since 22y ago; this cycle's ask is 5% above the opening price — seller raised mid-cycle; expect resistance to lowballs.
- Current owner paid $87k; list at $183k implies a 110% gain — meaningful room to come down on a strong offer.
Risks & watch-outs
- Climate carrying-cost: severe wind risk, 99% chance of damaging wind over 30y; extreme-heat days projected 4→14/yr by 2055 (HVAC capex compounding) — expect insurance premiums to compound above CPI over the hold.
Questions for the listing agent
- It's been on market 52 days. Have you received any prior offers? Is the seller open to a 12% concession, seller financing, or rate buy-down credit?
- Built in 1979 — when were the roof, HVAC, electrical panel, plumbing, and water heater last replaced?
- Is there a deadline driving the sale (1031 exchange, divorce, estate, relocation)? That informs how much negotiation room exists.
- The area grade is low — what's the realistic commute time and amenity access for the typical tenant pool here? Any planned neighborhood developments (good or bad) we should know about?
- What's the average days-on-market for RENTAL listings here right now (not sales)? A rising rental-DOM trend means longer vacancies and softer asking-rent achievability than the comps imply.
- What's the recent tenant-quality profile in this submarket — average credit score on applications, eviction rate, late-payment / NSF rate, and stable-employment percentage? A property-management company in the area should have these aggregated.
- How much new for-sale + rental construction is in the pipeline within 1–3 miles? Heavy new supply typically softens prices + rents 12–24 months out; constrained supply supports both.
Investment metrics
- 1% rule
- 0.88% ✗
- Cap rate
- 6.52%
- Cash-on-cash
- 0.82%
- DSCR
- 1.04
- GRM
- 9.5
CMA / ARV
- ARV (on-the-fly)
- $204,624
- Comps found
- 6
Show comp detail 6 sales within ~0.75 mi
| Address | Dist | Beds/Ba | Sqft | Sold | Price | $/sf | Match |
|---|---|---|---|---|---|---|---|
| 20769 SW Oriole Dr | 0.25mi | 3/2.0 (+1) | 1,013 (+0%) | 10mo | $206,000 | $203 | 70 |
| 20864 SW Rainbow Lakes Blvd | 0.25mi | 3/2.0 (+1) | 1,109 (+10%) | 7mo | $220,000 | $198 | 57 |
| 20604 SW Starling Dr | 0.43mi | 3/2.0 (+1) | 1,089 (+8%) | 6mo | $219,500 | $202 | 52 |
| 21301 SW Rainbow Lakes Blvd | 0.34mi | 3/2.0 (+1) | 1,089 (+8%) | 12mo | $221,000 | $203 | 52 |
| 20855 SW Robin Dr | 0.19mi | 3/2.0 (+1) | 1,089 (+8%) | 22mo | $229,900 | $211 | 50 |
| 20351 SW Cardinal Ave | 0.73mi | 3/2.0 (+1) | 1,096 (+9%) | 10mo | $225,000 | $205 | 34 |
Match score weights: distance 35% · size 25% · config 20% · recency 20%. Top-matched comps best support the ARV.
Projected returns pro-forma
-3.0% appreciation · 3.0% rent growth · sell at horizon
- IRR
- -15.0%
- Equity multiple
- 0.46×
- Total profit
- $-27,427
- Equity at exit
- $27,286
- IRR
- -6.4%
- Equity multiple
- 0.59×
- Total profit
- $-21,006
- Equity at exit
- $15,822
Cash invested: $51,240 (down + closing). Projections, not guarantees.
Landlord ↔ Tenant lean methodology
- Overall (STATE)
- 87 Strongly Landlord-Friendly
- State Florida
- 87 Strongly Landlord-Friendly · R+3
- County
- — inherits STATE
- City
- — inherits STATE
ZIP-level market 34431
- Home prices YoY
- -3.2%
- Active inventory
- 553
- Price-to-rent
- 9.5×
Monthly cashflow live
- Estimated rent
- $1,603 medium interval (Pro) →
- Mortgage (P&I)
- −$960
- Tax from tax record
- −$195 /mo · $2,345/yr
- Insurance
- −$76
- HOA
- −$0
- Vacancy / Maint / Mgmt
- −$337
- Net cashflow
- $35
Break-even live
UW: 25.0% down · 7.5% · 30yr · 1.5% tax · 5.0% vac · 8.0% maint · 8.0% mgmt
Financing live
Cash to close
- Down payment
- $45,750
- Closing costs
- $5,490
- Reserves months
- —
- Total cash needed
- —
Loan-product check · same deal, 3 products live
Conventional
25% down · 7.5% · 30yr
- Down + closing
- —
- Monthly P&I
- —
- Monthly cashflow
- —
- DSCR
- —
- Eligible?
- —
Personal DTI + credit; lowest rate.
DSCR
20% down · 8.5% · 30yr
- Down + closing
- —
- Monthly P&I
- —
- Monthly cashflow
- —
- DSCR
- —
- Eligible?
- —
No personal income docs; deal must DSCR.
Hard money
10% down · 12.0% · 12mo
- Down + closing
- —
- Monthly P&I
- —
- Monthly cashflow
- —
- DSCR
- —
- Eligible?
- —
Short-term bridge; refi at stabilization.
Rent comps 4 comps
| Address | Beds | Baths | Sqft | Rent | $/sqft | DOM | Units | Dist |
|---|---|---|---|---|---|---|---|---|
| 21423 SW Beach Blvd Dunnellon, FL | 3.0 | 2.0 | 1066 | $1,400 | $1.31 | 13d | 1 | 0.45mi |
| 21425 SW Plantation St Dunnellon, FL | 3.0 | 2.0 | 1456 | $1,800 | $1.24 | 13d | 1 | 0.45mi |
| 20024 SW Beach Blvd Dunnellon, FL | 3.0 | 2.0 | 1232 | $1,899 | $1.54 | 21d | 1 | 1.05mi |
| 22222 SW Marine Blvd Dunnellon, FL | 3.0 | 2.0 | 1473 | $1,799 | $1.22 | 13d | 1 | 1.20mi |
Listing history 11 events
-
2026-06-18days on market $183,000 Active 52 DOM
-
2026-06-17days on market $183,000 Active 51 DOM
-
2026-06-16days on market $183,000 Active 50 DOM
-
2026-06-15days on market $183,000 Active 49 DOM
-
2026-06-14days on market $183,000 Active 47 DOM
-
2026-06-13days on market $183,000 Active 46 DOM
-
2026-06-10days on market $183,000 Active 44 DOM
-
2026-06-09days on market $183,000 Active 43 DOM
-
2026-06-08days on market $183,000 Active 42 DOM
-
2026-06-07remarks 681-char remark
-
2026-06-07$183,000 Active 41 DOM
ⓘ Source: listings_history table (triggers on properties + properties_extension) + one-shot
backfill from property_details.listing_events for pre-trigger history.
Tax reassessment forecast FL · Resets to sale price
- Current annual tax
- $2,345 · $195/mo
- Projected year-2 tax
- $2,345 · $195/mo
- Expected delta
- $0/yr ($0/mo · 0.0%)
ⓘ Screening estimate from a state-policy table — verify with the county assessor before closing.
Climate risk First Street
- Flood 1/10 Low FEMA zone X (unshaded) · 0% chance over 30 yrs
- Wildfire 4/10 Moderate
- Heat 8/10 Severe 4 d/yr ≥106°F today · 14 d/yr by 30 yrs out
- Wind 9/10 Extreme 99% chance of damaging wind over 30 yrs
- Air quality 2/10 Low 0 unhealthy d/yr today · 1 by 30 yrs out
Nearby sold comps map
Loading sold comps map…
Walkable amenities ~0.75 mi
Loading nearby amenities…
Taxation est. · year 1
- Rental income
- $19,234
- − Mortgage interest
- −$10,251
- − Property taxes
- −$2,345
- − Insurance
- −$915
- − Repairs & maintenance
- −$1,539
- − Management
- −$1,539
- − Depreciation
- −$5,324
- Taxable loss
- −$2,678
- Est. tax savings @ 24.0%
- +$643
- After-tax cash flow
- $1,062/yr
For passive investors: Depreciation is non-cash, so a rental often shows a tax loss while cash-flowing — sheltering income. Rental losses are passive: they offset passive income freely, and up to $25,000/yr can offset ordinary (W-2) income if you actively participate and your MAGI is under $100k (phasing out to $0 by $150k); unused losses carry forward. On sale, claimed depreciation is recaptured at up to 25%, and gains may owe capital-gains tax (a 1031 exchange can defer both). Figures are a year-1 estimate at your 24.0% rate — not tax advice; consult a CPA.
Schools (NCES district)
- District
- Marion
- NCES district ID
- 1201260
- Math proficiency
- 42% ▼ -7.00%
- Reading proficiency
- 43% ▼ -4.00%
- Median HH income
- $40,015
- Composite
- 35.61/100
- National rank
- #4890
- State rank
- #61 of 73 in FL
Livability — Rainbow Lakes Estates
No livability data for this city. (Only ~50 U.S. cities are tracked.)
Census & demographics
- Census place
- Rainbow Lakes Estates, FL
- County
- Marion County · 315,796 people
- Metro
- Ocala, FL
- Population (ZIP)
- 9,785
- Household income
- $56,534
- Rent vs Own
- Severe rent burden
- 72.0
Population outlook (Marion County) Hauer SSP2
- Today (2025)
- 365,905 people
- By 2030
- 376,768 · +3.0%
- By 2040
- 396,555 · +8.4%
- By 2050
- 412,723 · +12.8%
- By 2075
- 446,090 · +21.9%
- By 2100
- 436,193 · +19.2%
Race, ethnicity, and origin ACS 2023
- Neighborhood character
- Predominantly White (87%)
- Race & ethnicity
- White 87% Hispanic / Latino 7% Two or more races 5% Black 3% Asian 1%
- Hispanic origin (detail)
- Mexican 2% Puerto Rican 4% Cuban 1%
- Common ancestry
- Lithuanian 4% Slovak 3% Portuguese 2%
- Foreign-born
- 4% · Canada, Vietnam
- Languages at home
- 96% English-only · Spanish 2% German/W. Germanic 1% Vietnamese 1%
Political lean MEDSL · Marion
- 2024 margin
- Solid R (+31.6) · D 33.8% · R 65.5%
- 2008→2024 swing
- -20.0pp toward R · 2008: -11.6pp · 2024: -31.6pp
- All cycles
- 2024: R+31.6 2020: R+25.9 2016: R+26.2 2012: R+16.2 2008: R+11.6
Not yet ingested
- Civics
- —
Market trends
- HPI YoY
- ▼ -11.42%
- Current HPI
- 343.1464
- Rent YoY
- —
- Metro
- Ocala, FL
- State GDP YoY
- ▲ 3.28%
- F500 in state
- 36
Industry mix (Fortune 500 HQ in FL)
| Industry | F500 HQs | Revenue |
|---|---|---|
| Industrial Technology | 2 | $29B |
|
||
| Insurance | 2 | $17B |
|
||
| Retail | 1 | $60B |
|
||
| Technology Distribution | 1 | $58B |
|
||
| Homebuilding | 1 | $35B |
|
||
| Technology Manufacturing | 1 | $35B |
|
||
Price history
+357.5% since first listed15 events — show timeline
- 2026-06-06 Price Changed $183,000 Stellar MLS as Distributed by MLS Grid
- 2026-06-06 Relisted — Stellar MLS as Distributed by MLS Grid
- 2026-06-06 Listing Removed — Stellar MLS as Distributed by MLS Grid
- 2026-06-04 Price Changed $183,000 Stellar MLS as Distributed by MLS Grid
- 2026-06-03 Listed $175,000 Stellar MLS as Distributed by MLS Grid
- 2026-03-25 Rental Removed $1,550 STELLARMLS
- 2026-03-05 Listed for Rent $1,550 STELLARMLS
- 2026-01-14 Listed $192,000 Stellar MLS as Distributed by MLS Grid
- 2007-07-24 Sold (Public Records) $87,000 Public Records
- 2007-07-23 Sold (MLS) $87,000 Stellar MLS as Distributed by MLS Grid
- 2007-03-30 Listed $92,000 Stellar MLS as Distributed by MLS Grid
- 2004-12-08 Sold (Public Records) $71,000 Public Records
- 2004-11-30 Sold (MLS) $71,000 Stellar MLS as Distributed by MLS Grid
- 2004-10-14 Listed $71,000 Stellar MLS as Distributed by MLS Grid
- 1988-04-01 Sold (Public Records) $40,000 Public Records
Property tax history
+9.1%/yrLatest (2025): $2,345 · +17.2% YoY. Source: county tax records.
Cash-flow waterfall
monthlySold comps — $/sqft
last 12 mo · ≤1 miLoading sold comps…