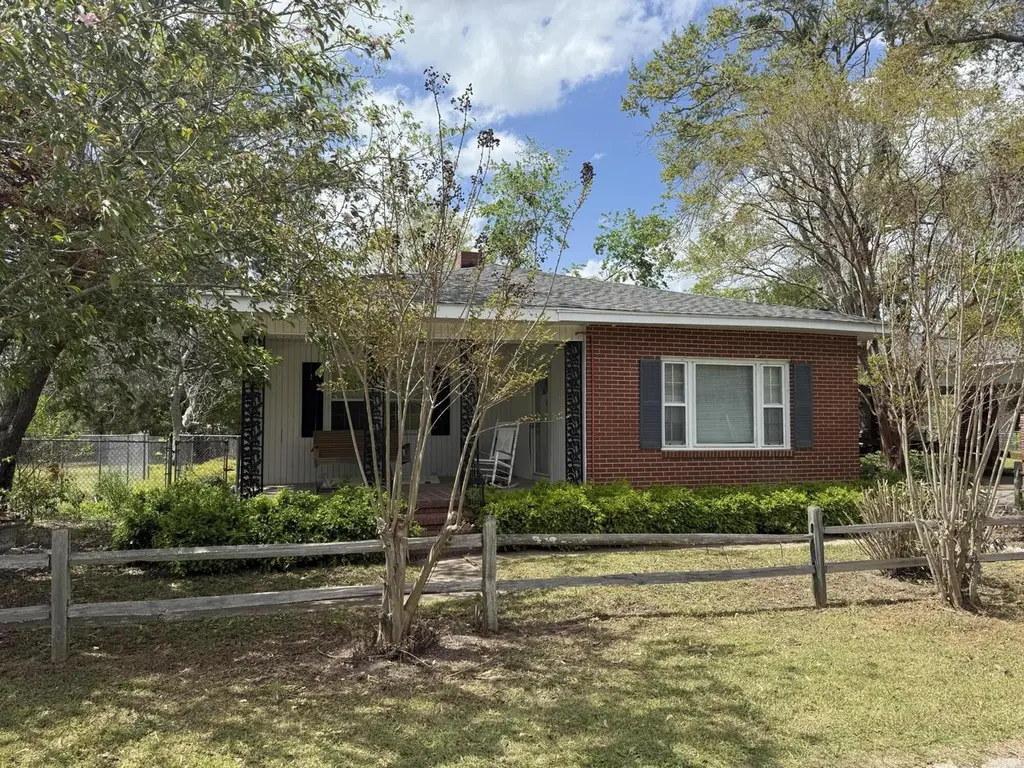
641 S Masonic St · Millen, GA
Flood risk 1/10 · Minimal
- FEMA flood zone
- X (unshaded)
- Chance of flooding over 30 yrs
- 0.0%
- Est. flood insurance / yr
- $507 – $1,088
Fire risk 4/10 · Minor
- Est. fire insurance / yr
- $963 – $1,789
Heat risk 8/10 · Major
- Hot days now (above 110°F)
- 7 days/yr
- Hot days in 30 yrs
- 18 days/yr
Wind risk 8/10 · Major
- Chance of severe wind over 30 yrs
- 80.0%
Air-quality risk 2/10 · Minimal
- Unhealthy air days now
- 2 days/yr
- Unhealthy air days in 30 yrs
- 2 days/yr
Risk factors via First Street. Map © Google.
Why this score? — see what drove the B grade
The composite is a weighted blend of 9 inputs, each scored 0–100. Each bar is that input's sub-score; the figure is the points it added to the 100-point composite (weight × sub-score).
- Cash flow +24.9/30.0
- ARV discount +15.0/15.0
- DSCR +8.1/10.0
- Appreciation +6.8/10.0
- 1% rule +6.1/10.0
- Livability +2.9/5.0
- Rent growth +2.5/5.0
- Condition / age +2.5/5.0
- Schools +2.2/10.0
$115,000
🖨 Deal sheet 📄 Offer letter ✓ Due diligence
Listing remarks
Welcome to this spacious 3-bedroom, 2-bathroom brick home that's ready for your personal touch! Inside, you'll find a functional layout featuring a cozy living room, a kitchen with a bright breakfast area, and a formal dining room-perfect for hosting family gatherings. In addition to the main living areas, this home offers a couple of bonus rooms that can easily become a home office, playroom, craft space, or whatever you imagine. Whether you're looking to renovate or restore, this home provides a great foundation with solid bones. Enjoy your morning coffee on the front porch, park under the covered carport, and take advantage of the backyard complete with storage buildings-ideal for tools,
Key facts
- Cozy living room
- Formal dining room
- Bonus rooms
Tags
Property features AI
Exterior
- Parking: Attached garage; 1 garage parking space; 1 total parking space
- Utilities: Public water; Public sewer; Sewer and water connected
- Home design: Single-family residence; One-story (single level); Entry level is 1
- Construction: Brick construction; See remarks for additional construction details
- Exterior features: Composition roof; No patio or porch; No fencing; Property has a view; Paved road access; City street and state road frontage; Zoned R3
Interior
- Flooring: Carpet; Laminate
- Bathrooms: 2 full bathrooms
- Heating & cooling: Electric heating; Heat pump; Central air conditioning
- Interior features: High ceilings; 7 total rooms; No basement (crawl space)
Neighborhood map
What this means for you Summary
Snapshot
- This is a 3-bed/2.0-bath single-family listed at $115k.
Deal economics
- At list price, monthly cash flow is $245 ($3k/yr) — positive.
- The deal already cash-flows at list — no discount required.
- Meets the 1% rule at list price ($1k rent vs $115k).
- Recommended offer: $112k (3.0% below list) — sets the bar for market timing.
- Cap rate 8.9% vs local median 3.8% in Millen — top-decile yield for the area; either an underpriced asset or a hidden risk that comps aren't pricing in. Stress-test before assuming the spread holds.
Location & tenants
- Location reads 57/100 on livability (#464 in GA) — a working-class tenant base; expect higher turnover. Strengths: cost of living A+, housing A+; Watch: crime D, amenities F, commute F.
- Jenkins County (rural): math 26% / reading 29% proficiency, ranked #119 of 174 in GA (top 68%) — low school quality limits family demand, transient renter base, plan for 1-2y turnover; 72% free/reduced lunch — lower-income household profile, screen leases tightly.
- Zoned schools: Jenkins County Elementary School (math 31% / reading 30%, grade F, #620 of 1,228 statewide, top 51%, 569 students, 93% FRL); Jenkins County Middle School (math 22% / reading 29%, grade F, #288 of 470 statewide, top 62%, 256 students, 93% FRL); Jenkins County High School (math 27% / reading 27%, grade F, #162 of 424 statewide, top 40%, 321 students, 93% FRL) — zoned schools average 93% FRL vs 72% district-wide (21 pts higher); higher-poverty schools than district average — tighter screening recommended.
- Market conditions: 44 active listings in the ZIP; 28 units permitted in Jenkins County in 2024 (0 in 5+ unit buildings).
Forward outlook
- In year one you build about $5k of equity ($795 loan paydown + $4k appreciation (3.7% local appreciation)).
- Jenkins County population projected at +19% by 2050 — long-run rental-demand tailwind backs the buy-and-hold thesis.
- At projected returns (3.7% appreciation + 3.0% rent growth), your $32k cash investment doubles in ~4 years — after that, you're playing with house money.
- By year 7, paydown + projected appreciation supports a ~$32k cash-out refi (75% LTV) — recoverable capital for the next deal without selling this one.
Negotiation context
- It's been on market 38 days — a 3% lower offer ($112k) is reasonable based on typical stale-listing flexibility.
- 9 sale attempts with the ask held roughly flat each time — persistent listings suggest the price (not the market) is what's stuck; bring a comps-based counter.
Risks & watch-outs
- Watch-outs: built in 1930 — expect roof / HVAC / electrical / plumbing capex.
- Climate carrying-cost: severe wind risk, 80% chance of damaging wind over 30y; extreme-heat days projected 7→18/yr by 2055 (HVAC capex compounding) — expect insurance premiums to compound above CPI over the hold.
Questions for the listing agent
- It's been on market 38 days. Have you received any prior offers? Is the seller open to a 3% concession, seller financing, or rate buy-down credit?
- Built in 1930 — when were the roof, HVAC, electrical panel, plumbing, and water heater last replaced?
- Is there a deadline driving the sale (1031 exchange, divorce, estate, relocation)? That informs how much negotiation room exists.
- Schools are F-rated, which usually means shorter tenancies and higher turnover. Who's the typical renter profile here, and what's been the actual vacancy rate?
- Crime grade is D in this area — have there been break-ins, vandalism, or insurance claims at this property in the last 3 years? What carrier currently insures it and at what premium?
- What's the average days-on-market for RENTAL listings here right now (not sales)? A rising rental-DOM trend means longer vacancies and softer asking-rent achievability than the comps imply.
- What's the recent tenant-quality profile in this submarket — average credit score on applications, eviction rate, late-payment / NSF rate, and stable-employment percentage? A property-management company in the area should have these aggregated.
- How much new for-sale + rental construction is in the pipeline within 1–3 miles? Heavy new supply typically softens prices + rents 12–24 months out; constrained supply supports both.
Investment metrics
- 1% rule
- 1.11% ✓
- Cap rate
- 8.85%
- Cash-on-cash
- 9.14%
- DSCR
- 1.41
- GRM
- 7.5
CMA / ARV
- ARV (median comp)
- $157,462
- List price
- $115,000
- Delta
- -26.97%
- Verdict
- UNDERPRICED
- Comps
- 20 within 1.0 mi
Show comp detail 4 sales within ~0.75 mi
| Address | Dist | Beds/Ba | Sqft | Sold | Price | $/sf | Match |
|---|---|---|---|---|---|---|---|
| 606 Edenfield Ave | 0.30mi | 3/2.0 | 1,815 (-13%) | 7mo | $145,000 | $80 | 59 |
| 632 Lane Dr | 0.60mi | 3/2.0 | 2,000 (-4%) | 10mo | $189,999 | $95 | 57 |
| 422 Park Ave | 0.32mi | 4/2.5 (+1) | 1,807 (-13%) | 8mo | $200,000 | $111 | 50 |
| 339 Virginia Ave | 0.55mi | 2/2.0 (-1) | 1,890 (-9%) | 10mo | $155,000 | $82 | 46 |
Match score weights: distance 35% · size 25% · config 20% · recency 20%. Top-matched comps best support the ARV.
Projected returns pro-forma
3.66% appreciation · 3.0% rent growth · sell at horizon
- IRR
- 17.6%
- Equity multiple
- 2.04×
- Total profit
- $33,547
- Equity at exit
- $56,039
- IRR
- 18.6%
- Equity multiple
- 3.88×
- Total profit
- $92,644
- Equity at exit
- $89,891
Cash invested: $32,200 (down + closing). Projections, not guarantees.
Landlord ↔ Tenant lean methodology
- Overall (STATE)
- 90 Strongly Landlord-Friendly
- State Georgia
- 90 Strongly Landlord-Friendly · R+3
- County
- — inherits STATE
- City
- — inherits STATE
ZIP-level market 30442
- Home prices YoY
- 1.4%
- Active inventory
- 44
- Price-to-rent
- 7.5×
Monthly cashflow live
- Estimated rent
- $1,275 medium interval (Pro) →
- Mortgage (P&I)
- −$603
- Tax from tax record
- −$111 /mo · $1,327/yr
- Insurance
- −$48
- HOA
- −$0
- Vacancy / Maint / Mgmt
- −$268
- Net cashflow
- $245
Break-even live
UW: 25.0% down · 7.5% · 30yr · 1.5% tax · 5.0% vac · 8.0% maint · 8.0% mgmt
Financing live
Cash to close
- Down payment
- $28,750
- Closing costs
- $3,450
- Reserves months
- —
- Total cash needed
- —
Loan-product check · same deal, 3 products live
Conventional
25% down · 7.5% · 30yr
- Down + closing
- —
- Monthly P&I
- —
- Monthly cashflow
- —
- DSCR
- —
- Eligible?
- —
Personal DTI + credit; lowest rate.
DSCR
20% down · 8.5% · 30yr
- Down + closing
- —
- Monthly P&I
- —
- Monthly cashflow
- —
- DSCR
- —
- Eligible?
- —
No personal income docs; deal must DSCR.
Hard money
10% down · 12.0% · 12mo
- Down + closing
- —
- Monthly P&I
- —
- Monthly cashflow
- —
- DSCR
- —
- Eligible?
- —
Short-term bridge; refi at stabilization.
Listing history 35 events
-
2026-06-18days on market $115,000 Active 38 DOM
-
2026-06-17days on market $115,000 Active 37 DOM
-
2026-06-16days on market $115,000 Active 36 DOM
-
2026-06-15days on market $115,000 Active 35 DOM
-
2026-06-13days on market $115,000 Active 33 DOM
-
2026-06-12days on market $115,000 Active 32 DOM
-
2026-06-09days on market $115,000 Active 29 DOM
-
2026-06-08days on market $115,000 Active 28 DOM
-
2026-06-07days on market $115,000 Active 27 DOM
-
2026-06-07days on market $115,000 Active 26 DOM
-
2026-06-04days on market $115,000 Active 23 DOM
-
2026-06-02days on market $115,000 Active 22 DOM
-
2026-06-01days on market $115,000 Active 21 DOM
-
2026-05-31days on market $115,000 Active 20 DOM
-
2026-05-31days on market $115,000 Active 19 DOM
-
2026-05-11historical
-
2026-05-05$115,000 Active
-
2026-05-05$115,000 Active 779-char remark
-
2026-03-31historical
-
2026-03-30status Active
-
2026-03-30status Back On Market
-
2026-03-27status Pending
-
2026-03-27historical
-
2026-03-27historical
-
2026-03-25historical Active Under Contract
-
2026-02-12$124,900 Active
-
2026-02-12$124,900
-
2026-01-27price $124,900
-
2025-10-27price $139,900
-
2025-07-19price $150,000
-
2025-06-16price $155,000
-
2025-05-06status New
-
2025-04-15historical
-
2025-04-06$115,000 New
-
2025-04-06$165,000 New
ⓘ Source: listings_history table (triggers on properties + properties_extension) + one-shot
backfill from property_details.listing_events for pre-trigger history.
Tax reassessment forecast GA · Resets to sale price
- Current annual tax
- $1,327 · $111/mo
- Projected year-2 tax
- $1,327 · $111/mo
- Expected delta
- $0/yr ($0/mo · 0.0%)
ⓘ Screening estimate from a state-policy table — verify with the county assessor before closing.
Climate risk First Street
- Flood 1/10 Low FEMA zone X (unshaded) · 0% chance over 30 yrs
- Wildfire 4/10 Moderate
- Heat 8/10 Severe 7 d/yr ≥110°F today · 18 d/yr by 30 yrs out
- Wind 8/10 Severe 80% chance of damaging wind over 30 yrs
- Air quality 2/10 Low 2 unhealthy d/yr today · 2 by 30 yrs out
Nearby sold comps map
Loading sold comps map…
Walkable amenities ~0.75 mi
Loading nearby amenities…
Taxation est. · year 1
- Rental income
- $15,295
- − Mortgage interest
- −$6,442
- − Property taxes
- −$1,327
- − Insurance
- −$575
- − Repairs & maintenance
- −$1,224
- − Management
- −$1,224
- − Depreciation
- −$3,345
- Taxable income
- $1,158
- Est. tax owed @ 24.0%
- −$278
- After-tax cash flow
- $2,666/yr
For passive investors: Depreciation is non-cash, so a rental often shows a tax loss while cash-flowing — sheltering income. Rental losses are passive: they offset passive income freely, and up to $25,000/yr can offset ordinary (W-2) income if you actively participate and your MAGI is under $100k (phasing out to $0 by $150k); unused losses carry forward. On sale, claimed depreciation is recaptured at up to 25%, and gains may owe capital-gains tax (a 1031 exchange can defer both). Figures are a year-1 estimate at your 24.0% rate — not tax advice; consult a CPA.
Schools (NCES district)
- District
- Jenkins County
- NCES district ID
- 1303090
- Math proficiency
- 26% ▼ -6.00%
- Reading proficiency
- 29% ▲ 1.00%
- Median HH income
- $27,711
- Composite
- 21.99/100
- National rank
- #8207
- State rank
- #119 of 174 in GA
Livability — Millen
- Score
- 57/100
- State rank
- #464
- US rank
- #21989
Category grades
Schools grade is shown separately in the Schools card above.
Census & demographics
- Census place
- Millen, GA
- Population (ZIP)
- 8,484
Population outlook (Jenkins County) Hauer SSP2
- Today (2025)
- 10,173 people
- By 2030
- 10,704 · +5.2%
- By 2040
- 11,551 · +13.5%
- By 2050
- 12,087 · +18.8%
- By 2075
- 12,942 · +27.2%
- By 2100
- 11,684 · +14.9%
Race, ethnicity, and origin ACS 2023
- Neighborhood character
- Majority White (54%)
- Race & ethnicity
- White 54% Black 40% Hispanic / Latino 5% Two or more races 4%
- Common ancestry
- Scottish 1% Italian 1%
- Foreign-born
- 2% · Canada
- Languages at home
- 95% English-only · Spanish 4%
Political lean MEDSL · Jenkins
- 2024 margin
- Solid R (+30.4) · D 34.6% · R 65.0%
- 2008→2024 swing
- -17.2pp toward R · 2008: -13.2pp · 2024: -30.4pp
- All cycles
- 2024: R+30.4 2020: R+25.9 2016: R+25.8 2012: R+11.7 2008: R+13.2
Not yet ingested
- Civics
- —
Market trends
- HPI YoY
- ▲ 3.66%
- Current HPI
- 268.1339
- Rent YoY
- —
- Metro
- —
- State GDP YoY
- ▲ 2.66%
- F500 in state
- 28
Industry mix (Fortune 500 HQ in GA)
| Industry | F500 HQs | Revenue |
|---|---|---|
| Paper / Packaging | 2 | $29B |
|
||
| Retail | 1 | $160B |
|
||
| Transportation / Logistics | 1 | $91B |
|
||
| Airlines | 1 | $62B |
|
||
| Consumer Goods | 1 | $47B |
|
||
| Utilities | 1 | $25B |
|
||
Price history
+0.0% since first listed20 events — show timeline
- 2026-05-11 Listing Removed — Hive MLS
- 2026-05-05 Listed $115,000 Hive MLS
- 2026-05-05 Listed $115,000 Hive MLS
- 2026-03-31 Listing Removed — GAMLS
- 2026-03-30 Relisted — Hive MLS
- 2026-03-30 Relisted — GAMLS
- 2026-03-27 Pending — Hive MLS
- 2026-03-27 Listing Removed — Hive MLS
- 2026-03-27 Listing Removed — Hive MLS
- 2026-03-25 Contingent — GAMLS
- 2026-02-12 Listed $124,900 Hive MLS
- 2026-02-12 Listed $124,900 Hive MLS
- 2026-01-27 Price Changed $124,900 GAMLS
- 2025-10-27 Price Changed $139,900 GAMLS
- 2025-07-19 Price Changed $150,000 GAMLS
- 2025-06-16 Price Changed $155,000 GAMLS
- 2025-05-06 Relisted — GAMLS
- 2025-04-15 Listing Removed — GAMLS
- 2025-04-06 Listed $165,000 GAMLS
- 2025-04-06 Listed $115,000 GAMLS
Property tax history
+19.5%/yrLatest (2025): $1,327 · +10.5% YoY. Source: county tax records.
Cash-flow waterfall
monthlySold comps — $/sqft
last 12 mo · ≤1 miLoading sold comps…