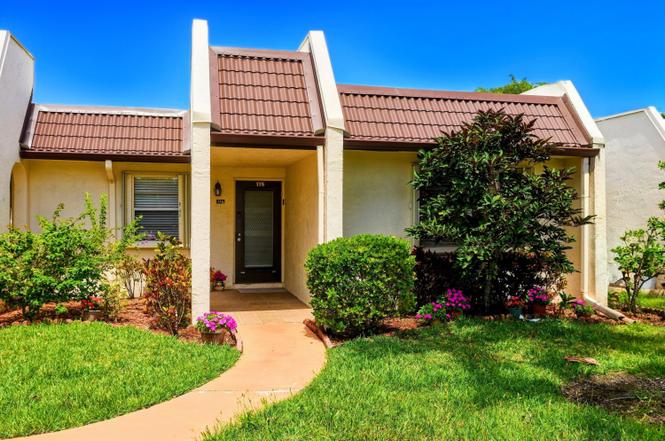
175 Lake Susan Ln · West Palm Beach, FL
Flood risk 1/10 · Minimal
- FEMA flood zone
- X (unshaded)
- Chance of flooding over 30 yrs
- 0.0%
- Est. flood insurance / yr
- $507 – $1,088
Fire risk 5/10 · Moderate
- Est. fire insurance / yr
- $947 – $1,759
Heat risk 10/10 · Severe
- Hot days now (above 106°F)
- 7 days/yr
- Hot days in 30 yrs
- 25 days/yr
Wind risk 10/10 · Severe
- Chance of severe wind over 30 yrs
- 99.0%
Air-quality risk 2/10 · Minimal
- Unhealthy air days now
- 0 days/yr
- Unhealthy air days in 30 yrs
- 1 days/yr
Risk factors via First Street. Map © Google.
Why this score? — see what drove the D grade
The composite is a weighted blend of 9 inputs, each scored 0–100. Each bar is that input's sub-score; the figure is the points it added to the 100-point composite (weight × sub-score).
- Appreciation +10.0/10.0
- ARV discount +7.5/15.0
- Cash flow +5.6/30.0
- Schools +4.3/10.0
- 1% rule +4.1/10.0
- Livability +4.1/5.0
- Rent growth +2.7/5.0
- Condition / age +2.5/5.0
- DSCR +0.1/10.0
$219,990
🖨 Deal sheet 📄 Offer letter ✓ Due diligence
Listing remarks MLS
SPACIOUS END VILLA, PARKING RIGHT IN FRONT, A QUICK WALK TO LAKE SUSAN POOL. LARGE GLASS ENCLOSED PATIO W/ BEAUTIFUL WATER VIEW !! PATIO HAS TWO UTILITY CLOSETS , ONE WITH WASHER & DRYER. LOTS OF STORAGE. ACCORDION SHUTTERS ON ALL WINDOWS & PATIO. NICELY LANDSCAPED FRONT & BACK. LOTS OF AMENITIES IN THIS GUARD GATED COMMUNITY . LOCATED CLOSE TO SHOPPING, RESTAURANTS, & TURNPIKE ! AIRPORT & OCEAN A SHORT DRIVE AWAY ! PARADISE AWAITS !!
Key facts
- Bright white kitchen
- Enclosed sunroom
- Scenic water access
Tags
Property features AI
Finance
- Financial info: Community contains 1,888 units; Senior community
- HOA & community: Has association with monthly fee; Association amenities include pool, fitness center, clubhouse, tennis courts, bocce ball, billiard room, community room, cafe/restaurant, library, courtesy bus, on-site manager/management and parking; Association fee includes cable TV, insurance, grounds maintenance, pest control, security, sewer, water and common areas; Pets allowed with breed and size restrictions
Exterior
- Parking: Assigned open parking (1 space total)
- Security: Gated community with security guard and security patrol; Gated (no guard); Smoke detectors
- Utilities: Public water; Public sewer; Three-phase electric; Cable available
- Home design: Villa (single-story) with entry-level living area; Faces east
- Construction: Stucco and CBS construction; Mixed and tile roof; Built as resale property
- Exterior features: Covered patio; Screened patio; Screened porch; Patio; Porch; Glass-enclosed porch; Sidewalks; Paved road frontage; Waterfront
Interior
- Kitchen: Dishwasher; Disposal; Electric range; Microwave; Refrigerator; Electric water heater
- Bedrooms: 2 bedrooms on the main level
- Flooring: Carpet; Ceramic tile; Tile; Vinyl; Wood
- Bathrooms: 2 full bathrooms on the main level
- Heating & cooling: Central electric heating; Central electric air conditioning
- Interior features: Walk-in closets; Single-hung metal and sliding windows; Furnished negotiable
- Laundry & utility: Inside laundry in a laundry closet
Neighborhood map
What this means for you Summary
Snapshot
- This is a 2-bed/2.0-bath condo listed at $220k.
Deal economics
- At list price, monthly cash flow is $-456 ($-5k/yr) — negative.
- To cash-flow at today's rent, offer at most $140k (36.6% below list).
- To meet the 1% rule (rent ≥ 1% of price), the offer needs to be $199k (9.3% below list).
- Recommended offer: $140k (36.6% below list) — sets the bar for cash-flow.
Location & tenants
- Location reads 82/100 on livability (#75 in FL, #1,255 nationally) — a professional / high-income tenant draw. Strengths: commute A+, housing A+, health & safety A+; Watch: employment C-, crime F.
- Palm Beach (suburban): math 46% / reading 53% proficiency, ranked #34 of 73 in FL (top 47%) — families likely to look elsewhere, expect single-tenant / working-renter base with shorter leases.
- Zoned schools: Benoist Farms Elementary School (math 22% / reading 28%, grade F, #2,030 of 2,144 statewide, top 95%, 421 students, 80% FRL); Jeaga Middle School (math 18% / reading 30%, grade F, #532 of 571 statewide, top 94%, 941 students, 78% FRL); Royal Palm Beach High School (math 22% / reading 38%, grade F, #441 of 667 statewide, top 67%, 2,343 students, 57% FRL) — zoned schools average 72% FRL vs 52% district-wide (20 pts higher); higher-poverty schools than district average — tighter screening recommended.
- Zoned-school proficiency averages 26% at this address vs 50% district-wide (-23 pts) — the specific schools serving this property underperform the Palm Beach average; the district grade overstates school quality for this exact location.
- Market conditions: Rents flat; 574 active listings in the ZIP; 40 comparable units currently listed for rent nearby; rentals at typical pace (median 17d on market — plan ~3-4 weeks tenant-placement turnaround); solid renter incomes; 3,974 units permitted in Palm Beach County in 2024 (1,012 in 5+ unit buildings).
Forward outlook
- In year one you build about $24k of equity ($2k loan paydown + $22k appreciation (10.0% local appreciation)).
- Palm Beach County population projected at +30% by 2050 — long-run rental-demand tailwind backs the buy-and-hold thesis.
- By year 2, paydown + projected appreciation supports a ~$38k cash-out refi (75% LTV) — recoverable capital for the next deal without selling this one.
Negotiation context
- Only 3 days on market — expect competitive offers; lowballing is unlikely to land.
- 2 sale attempts since 4y ago with the ask held roughly flat each time — persistent listings suggest the price (not the market) is what's stuck; bring a comps-based counter.
Risks & watch-outs
- Watch-outs: HOA is 35% of rent.
- Climate carrying-cost: severe wind risk, 99% chance of damaging wind over 30y; moderate wildfire risk; extreme-heat days projected 7→25/yr by 2055 (HVAC capex compounding) — expect insurance premiums to compound above CPI over the hold.
Questions for the listing agent
- What do current leases actually rent for vs. the listed asking? Can we see a recent rent roll and the last 12 months of T-12 income?
- What does the HOA fee cover, when was the last increase, and are there any pending special assessments or reserve-fund shortfalls?
- Any open or pending special assessments — roof, HVAC, plumbing, elevator, façade? What's the per-unit balance and payoff schedule, and is the seller paying it off at close or rolling it to the buyer?
- Is there a deadline driving the sale (1031 exchange, divorce, estate, relocation)? That informs how much negotiation room exists.
- Crime grade is F in this area — have there been break-ins, vandalism, or insurance claims at this property in the last 3 years? What carrier currently insures it and at what premium?
- The area grade is low — what's the realistic commute time and amenity access for the typical tenant pool here? Any planned neighborhood developments (good or bad) we should know about?
- What's the average days-on-market for RENTAL listings here right now (not sales)? A rising rental-DOM trend means longer vacancies and softer asking-rent achievability than the comps imply.
- What's the recent tenant-quality profile in this submarket — average credit score on applications, eviction rate, late-payment / NSF rate, and stable-employment percentage? A property-management company in the area should have these aggregated.
- How much new apartment / multifamily construction is in the pipeline within 1–3 miles? Heavy new supply (>2% of stock underway) typically softens rents 12–24 months out; light construction supports rent growth.
Investment metrics
- 1% rule
- 0.91% ✗
- Cap rate
- 3.81%
- Cash-on-cash
- -8.87%
- DSCR
- 0.61
- GRM
- 9.2
CMA / ARV
No comps found within radius.
Projected returns pro-forma
10.0% appreciation · 0.85% rent growth · sell at horizon
- IRR
- 17.3%
- Equity multiple
- 2.41×
- Total profit
- $86,919
- Equity at exit
- $198,184
- IRR
- 15.9%
- Equity multiple
- 5.41×
- Total profit
- $271,620
- Equity at exit
- $427,392
Cash invested: $61,597 (down + closing). Projections, not guarantees.
Landlord ↔ Tenant lean methodology
- Overall (STATE)
- 87 Strongly Landlord-Friendly
- State Florida
- 87 Strongly Landlord-Friendly · R+3
- County
- — inherits STATE
- City
- — inherits STATE
ZIP-level market 33411
- Home prices YoY
- 1.9%
- Rents YoY
- 0.8%
- Active inventory
- 574
- Price-to-rent
- 9.2×
Monthly cashflow live
- Estimated rent
- $1,995 high interval (Pro) →
- Mortgage (P&I)
- −$1,154
- Tax from tax record
- −$83 /mo · $998/yr
- Insurance
- −$92
- HOA
- −$703
- Vacancy / Maint / Mgmt
- −$419
- Net cashflow
- $-456
Break-even live
UW: 25.0% down · 7.5% · 30yr · 1.5% tax · 5.0% vac · 8.0% maint · 8.0% mgmt
Financing live
Cash to close
- Down payment
- $54,998
- Closing costs
- $6,600
- Reserves months
- —
- Total cash needed
- —
Loan-product check · same deal, 3 products live
Conventional
25% down · 7.5% · 30yr
- Down + closing
- —
- Monthly P&I
- —
- Monthly cashflow
- —
- DSCR
- —
- Eligible?
- —
Personal DTI + credit; lowest rate.
DSCR
20% down · 8.5% · 30yr
- Down + closing
- —
- Monthly P&I
- —
- Monthly cashflow
- —
- DSCR
- —
- Eligible?
- —
No personal income docs; deal must DSCR.
Hard money
10% down · 12.0% · 12mo
- Down + closing
- —
- Monthly P&I
- —
- Monthly cashflow
- —
- DSCR
- —
- Eligible?
- —
Short-term bridge; refi at stabilization.
Rent comps 40 comps
| Address | Beds | Baths | Sqft | Rent | $/sqft | DOM | Units | Dist |
|---|---|---|---|---|---|---|---|---|
| 1133 Golden Lakes Blvd #813 West Palm Beach, FL | 3.0 | 2.0 | 999 | $2,050 | $2.05 | 24d | 1 | 0.12mi |
| 1133 Golden Lakes Blvd #813 West Palm Beach, FL | 3.0 | 2.0 | 1054 | $1,950 | $1.85 | 5d | 1 | 0.12mi |
| 1133 Golden Lakes Blvd #813 West Palm Beach, FL | 3.0 | 2.0 | 999 | $2,050 | $2.05 | 3d | 1 | 0.12mi |
| 1103 Golden Lakes Blvd #1013 West Palm Beach, FL | 3.0 | 2.0 | 999 | $2,000 | $2.00 | 3d | 1 | 0.13mi |
| 1103 Golden Lakes Blvd #1011 West Palm Beach, FL | 3.0 | 2.0 | 999 | $2,100 | $2.10 | 24d | 1 | 0.13mi |
| 1063 Golden Lakes Blvd #322 West Palm Beach, FL | 3.0 | 2.0 | 999 | $2,000 | $2.00 | 14d | 1 | 0.14mi |
| 1139 Lake Terry Dr Unit A West Palm Beach, FL | 3.0 | 2.0 | 918 | $2,300 | $2.51 | 20d | 1 | 0.18mi |
| 959 Lake Terry Dr West Palm Beach, FL | 3.0 | 2.0 | 900 | $2,000 | $2.22 | 24d | 1 | 0.19mi |
| 1020 Lake Victoria Dr Unit B West Palm Beach, FL | 3.0 | 2.0 | 922 | $2,200 | $2.39 | 17d | 1 | 0.19mi |
| 108 Lake Nancy Dr West Palm Beach, FL | 2.0 | 2.0 | 967 | $1,800 | $1.86 | 24d | 1 | 0.27mi |
| 221 Lake Meryl Dr West Palm Beach, FL | 2.0 | 2.0 | 1000 | $1,550 | $1.55 | 24d | 1 | 0.28mi |
| 125 Lake Nancy Dr #241 West Palm Beach, FL | 2.0 | 2.0 | 1193 | $1,900 | $1.59 | 11d | 1 | 0.28mi |
| 1153 Lake Victoria Dr Royal Palm Beach, FL | 2.0 | 1.0 | 708 | $1,725 | $2.44 | 24d | 1 | 0.29mi |
| 1080 N Benoist Farms Rd #204 West Palm Beach, FL | 2.0 | 1.0 | 708 | $1,500 | $2.12 | 17d | 1 | 0.33mi |
| 1068 N Benoist Farms Rd #205 West Palm Beach, FL | 2.0 | 1.0 | 708 | $1,800 | $2.54 | 24d | 1 | 0.35mi |
| 1101 N Benoist Farms Rd #106 West Palm Beach, FL | 2.0 | 1.0 | 708 | $1,700 | $2.40 | 24d | 1 | 0.35mi |
| 1081 N Benoist Farms Rd West Palm Beach, FL | 3.0 | 2.0 | 900 | $1,910 | $2.12 | 1d | 2 | 0.38mi |
| 1081 N Benoist Farms Rd West Palm Beach, FL | 3.0 | 2.0 | 900 | $1,897 | $2.11 | 17d | 1 | 0.38mi |
| 1477 Lake Crystal Dr Unit D West Palm Beach, FL | 2.0 | 2.0 | 928 | $1,975 | $2.13 | 17d | 1 | 0.39mi |
| 1215 N Benoist Farms Rd #203 West Palm Beach, FL | 2.0 | 1.0 | 708 | $1,750 | $2.47 | 24d | 1 | 0.40mi |
| 1465 Lake Crystal Dr Unit A West Palm Beach, FL | 2.0 | 2.0 | 904 | $1,900 | $2.10 | 2d | 1 | 0.42mi |
| 1455 Lake Crystal Dr Unit H West Palm Beach, FL | 2.0 | 2.0 | 904 | $1,850 | $2.05 | 15d | 1 | 0.47mi |
| 1455 Lake Crystal Dr Unit H West Palm Beach, FL | 2.0 | 2.0 | 904 | $1,850 | $2.05 | 14d | 1 | 0.47mi |
| 1453 Lake Crystal Dr Unit D West Palm Beach, FL | 2.0 | 2.0 | 904 | $1,900 | $2.10 | 14d | 1 | 0.48mi |
| 1525 Lake Crystal Dr Unit C West Palm Beach, FL | 2.0 | 2.0 | 904 | $1,800 | $1.99 | 7d | 1 | 0.48mi |
| 1440 Windorah Way Unit D West Palm Beach, FL | 2.0 | 2.0 | 904 | $1,900 | $2.10 | 4d | 1 | 0.48mi |
| 138 Lake Frances Dr West Palm Beach, FL | 2.0 | 2.0 | 812 | $1,845 | $2.27 | 24d | 1 | 0.49mi |
| 1421 Windorah Way Unit E West Palm Beach, FL | 2.0 | 2.0 | 904 | $1,975 | $2.18 | 15d | 1 | 0.51mi |
| 1421 Windorah Way Unit E West Palm Beach, FL | 2.0 | 2.0 | 904 | $1,975 | $2.18 | 24d | 1 | 0.51mi |
| 161 Lake Frances Dr Unit 161 West Palm Beach, FL | 1.0 | 1.5 | 704 | $1,430 | $2.03 | 7d | 1 | 0.52mi |
| 1545 Lake Crystal Dr Unit D West Palm Beach, FL | 1.0 | 1.0 | 700 | $1,675 | $2.39 | 14d | 1 | 0.52mi |
| 1500 Windorah Way Unit D West Palm Beach, FL | 2.0 | 2.0 | 904 | $1,850 | $2.05 | 24d | 1 | 0.52mi |
| 1500 Windorah Way Unit D West Palm Beach, FL | 2.0 | 2.0 | 904 | $1,850 | $2.05 | 7d | 1 | 0.52mi |
| 1542 Lake Crystal Dr Unit H West Palm Beach, FL | 2.0 | 2.0 | 900 | $1,900 | $2.11 | 24d | 1 | 0.53mi |
| 1542 Lake Crystal Dr Unit H West Palm Beach, FL | 2.0 | 2.0 | 900 | $1,900 | $2.11 | 22d | 1 | 0.53mi |
| 1461 Windorah Way Unit E West Palm Beach, FL | 2.0 | 2.0 | 904 | $1,900 | $2.10 | 7d | 1 | 0.53mi |
| 1547 Lake Crystal Dr Unit A West Palm Beach, FL | 2.0 | 2.0 | 900 | $1,950 | $2.17 | 24d | 1 | 0.55mi |
| 1547 Lake Crystal Dr Unit A West Palm Beach, FL | 2.0 | 2.0 | 900 | $1,900 | $2.11 | 14d | 1 | 0.55mi |
| 1540 Windorah Way Unit D West Palm Beach, FL | 2.0 | 2.0 | 904 | $1,850 | $2.05 | 18d | 1 | 0.55mi |
| 1564 Lake Crystal Dr Unit F West Palm Beach, FL | 2.0 | 2.0 | 904 | $1,850 | $2.05 | 17d | 1 | 0.58mi |
HOA detail condo
- Monthly dues
- $703 · $8,436/yr
- Likely covers
- waterpoolsecurity
- Assessments
- None detected in remarks — confirm with the listing agent.
Listing history 4 events
-
2026-06-18days on market $219,990 Active 3 DOM
-
2026-06-17days on market $219,990 Active 2 DOM
-
2026-06-15remarks 699-char remark
-
2026-06-15$219,990 Active 1 DOM
ⓘ Source: listings_history table (triggers on properties + properties_extension) + one-shot
backfill from property_details.listing_events for pre-trigger history.
Tax reassessment forecast FL · Resets to sale price
- Current annual tax
- $998 · $83/mo
- Projected year-2 tax
- $1,826 · $152/mo
- Expected delta
- +$828/yr (+$69/mo · 82.9%)
ⓘ Screening estimate from a state-policy table — verify with the county assessor before closing.
Climate risk First Street
- Flood 1/10 Low FEMA zone X (unshaded) · 0% chance over 30 yrs
- Wildfire 5/10 Major
- Heat 10/10 Extreme 7 d/yr ≥106°F today · 25 d/yr by 30 yrs out
- Wind 10/10 Extreme 99% chance of damaging wind over 30 yrs
- Air quality 2/10 Low 0 unhealthy d/yr today · 1 by 30 yrs out
Nearby sold comps map
Loading sold comps map…
Walkable amenities ~0.75 mi
Loading nearby amenities…
Taxation est. · year 1
- Rental income
- $23,939
- − Mortgage interest
- −$12,323
- − Property taxes
- −$998
- − Insurance
- −$1,100
- − Repairs & maintenance
- −$1,915
- − Management
- −$1,915
- − HOA
- −$8,436
- − Depreciation
- −$6,400
- Taxable loss
- −$9,148
- Est. tax savings @ 24.0%
- +$2,196
- After-tax cash flow
- $-3,271/yr
For passive investors: Depreciation is non-cash, so a rental often shows a tax loss while cash-flowing — sheltering income. Rental losses are passive: they offset passive income freely, and up to $25,000/yr can offset ordinary (W-2) income if you actively participate and your MAGI is under $100k (phasing out to $0 by $150k); unused losses carry forward. On sale, claimed depreciation is recaptured at up to 25%, and gains may owe capital-gains tax (a 1031 exchange can defer both). Figures are a year-1 estimate at your 24.0% rate — not tax advice; consult a CPA.
Schools (NCES district)
- District
- Palm Beach
- NCES district ID
- 1201500
- Math proficiency
- 46% ▼ -16.00%
- Reading proficiency
- 53% ▼ -4.00%
- Median HH income
- $53,943
- Composite
- 42.72/100
- National rank
- #3160
- State rank
- #34 of 73 in FL
Livability — West Palm Beach
- Score
- 82/100
- State rank
- #75
- US rank
- #1255
Category grades
Schools grade is shown separately in the Schools card above.
Census & demographics
- County
- Palm Beach County · 1,438,312 people
- City population
- 222,012
- Metro
- Miami-Fort Lauderdale-Pompano Beach, FL
- Population (ZIP)
- 76,863
- Household income
- $92,591
- Rent vs Own
- Severe rent burden
- 1870.0
Population outlook (Palm Beach County) Hauer SSP2
- Today (2025)
- 1,637,487 people
- By 2030
- 1,743,255 · +6.5%
- By 2040
- 1,948,712 · +19.0%
- By 2050
- 2,132,979 · +30.3%
- By 2075
- 2,530,027 · +54.5%
- By 2100
- 2,706,979 · +65.3%
Race, ethnicity, and origin ACS 2023
- Neighborhood character
- Diverse neighborhood (Simpson 0.70)
- Race & ethnicity
- White 44% Hispanic / Latino 24% Black 23% Two or more races 16% Asian 5%
- Hispanic origin (detail)
- Mexican 2% Puerto Rican 5% Cuban 4% Dominican 2%
- Common ancestry
- Hispanic 6% Romanian 2% Italian 1%
- Foreign-born
- 26% · Canada, Jamaica, China
- Languages at home
- 73% English-only · Spanish 17% French/Haitian/Cajun 4% Other Indo-European 2%
Political lean MEDSL · Palm Beach
- 2024 margin
- Toss-up / Even · D 50.0% · R 49.2%
- 2008→2024 swing
- -22.1pp toward R · 2008: 22.9pp · 2024: 0.8pp
- All cycles
- 2024: D+0.8 2020: D+12.8 2016: D+15.3 2012: D+17.0 2008: D+22.9
Not yet ingested
- Civics
- —
Market trends
- HPI YoY
- ▲ 17.04%
- Current HPI
- 903.78
- Rent YoY
- ▲ 0.85%
- Metro
- Miami-Fort Lauderdale-Pompano Beach, FL
- State GDP YoY
- ▲ 3.28%
- F500 in state
- 36
Industry mix (Fortune 500 HQ in FL)
| Industry | F500 HQs | Revenue |
|---|---|---|
| Industrial Technology | 2 | $29B |
|
||
| Insurance | 2 | $17B |
|
||
| Retail | 1 | $60B |
|
||
| Technology Distribution | 1 | $58B |
|
||
| Homebuilding | 1 | $35B |
|
||
| Technology Manufacturing | 1 | $35B |
|
||
Price history
+150.0% since first listed8 events — show timeline
- 2026-06-15 Listed $219,990 Beaches MLS
- 2022-11-18 Sold (Public Records) $220,000 Public Records
- 2022-11-09 Sold (MLS) $220,000 Beaches MLS
- 2022-10-08 Pending — Beaches MLS
- 2022-10-04 Listed $225,000 Beaches MLS
- 2010-07-12 Sold (Public Records) $73,500 Public Records
- 2004-01-21 Sold (Public Records) $86,000 Public Records
- 2003-11-19 Sold (Public Records) $88,000 Public Records
Property tax history
+1.1%/yrLatest (2025): $998 · +4.1% YoY. Source: county tax records.
Cash-flow waterfall
monthlySold comps — $/sqft
last 12 mo · ≤1 miLoading sold comps…