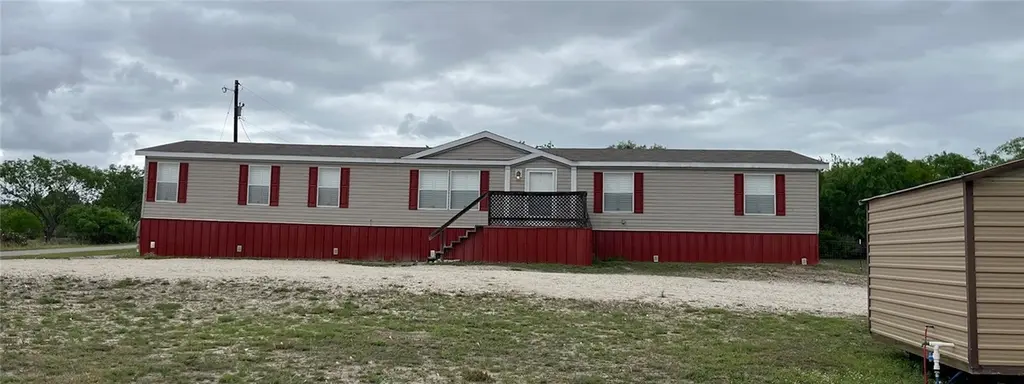
695 S Vista · Lakeshore Gardens-Hidden Acres, TX
Flood risk 1/10 · Minimal
- FEMA flood zone
- X (unshaded)
- Chance of flooding over 30 yrs
- 0.0%
- Est. flood insurance / yr
- $507 – $1,088
Fire risk 6/10 · Moderate
- Est. fire insurance / yr
- $1,222 – $2,270
Heat risk 9/10 · Severe
- Hot days now (above 110°F)
- 7 days/yr
- Hot days in 30 yrs
- 22 days/yr
Wind risk 9/10 · Severe
- Chance of severe wind over 30 yrs
- 99.0%
Air-quality risk 1/10 · Minimal
- Unhealthy air days now
- 0 days/yr
- Unhealthy air days in 30 yrs
- 0 days/yr
Risk factors via First Street. Map © Google.
Why this score? — see what drove the C+ grade
The composite is a weighted blend of 9 inputs, each scored 0–100. Each bar is that input's sub-score; the figure is the points it added to the 100-point composite (weight × sub-score).
- Cash flow +24.0/30.0
- ARV discount +15.0/15.0
- DSCR +7.7/10.0
- 1% rule +5.2/10.0
- Schools +4.8/10.0
- Rent growth +2.5/5.0
- Livability +2.5/5.0
- Condition / age +2.5/5.0
- Appreciation +0.0/10.0
$150,000
🖨 Deal sheet 📄 Offer letter ✓ Due diligence
Listing remarks MLS
LOT FOR SALE CLOSE TO LAKE CORPUS CHRISTI. OWNER IS SELLING 4 LOTS LOCATED NEXT TO EACH OTHER. NO WATER AND NO SEPTIC. OTHER LOTS ARE 12,13,14 LISTED SEPARATELY.
Key facts
- 0.99 acre lot
- Built 2012
- Listed 46 days
Property features AI
Finance
- HOA & community: Short-term rentals allowed
Exterior
- Parking: Parking details not provided
- Security: No security features listed
- Utilities: Overhead utilities available; Sewer available (private sewer); Septic available; Water available (public, private, well)
- Home design: Single-story; Vinyl siding
- Construction: Shingle roof
- Exterior features: No notable exterior features listed; Asphalt road access; Interior lot
Interior
- Kitchen: Electric cooktop; Free-standing range; Range hood
- Bedrooms: Bedrooms on main level
- Flooring: Vinyl
- Bathrooms: 2 full bathrooms
- Heating & cooling: Central air
- Interior features: Open floorplan; Split bedrooms; Window treatments; Ceiling fan(s); Kitchen island; Window coverings
- Laundry & utility: Washer hookup; Dryer hookup
Neighborhood map
What this means for you Summary
Snapshot
- This is a 4-bed/2.0-bath manufactured listed at $150k.
Deal economics
- At list price, monthly cash flow is $295 ($4k/yr) — positive.
- The deal already cash-flows at list — no discount required.
- Meets the 1% rule at list price ($2k rent vs $150k).
- Recommended offer: $146k (3.0% below list) — sets the bar for market timing.
- Cap rate 8.7% vs local median 3.8% in Lakeshore Gardens-Hidden Acres — top-decile yield for the area; either an underpriced asset or a hidden risk that comps aren't pricing in. Stress-test before assuming the spread holds.
Location & tenants
- Location reads: area grade C — affects rentability + tenant quality, not the cash-flow math above.
- George West ISD (rural): math 55% / reading 59% proficiency, ranked #95 of 826 in TX (top 12%) — acceptable for families but not a draw, mixed tenant base, ~2y average lease.
- Market conditions: 118 active listings in the ZIP; 12 units permitted in Live Oak County in 2024 (0 in 5+ unit buildings).
Forward outlook
- Local home prices are declining (-3.0%/yr); year-one equity from $1k of loan paydown is wiped out by about $4k of value loss. Plan a longer hold.
- Live Oak County population projected at +33% by 2050 — long-run rental-demand tailwind backs the buy-and-hold thesis.
Negotiation context
- It's been on market 47 days — a 3% lower offer ($146k) is reasonable based on typical stale-listing flexibility.
- 2 sale attempts since 7y ago with the ask held roughly flat each time — persistent listings suggest the price (not the market) is what's stuck; bring a comps-based counter.
Risks & watch-outs
- Climate carrying-cost: severe wind risk, 99% chance of damaging wind over 30y; major wildfire risk; extreme-heat days projected 7→22/yr by 2055 (HVAC capex compounding) — expect insurance premiums to compound above CPI over the hold.
Questions for the listing agent
- It's been on market 47 days. Have you received any prior offers? Is the seller open to a 3% concession, seller financing, or rate buy-down credit?
- Is there a deadline driving the sale (1031 exchange, divorce, estate, relocation)? That informs how much negotiation room exists.
- What's the average days-on-market for RENTAL listings here right now (not sales)? A rising rental-DOM trend means longer vacancies and softer asking-rent achievability than the comps imply.
- What's the recent tenant-quality profile in this submarket — average credit score on applications, eviction rate, late-payment / NSF rate, and stable-employment percentage? A property-management company in the area should have these aggregated.
- How much new for-sale + rental construction is in the pipeline within 1–3 miles? Heavy new supply typically softens prices + rents 12–24 months out; constrained supply supports both.
Investment metrics
- 1% rule
- 1.02% ✓
- Cap rate
- 8.65%
- Cash-on-cash
- 8.43%
- DSCR
- 1.37
- GRM
- 8.2
CMA / ARV
- ARV (median comp)
- $291,450
- List price
- $150,000
- Delta
- -48.53%
- Verdict
- UNDERPRICED
- Comps
- 11 within 1.0 mi
Projected returns pro-forma
-3.0% appreciation · 3.0% rent growth · sell at horizon
- IRR
- -3.5%
- Equity multiple
- 0.87×
- Total profit
- $-5,578
- Equity at exit
- $22,365
- IRR
- 6.1%
- Equity multiple
- 1.45×
- Total profit
- $19,108
- Equity at exit
- $12,969
Cash invested: $42,000 (down + closing). Projections, not guarantees.
Landlord ↔ Tenant lean methodology
- Overall (STATE)
- 87 Strongly Landlord-Friendly
- State Texas
- 87 Strongly Landlord-Friendly · R+5
- County
- — inherits STATE
- City
- — inherits STATE
ZIP-level market 78383
- Home prices YoY
- -12.8%
- Active inventory
- 118
- Price-to-rent
- 8.2×
Monthly cashflow live
- Estimated rent
- $1,526 medium interval (Pro) →
- Mortgage (P&I)
- −$787
- Tax from tax record
- −$61 /mo · $733/yr
- Insurance
- −$62
- HOA
- −$0
- Vacancy / Maint / Mgmt
- −$320
- Net cashflow
- $295
Break-even live
UW: 25.0% down · 7.5% · 30yr · 1.5% tax · 5.0% vac · 8.0% maint · 8.0% mgmt
Financing live
Cash to close
- Down payment
- $37,500
- Closing costs
- $4,500
- Reserves months
- —
- Total cash needed
- —
Loan-product check · same deal, 3 products live
Conventional
25% down · 7.5% · 30yr
- Down + closing
- —
- Monthly P&I
- —
- Monthly cashflow
- —
- DSCR
- —
- Eligible?
- —
Personal DTI + credit; lowest rate.
DSCR
20% down · 8.5% · 30yr
- Down + closing
- —
- Monthly P&I
- —
- Monthly cashflow
- —
- DSCR
- —
- Eligible?
- —
No personal income docs; deal must DSCR.
Hard money
10% down · 12.0% · 12mo
- Down + closing
- —
- Monthly P&I
- —
- Monthly cashflow
- —
- DSCR
- —
- Eligible?
- —
Short-term bridge; refi at stabilization.
Listing history 23 events
-
2026-06-19days on market $150,000 Active 47 DOM
-
2026-06-18days on market $150,000 Active 46 DOM
-
2026-06-17days on market $150,000 Active 45 DOM
-
2026-06-16days on market $150,000 Active 44 DOM
-
2026-06-15days on market $150,000 Active 43 DOM
-
2026-06-14days on market $150,000 Active 41 DOM
-
2026-06-12days on market $150,000 Active 40 DOM
-
2026-06-09days on market $150,000 Active 37 DOM
-
2026-06-08days on market $150,000 Active 36 DOM
-
2026-06-07days on market $150,000 Active 35 DOM
-
2026-06-05days on market $150,000 Active 33 DOM
-
2026-06-02days on market $150,000 Active 30 DOM
-
2026-06-01days on market $150,000 Active 29 DOM
-
2026-05-31days on market $150,000 Active 28 DOM
-
2026-05-30days on market $150,000 Active 27 DOM
-
2026-04-29$150,000 Active 581-char remark
-
2020-09-02historical 161-char remark
Show marketing remark (161 chars)
LOT FOR SALE CLOSE TO LAKE CORPUS CHRISTI. OWNER IS SELLING 4 LOTS LOCATED NEXT TO EACH OTHER. NO WATER AND NO SEPTIC. OTHER LOTS ARE 12,13,14 LISTED SEPARATELY.
-
2020-07-24soldstatus Closed 161-char remark
Show marketing remark (161 chars)
LOT FOR SALE CLOSE TO LAKE CORPUS CHRISTI. OWNER IS SELLING 4 LOTS LOCATED NEXT TO EACH OTHER. NO WATER AND NO SEPTIC. OTHER LOTS ARE 12,13,14 LISTED SEPARATELY.
-
2020-07-24soldstatus
Show marketing remark (161 chars)
LOT FOR SALE CLOSE TO LAKE CORPUS CHRISTI. OWNER IS SELLING 4 LOTS LOCATED NEXT TO EACH OTHER. NO WATER AND NO SEPTIC. OTHER LOTS ARE 12,13,14 LISTED SEPARATELY.
-
2020-07-02status Pending 161-char remark
Show marketing remark (161 chars)
LOT FOR SALE CLOSE TO LAKE CORPUS CHRISTI. OWNER IS SELLING 4 LOTS LOCATED NEXT TO EACH OTHER. NO WATER AND NO SEPTIC. OTHER LOTS ARE 12,13,14 LISTED SEPARATELY.
-
2020-06-30historical Active Under Contract 161-char remark
Show marketing remark (161 chars)
LOT FOR SALE CLOSE TO LAKE CORPUS CHRISTI. OWNER IS SELLING 4 LOTS LOCATED NEXT TO EACH OTHER. NO WATER AND NO SEPTIC. OTHER LOTS ARE 12,13,14 LISTED SEPARATELY.
-
2020-05-01price $5,000 161-char remark
Show marketing remark (161 chars)
LOT FOR SALE CLOSE TO LAKE CORPUS CHRISTI. OWNER IS SELLING 4 LOTS LOCATED NEXT TO EACH OTHER. NO WATER AND NO SEPTIC. OTHER LOTS ARE 12,13,14 LISTED SEPARATELY.
-
2019-09-06$6,500 Active 161-char remark
Show marketing remark (161 chars)
LOT FOR SALE CLOSE TO LAKE CORPUS CHRISTI. OWNER IS SELLING 4 LOTS LOCATED NEXT TO EACH OTHER. NO WATER AND NO SEPTIC. OTHER LOTS ARE 12,13,14 LISTED SEPARATELY.
ⓘ Source: listings_history table (triggers on properties + properties_extension) + one-shot
backfill from property_details.listing_events for pre-trigger history.
Tax reassessment forecast TX · Resets to sale price
- Current annual tax
- $733 · $61/mo
- Projected year-2 tax
- $2,745 · $229/mo
- Expected delta
- +$2,012/yr (+$168/mo · 274.3%)
ⓘ Screening estimate from a state-policy table — verify with the county assessor before closing.
Climate risk First Street
- Flood 1/10 Low FEMA zone X (unshaded) · 0% chance over 30 yrs
- Wildfire 6/10 Major
- Heat 9/10 Extreme 7 d/yr ≥110°F today · 22 d/yr by 30 yrs out
- Wind 9/10 Extreme 99% chance of damaging wind over 30 yrs
- Air quality 1/10 Low 0 unhealthy d/yr today · 0 by 30 yrs out
Nearby sold comps map
Loading sold comps map…
Walkable amenities ~0.75 mi
Loading nearby amenities…
Taxation est. · year 1
- Rental income
- $18,306
- − Mortgage interest
- −$8,402
- − Property taxes
- −$733
- − Insurance
- −$750
- − Repairs & maintenance
- −$1,464
- − Management
- −$1,464
- − Depreciation
- −$4,364
- Taxable income
- $1,128
- Est. tax owed @ 24.0%
- −$271
- After-tax cash flow
- $3,268/yr
For passive investors: Depreciation is non-cash, so a rental often shows a tax loss while cash-flowing — sheltering income. Rental losses are passive: they offset passive income freely, and up to $25,000/yr can offset ordinary (W-2) income if you actively participate and your MAGI is under $100k (phasing out to $0 by $150k); unused losses carry forward. On sale, claimed depreciation is recaptured at up to 25%, and gains may owe capital-gains tax (a 1031 exchange can defer both). Figures are a year-1 estimate at your 24.0% rate — not tax advice; consult a CPA.
Schools (NCES district)
- District
- George West ISD
- NCES district ID
- 4820550
- Math proficiency
- 55% ▼ -7.00%
- Reading proficiency
- 59% ▲ 2.00%
- Median HH income
- $45,721
- Composite
- 48.17/100
- National rank
- #2175
- State rank
- #95 of 826 in TX
Livability — Lakeshore Gardens-Hidden Acres
No livability data for this city. (Only ~50 U.S. cities are tracked.)
Census & demographics
- Population (ZIP)
- 4,306
Population outlook (Live Oak County) Hauer SSP2
- Today (2025)
- 13,886 people
- By 2030
- 14,793 · +6.5%
- By 2040
- 16,633 · +19.8%
- By 2050
- 18,511 · +33.3%
- By 2075
- 23,859 · +71.8%
- By 2100
- 26,396 · +90.1%
Race, ethnicity, and origin ACS 2023
- Neighborhood character
- Diverse neighborhood (Simpson 0.57)
- Race & ethnicity
- White 51% Hispanic / Latino 40% Two or more races 17% Black 4% Pacific Islander 1%
- Hispanic origin (detail)
- Mexican 29%
- Common ancestry
- Lithuanian 3% Romanian 3% Italian 1%
- Foreign-born
- 5% · Canada
- Languages at home
- 80% English-only · Spanish 19% Other Asian/Pacific 1%
Political lean MEDSL · Live Oak
- 2024 margin
- Solid R (+69.6) · D 14.9% · R 84.6%
- 2008→2024 swing
- -20.6pp toward R · 2008: -49.0pp · 2024: -69.6pp
- All cycles
- 2024: R+69.6 2020: R+66.9 2016: R+63.5 2012: R+54.5 2008: R+49.0
Not yet ingested
- Civics
- —
Market trends
- HPI YoY
- ▼ -26.06%
- Current HPI
- 178.3727
- Rent YoY
- —
- Metro
- —
- State GDP YoY
- ▲ 3.95%
- F500 in state
- 110
Industry mix (Fortune 500 HQ in TX)
| Industry | F500 HQs | Revenue |
|---|---|---|
| Energy | 16 | $1,198B |
|
||
| Technology | 5 | $198B |
|
||
| Engineering / Construction | 4 | $72B |
|
||
| Energy Services | 3 | $60B |
|
||
| Utilities | 3 | $41B |
|
||
| Healthcare | 2 | $330B |
|
||
Price history
+2207.7% since first listed8 events — show timeline
- 2026-04-29 Listed $150,000 CBMLS
- 2020-09-02 Delisted — CBMLS
- 2020-07-24 Sold (Public Records) — Public Records
- 2020-07-24 Sold (MLS) — CBMLS
- 2020-07-02 Pending — CBMLS
- 2020-06-30 Contingent — CBMLS
- 2020-05-01 Price Changed $5,000 CBMLS
- 2019-09-06 Listed $6,500 CBMLS
Property tax history
+45.3%/yrLatest (2025): $733 · +1.9% YoY. Source: county tax records.
Cash-flow waterfall
monthlySold comps — $/sqft
last 12 mo · ≤1 miLoading sold comps…