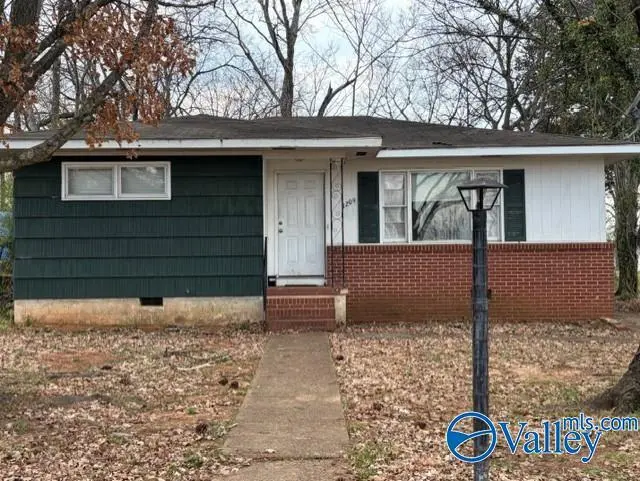
1209 11th Ave SE · Decatur, AL
Flood risk 1/10 · Minimal
- FEMA flood zone
- X (unshaded)
- Chance of flooding over 30 yrs
- 0.0%
- Est. flood insurance / yr
- $507 – $1,088
Fire risk 1/10 · Minimal
- Est. fire insurance / yr
- $916 – $1,700
Heat risk 5/10 · Moderate
- Hot days now (above 106°F)
- 7 days/yr
- Hot days in 30 yrs
- 18 days/yr
Wind risk 4/10 · Minor
- Chance of severe wind over 30 yrs
- 19.0%
Air-quality risk 2/10 · Minimal
- Unhealthy air days now
- 1 days/yr
- Unhealthy air days in 30 yrs
- 1 days/yr
Risk factors via First Street. Map © Google.
Why this score? — see what drove the C+ grade
The composite is a weighted blend of 9 inputs, each scored 0–100. Each bar is that input's sub-score; the figure is the points it added to the 100-point composite (weight × sub-score).
- Cash flow +21.8/30.0
- ARV discount +15.0/15.0
- DSCR +7.0/10.0
- 1% rule +4.6/10.0
- Rent growth +3.7/5.0
- Livability +3.6/5.0
- Schools +2.6/10.0
- Condition / age +2.5/5.0
- Appreciation +0.0/10.0
$125,000
🖨 Deal sheet 📄 Offer letter ✓ Due diligence
Listing remarks MLS
Don't let this one get away. This 3bdrm 2bath home located in Southeast Decatur offers multiple opportunities from investment to first time home owner.
Key facts
- 6,969 sq ft lot
- Built 1958
- Listed 69 days
Neighborhood map
What this means for you Summary
Snapshot
- This is a 3-bed/1.0-bath single-family listed at $125k.
Deal economics
- At list price, monthly cash flow is $195 ($2k/yr) — positive.
- The deal already cash-flows at list — no discount required.
- To meet the 1% rule (rent ≥ 1% of price), the offer needs to be $120k (4.2% below list).
- Recommended offer: $118k (6.0% below list) — sets the bar for market timing.
- Cap rate 8.2% vs local median 4.0% in Decatur — top-decile yield for the area; either an underpriced asset or a hidden risk that comps aren't pricing in. Stress-test before assuming the spread holds.
Location & tenants
- Location reads 72/100 on livability (#28 in AL) — a middle-class / working-renter tenant base. Strengths: cost of living A+, housing A+, health & safety A+; Watch: schools C-, employment D+, crime F.
- Decatur City (urban): math 22% / reading 40% proficiency, ranked #66 of 129 in AL (top 51%) — families likely to look elsewhere, expect single-tenant / working-renter base with shorter leases.
- Market conditions: Rents rising fast (+4.7%/yr); 223 active listings in the ZIP; 23 comparable units currently listed for rent nearby; rentals lingering (median 44d on market — plan ~5-8 weeks vacancy on turnover, expect pricing pressure); 78% of comp listings sitting > 30 days — soft ceiling on asking rent; 231 units permitted in Morgan County in 2024 (0 in 5+ unit buildings).
Forward outlook
- Local home prices are declining (-3.0%/yr); year-one equity from $864 of loan paydown is wiped out by about $4k of value loss. Plan a longer hold.
- Morgan County population projected at -11% by 2050 — secular population decline; favor cash flow + early exit over multi-decade hold.
Negotiation context
- It's been on market 69 days — a 6% lower offer ($118k) is reasonable based on typical stale-listing flexibility.
Risks & watch-outs
- Watch-outs: built in 1958 — expect roof / HVAC / electrical / plumbing capex.
- Climate carrying-cost: extreme-heat days projected 7→18/yr by 2055 (HVAC capex compounding) — expect insurance premiums to compound above CPI over the hold.
Questions for the listing agent
- It's been on market 69 days. Have you received any prior offers? Is the seller open to a 6% concession, seller financing, or rate buy-down credit?
- Built in 1958 — when were the roof, HVAC, electrical panel, plumbing, and water heater last replaced?
- Why hasn't it sold? Are there any deal-killer items the seller is aware of (foundation, flood, title, zoning, code violations)?
- Is there a deadline driving the sale (1031 exchange, divorce, estate, relocation)? That informs how much negotiation room exists.
- Crime grade is F in this area — have there been break-ins, vandalism, or insurance claims at this property in the last 3 years? What carrier currently insures it and at what premium?
- What's the average days-on-market for RENTAL listings here right now (not sales)? A rising rental-DOM trend means longer vacancies and softer asking-rent achievability than the comps imply.
- What's the recent tenant-quality profile in this submarket — average credit score on applications, eviction rate, late-payment / NSF rate, and stable-employment percentage? A property-management company in the area should have these aggregated.
- How much new for-sale + rental construction is in the pipeline within 1–3 miles? Heavy new supply typically softens prices + rents 12–24 months out; constrained supply supports both.
Investment metrics
- 1% rule
- 0.96% ✗
- Cap rate
- 8.16%
- Cash-on-cash
- 6.68%
- DSCR
- 1.30
- GRM
- 8.7
CMA / ARV
- ARV (median comp)
- $165,155
- List price
- $125,000
- Delta
- -24.31%
- Verdict
- UNDERPRICED
- Comps
- 20 within 1.0 mi
Show comp detail 12 sales within ~0.75 mi
| Address | Dist | Beds/Ba | Sqft | Sold | Price | $/sf | Match |
|---|---|---|---|---|---|---|---|
| 1209 11th Ave SE | 0.00mi | 3/1.0 | 1,068 (0%) | 1mo | $118,500 | $111 | 99 |
| 1120 7th Ave SE | 0.26mi | 3/1.0 | 1,040 (-3%) | 0mo | $120,000 | $115 | 83 |
| 1024 9th Ave SE | 0.21mi | 2/1.0 (-1) | 1,008 (-6%) | 7mo | $164,000 | $163 | 70 |
| 1804 Enolam Blvd SE | 0.58mi | 3/1.0 | 1,032 (-3%) | 2mo | $164,900 | $160 | 66 |
| 1605 SE 7th St | 0.45mi | 2/1.0 (-1) | 1,113 (+4%) | 5mo | $130,000 | $117 | 62 |
| 1607 10th Avenue Ct SE | 0.52mi | 3/1.5 | 1,095 (+2%) | 10mo | $175,000 | $160 | 61 |
| 1002 7th Ave SE | 0.38mi | 3/2.0 | 1,172 (+10%) | 2mo | $153,000 | $131 | 61 |
| 1628 8th St SE | 0.51mi | 2/1.0 (-1) | 1,012 (-5%) | 8mo | $155,000 | $153 | 56 |
| 1907 Harrison St | 0.75mi | 3/1.0 | 1,075 (+1%) | 10mo | $154,900 | $144 | 56 |
| 911 9th Ave SE | 0.39mi | 2/1.0 (-1) | 964 (-10%) | 7mo | $115,000 | $119 | 55 |
| 1207 North St SE | 0.55mi | 2/2.0 (-1) | 1,172 (+10%) | 6mo | $136,000 | $116 | 44 |
| 1611 Tower St SE | 0.70mi | 2/1.0 (-1) | 980 (-8%) | 10mo | $135,000 | $138 | 40 |
Match score weights: distance 35% · size 25% · config 20% · recency 20%. Top-matched comps best support the ARV.
Projected returns pro-forma
-3.0% appreciation · 4.67% rent growth · sell at horizon
- IRR
- -4.4%
- Equity multiple
- 0.83×
- Total profit
- $-5,855
- Equity at exit
- $18,638
- IRR
- 6.9%
- Equity multiple
- 1.55×
- Total profit
- $19,353
- Equity at exit
- $10,808
Cash invested: $35,000 (down + closing). Projections, not guarantees.
Landlord ↔ Tenant lean methodology
- Overall (STATE)
- 90 Strongly Landlord-Friendly
- State Alabama
- 90 Strongly Landlord-Friendly · R+15
- County
- — inherits STATE
- City
- — inherits STATE
ZIP-level market 35601
- Home prices YoY
- -26.5%
- Rents YoY
- 4.7%
- Active inventory
- 223
- Price-to-rent
- 8.7×
Monthly cashflow live
- Estimated rent
- $1,197 high interval (Pro) →
- Mortgage (P&I)
- −$656
- Tax from tax record
- −$43 /mo · $521/yr
- Insurance
- −$52
- HOA
- −$0
- Vacancy / Maint / Mgmt
- −$251
- Net cashflow
- $195
Break-even live
UW: 25.0% down · 7.5% · 30yr · 1.5% tax · 5.0% vac · 8.0% maint · 8.0% mgmt
Financing live
Cash to close
- Down payment
- $31,250
- Closing costs
- $3,750
- Reserves months
- —
- Total cash needed
- —
Loan-product check · same deal, 3 products live
Conventional
25% down · 7.5% · 30yr
- Down + closing
- —
- Monthly P&I
- —
- Monthly cashflow
- —
- DSCR
- —
- Eligible?
- —
Personal DTI + credit; lowest rate.
DSCR
20% down · 8.5% · 30yr
- Down + closing
- —
- Monthly P&I
- —
- Monthly cashflow
- —
- DSCR
- —
- Eligible?
- —
No personal income docs; deal must DSCR.
Hard money
10% down · 12.0% · 12mo
- Down + closing
- —
- Monthly P&I
- —
- Monthly cashflow
- —
- DSCR
- —
- Eligible?
- —
Short-term bridge; refi at stabilization.
Rent comps 23 comps
| Address | Beds | Baths | Sqft | Rent | $/sqft | DOM | Units | Dist |
|---|---|---|---|---|---|---|---|---|
| 1628 8th St SE Decatur, AL | 2.0 | 1.0 | 1012 | $1,200 | $1.19 | 43d | 1 | 0.48mi |
| 1801 7th St SE Decatur, AL | 4.0 | 2.0 | 1475 | $1,550 | $1.05 | 43d | 1 | 0.55mi |
| 1221 North St SE Decatur, AL | 2.0 | 1.0 | 937 | $775 | $0.83 | 43d | 2 | 0.59mi |
| 1821 7th St SE Decatur, AL | 3.0 | 1.0 | 908 | $1,100 | $1.21 | 23d | 1 | 0.61mi |
| 1205 Broadus Ave SE Decatur, AL | 3.0 | 2.0 | 1306 | $1,195 | $0.92 | 43d | 1 | 0.68mi |
| 603 Prospect Dr SE Decatur, AL | 3.0 | 1.0 | 1362 | $1,795 | $1.32 | 43d | 1 | 0.68mi |
| 1018 Grant St SE Unit 1026-4 Decatur, AL | 2.0 | 1.0 | 890 | $800 | $0.90 | 43d | 1 | 0.88mi |
| 1018 Grant St SE Unit 1018-4 Decatur, AL | 2.0 | 1.0 | 890 | $775 | $0.87 | 43d | 1 | 0.89mi |
| 818 Grant St SE Decatur, AL | 2.0 | 1.0 | 910 | $1,300 | $1.43 | 43d | 1 | 0.91mi |
| 1208 2nd Ave SW Unit 1208 28 Decatur, AL | 2.0 | 1.0 | 850 | $825 | $0.97 | 43d | 1 | 0.92mi |
| 1220 2nd Ave SW Unit 2nd 7 Decatur, AL | 2.0 | 1.0 | 850 | $825 | $0.97 | 43d | 1 | 0.92mi |
| 227 8th St SW Unit 19 Decatur, AL | 2.0 | 1.0 | 850 | $825 | $0.97 | 43d | 1 | 0.92mi |
| 1314 Pennylane SE Decatur, AL | 3.0 | 1.5 | 1100 | $1,198 | $1.09 | 23d | 1 | 0.92mi |
| 2136 Eastbrook SE Decatur, AL | 2.0 | 2.0 | 1400 | $1,495 | $1.07 | 43d | 1 | 0.99mi |
| 102 Elm Ct NE Decatur, AL | 3.0 | 1.0 | 1216 | $1,450 | $1.19 | 23d | 1 | 1.05mi |
| 315 Hillside Rd SW Decatur, AL | 3.0 | 1.5 | 1344 | $1,400 | $1.04 | 43d | 1 | 1.08mi |
| 1602 Brookridge Dr SW Decatur, AL | 1.0–2.0 | 1.0–2.0 | 797 | $1,174 | $1.47 | 43d | 13 | 1.11mi |
| 324 Cardinal Dr SW Decatur, AL | 2.0 | 1.0 | 681 | $952 | $1.40 | 43d | 14 | 1.31mi |
| 2115 Central Pkwy SW Decatur, AL | 1.0–3.0 | 1.0 | 821 | $950 | $1.16 | 43d | 1 | 1.31mi |
| 2234 Harrison St SE Decatur, AL | 2.0 | 1.0 | 850 | $925 | $1.09 | 14d | 1 | 1.32mi |
| 201 Bluebird Ln SW Decatur, AL | 2.0 | 1.0 | 950 | $898 | $0.94 | 43d | 11 | 1.36mi |
| 516 Ferry St NE Decatur, AL | 2.0 | 1.0 | 900 | $1,150 | $1.28 | 23d | 1 | 1.41mi |
| 609 7th Ave SW Decatur, AL | 4.0 | 2.0 | 1380 | $1,425 | $1.03 | 43d | 1 | 1.50mi |
Listing history 2 events
-
2026-05-14status Pending 151-char remark
Show marketing remark (151 chars)
Don't let this one get away. This 3bdrm 2bath home located in Southeast Decatur offers multiple opportunities from investment to first time home owner.
-
2026-03-06$125,000 Active 151-char remark
Show marketing remark (151 chars)
Don't let this one get away. This 3bdrm 2bath home located in Southeast Decatur offers multiple opportunities from investment to first time home owner.
ⓘ Source: listings_history table (triggers on properties + properties_extension) + one-shot
backfill from property_details.listing_events for pre-trigger history.
Tax reassessment forecast AL · Resets to sale price
- Current annual tax
- $521 · $43/mo
- Projected year-2 tax
- $521 · $43/mo
- Expected delta
- $0/yr ($0/mo · 0.0%)
ⓘ Screening estimate from a state-policy table — verify with the county assessor before closing.
Climate risk First Street
- Flood 1/10 Low FEMA zone X (unshaded) · 0% chance over 30 yrs
- Wildfire 1/10 Low
- Heat 5/10 Major 7 d/yr ≥106°F today · 18 d/yr by 30 yrs out
- Wind 4/10 Moderate 19% chance of damaging wind over 30 yrs
- Air quality 2/10 Low 1 unhealthy d/yr today · 1 by 30 yrs out
Nearby sold comps map
Loading sold comps map…
Walkable amenities ~0.75 mi
Loading nearby amenities…
Taxation est. · year 1
- Rental income
- $14,367
- − Mortgage interest
- −$7,002
- − Property taxes
- −$521
- − Insurance
- −$625
- − Repairs & maintenance
- −$1,149
- − Management
- −$1,149
- − Depreciation
- −$3,636
- Taxable income
- $284
- Est. tax owed @ 24.0%
- −$68
- After-tax cash flow
- $2,270/yr
For passive investors: Depreciation is non-cash, so a rental often shows a tax loss while cash-flowing — sheltering income. Rental losses are passive: they offset passive income freely, and up to $25,000/yr can offset ordinary (W-2) income if you actively participate and your MAGI is under $100k (phasing out to $0 by $150k); unused losses carry forward. On sale, claimed depreciation is recaptured at up to 25%, and gains may owe capital-gains tax (a 1031 exchange can defer both). Figures are a year-1 estimate at your 24.0% rate — not tax advice; consult a CPA.
Schools (NCES district)
- District
- Decatur City
- NCES district ID
- 0101170
- Math proficiency
- 22% ▼ -27.00%
- Reading proficiency
- 40% ▼ -1.00%
- Median HH income
- $42,170
- Composite
- 26.21/100
- National rank
- #7261
- State rank
- #66 of 129 in AL
Livability — Decatur
- Score
- 72/100
- State rank
- #28
- US rank
- #5989
Category grades
Schools grade is shown separately in the Schools card above.
Census & demographics
- Census place
- Decatur, AL
- County
- Morgan County · 67,628 people
- City population
- 67,628
- Metro
- Decatur, AL
- Population (ZIP)
- 35,449
- Household income
- $51,429
- Rent vs Own
- Severe rent burden
- 1386.0
Population outlook (Morgan County) Hauer SSP2
- Today (2025)
- 118,775 people
- By 2030
- 116,979 · -1.5%
- By 2040
- 111,800 · -5.9%
- By 2050
- 105,181 · -11.4%
- By 2075
- 87,736 · -26.1%
- By 2100
- 67,624 · -43.1%
Race, ethnicity, and origin ACS 2023
- Neighborhood character
- Diverse neighborhood (Simpson 0.66)
- Race & ethnicity
- White 47% Hispanic / Latino 24% Black 24% Two or more races 10% Native American 2%
- Hispanic origin (detail)
- Mexican 15% Puerto Rican 2%
- Common ancestry
- Slovak 1% Italian 1% Lithuanian 1%
- Foreign-born
- 10% · Canada
- Languages at home
- 81% English-only · Spanish 18%
Political lean MEDSL · Morgan
- 2024 margin
- Solid R (+52.6) · D 23.2% · R 75.8%
- 2008→2024 swing
- -8.8pp toward R · 2008: -43.8pp · 2024: -52.6pp
- All cycles
- 2024: R+52.6 2020: R+49.2 2016: R+52.4 2012: R+44.5 2008: R+43.8
Not yet ingested
- Civics
- —
Market trends
- HPI YoY
- ▼ -89.26%
- Current HPI
- 247.8437
- Rent YoY
- ▲ 4.67%
- Metro
- Decatur, AL
- State GDP YoY
- ▲ 2.94%
- F500 in state
- 4
Industry mix (Fortune 500 HQ in AL)
| Industry | F500 HQs | Revenue |
|---|---|---|
| Financial Services | 1 | $8B |
|
||
| Healthcare | 1 | $5B |
|
||
Price history
2 events — show timeline
- 2026-05-14 Pending — VMLS
- 2026-03-06 Listed $125,000 VMLS
Property tax history
+1.3%/yrLatest (2025): $521 · +0.0% YoY. Source: county tax records.
Cash-flow waterfall
monthlySold comps — $/sqft
last 12 mo · ≤1 miLoading sold comps…