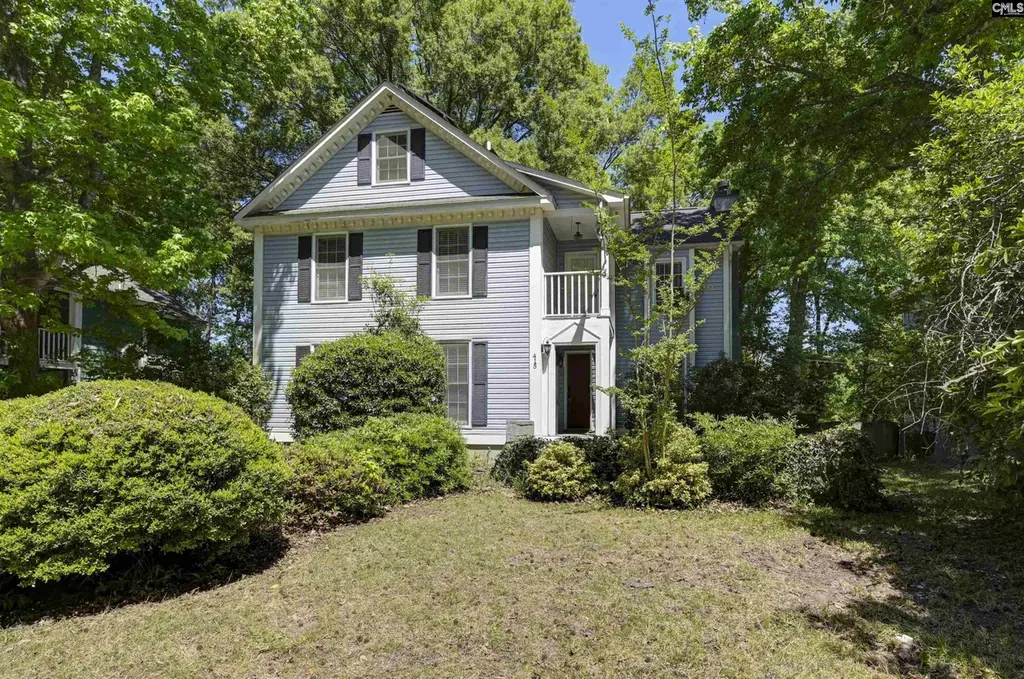
415 Cressfell Rd · Irmo, SC
Flood risk 1/10 · Minimal
- FEMA flood zone
- X (unshaded)
- Chance of flooding over 30 yrs
- 0.0%
- Est. flood insurance / yr
- $507 – $1,088
Fire risk 3/10 · Minor
- Est. fire insurance / yr
- $783 – $1,453
Heat risk 6/10 · Moderate
- Hot days now (above 108°F)
- 7 days/yr
- Hot days in 30 yrs
- 16 days/yr
Wind risk 6/10 · Moderate
- Chance of severe wind over 30 yrs
- 60.0%
Air-quality risk 3/10 · Minor
- Unhealthy air days now
- 3 days/yr
- Unhealthy air days in 30 yrs
- 3 days/yr
Risk factors via First Street. Map © Google.
Why this score? — see what drove the C grade
The composite is a weighted blend of 9 inputs, each scored 0–100. Each bar is that input's sub-score; the figure is the points it added to the 100-point composite (weight × sub-score).
- Cash flow +22.5/30.0
- ARV discount +7.5/15.0
- DSCR +7.2/10.0
- 1% rule +4.9/10.0
- Schools +4.5/10.0
- Livability +3.7/5.0
- Rent growth +2.5/5.0
- Condition / age +2.5/5.0
- Appreciation +0.0/10.0
$209,900
🖨 Deal sheet 📄 Offer letter ✓ Due diligence
Listing remarks
Priced to sell! 415 Cressfell Rd is a 3 bed/2Bath Charleston style home located in the Hidden Oaks subdivision of Irmo. Sitting on a very private lot this home offers a large screened porch and outdoor deck area for entertainment . Your home features a large livingroom with fireplace , formal dining room and huge kitchen with eat in area that leads to your outdoor space. Upstairs offers a huge master suite with a porch off of the master. Perfect location just minutes from all shopping and located in the Lex/ Rich 5 school district. Home had new siding in 2021 and new HVAC in 2023 will need some TLC but overall home is in good condition . Disclaimer: CMLS has not reviewed and, therefore, d
Key facts
- Master suite
- Private lot
- Outdoor deck area
Tags
Property features AI
Exterior
- Parking: Two parking spaces
- Utilities: Public sewer; Public water
- Home design: Two-story home
- Construction: Vinyl exterior; Crawlspace foundation
- Exterior features: Covered front porch; Covered back porch; Patio; Gutters (full); Partial fencing; Public water
Interior
- Kitchen: Eat-in kitchen with pantry and quartz countertops; Microwave above the stove; Refrigerator included
- Bedrooms: Master bedroom on second level with private bath, separate shower, walk-in closet, ceiling fan and access to a balcony/deck (carpeted); Second bedroom on second level with shared bath and walk-in closet (carpeted); Third bedroom on second level with his-and-hers closets and shared bath (carpeted)
- Flooring: Hardwood floors in living and formal dining areas; Carpet in bedrooms
- Bathrooms: Two full bathrooms; One partial bathroom; One half bathroom
- Heating & cooling: Central cooling; Electric heating with heat pumps on both first and second levels
- Interior features: Fireplace in living room; Built-ins; Molding and hardwood floors in living and formal dining areas; Smooth surface range; Electric water heater; One fireplace
- Laundry & utility: Washer and dryer included; Laundry located on main level in a closet (electric)
Neighborhood map
What this means for you Summary
Snapshot
- This is a 3-bed/2.5-bath single-family listed at $210k.
Deal economics
- At list price, monthly cash flow is $353 ($4k/yr) — positive.
- The deal already cash-flows at list — no discount required.
- To meet the 1% rule (rent ≥ 1% of price), the offer needs to be $208k (0.9% below list).
- Recommended offer: $207k (1.5% below list) — sets the bar for market timing.
Location & tenants
- Location reads 73/100 on livability (#38 in SC) — a middle-class / working-renter tenant base. Strengths: cost of living A+, housing A+, employment B; Watch: amenities F, commute F.
- Lexington 05 (suburban): math 47% / reading 55% proficiency, ranked #5 of 80 in SC (top 6%) — acceptable for families but not a draw, mixed tenant base, ~2y average lease.
- Zoned schools: H. E. Corley Elementary (math 42% / reading 52%, grade D-, #209 of 597 statewide, top 36%, 558 students, 74% FRL); Dutch Fork High (math 54% / reading 86%, grade B+, #58 of 196 statewide, top 30%, 1,726 students, 52% FRL) — zoned schools average 63% FRL vs 27% district-wide (36 pts higher); higher-poverty schools than district average — tighter screening recommended.
- Market conditions: 434 active listings in the ZIP; 9 comparable units currently listed for rent nearby; rentals at typical pace (median 14d on market — plan ~3-4 weeks tenant-placement turnaround); high-income renter base; 1,712 units permitted in Lexington County in 2024 (0 in 5+ unit buildings).
Forward outlook
- Local home prices are declining (-3.0%/yr); year-one equity from $1k of loan paydown is wiped out by about $6k of value loss. Plan a longer hold.
- Lexington County population projected at +26% by 2050 — long-run rental-demand tailwind backs the buy-and-hold thesis.
Negotiation context
- It's been on market 19 days — a 2% lower offer ($207k) is reasonable based on typical stale-listing flexibility.
- 2 sale attempts with the ask held roughly flat each time — persistent listings suggest the price (not the market) is what's stuck; bring a comps-based counter.
- Current owner paid $132k; list at $210k implies a 59% gain — meaningful room to come down on a strong offer.
Risks & watch-outs
- Climate carrying-cost: major wind risk, 60% chance of damaging wind over 30y; extreme-heat days projected 7→16/yr by 2055 (HVAC capex compounding) — expect insurance premiums to compound above CPI over the hold.
Questions for the listing agent
- Is there a deadline driving the sale (1031 exchange, divorce, estate, relocation)? That informs how much negotiation room exists.
- Schools are B-rated — typically a magnet for longer-tenancy family renters. What's the average tenant stay here, and is there a school-zone premium baked into asking?
- What's the average days-on-market for RENTAL listings here right now (not sales)? A rising rental-DOM trend means longer vacancies and softer asking-rent achievability than the comps imply.
- What's the recent tenant-quality profile in this submarket — average credit score on applications, eviction rate, late-payment / NSF rate, and stable-employment percentage? A property-management company in the area should have these aggregated.
- How much new for-sale + rental construction is in the pipeline within 1–3 miles? Heavy new supply typically softens prices + rents 12–24 months out; constrained supply supports both.
Investment metrics
- 1% rule
- 0.99% ✗
- Cap rate
- 8.31%
- Cash-on-cash
- 7.21%
- DSCR
- 1.32
- GRM
- 8.4
CMA / ARV
No comps found within radius.
Projected returns pro-forma
-3.0% appreciation · 3.0% rent growth · sell at horizon
- IRR
- -5.3%
- Equity multiple
- 0.80×
- Total profit
- $-11,599
- Equity at exit
- $31,297
- IRR
- 4.3%
- Equity multiple
- 1.32×
- Total profit
- $18,577
- Equity at exit
- $18,148
Cash invested: $58,772 (down + closing). Projections, not guarantees.
Landlord ↔ Tenant lean methodology
- Overall (STATE)
- 90 Strongly Landlord-Friendly
- State South Carolina
- 90 Strongly Landlord-Friendly · R+6
- County
- — inherits STATE
- City
- — inherits STATE
ZIP-level market 29036
- Active inventory
- 434
- Price-to-rent
- 8.4×
Monthly cashflow live
- Estimated rent
- $2,081 high interval (Pro) →
- Mortgage (P&I)
- −$1,101
- Tax from tax record
- −$103 /mo · $1,235/yr
- Insurance
- −$87
- HOA
- −$0
- Vacancy / Maint / Mgmt
- −$437
- Net cashflow
- $353
Break-even live
UW: 25.0% down · 7.5% · 30yr · 1.5% tax · 5.0% vac · 8.0% maint · 8.0% mgmt
Financing live
Cash to close
- Down payment
- $52,475
- Closing costs
- $6,297
- Reserves months
- —
- Total cash needed
- —
Loan-product check · same deal, 3 products live
Conventional
25% down · 7.5% · 30yr
- Down + closing
- —
- Monthly P&I
- —
- Monthly cashflow
- —
- DSCR
- —
- Eligible?
- —
Personal DTI + credit; lowest rate.
DSCR
20% down · 8.5% · 30yr
- Down + closing
- —
- Monthly P&I
- —
- Monthly cashflow
- —
- DSCR
- —
- Eligible?
- —
No personal income docs; deal must DSCR.
Hard money
10% down · 12.0% · 12mo
- Down + closing
- —
- Monthly P&I
- —
- Monthly cashflow
- —
- DSCR
- —
- Eligible?
- —
Short-term bridge; refi at stabilization.
Rent comps 9 comps
| Address | Beds | Baths | Sqft | Rent | $/sqft | DOM | Units | Dist |
|---|---|---|---|---|---|---|---|---|
| 13 Dyers Hall Ct Irmo, SC | 3.0 | 2.0 | 1127 | $1,699 | $1.51 | 23d | 1 | 0.32mi |
| 136 Weston Watch Rd Irmo, SC | 3.0 | 2.0 | 1200 | $1,695 | $1.41 | 3d | 1 | 0.57mi |
| 108 Cranewater Dr Columbia, SC | 3.0 | 2.5 | 1600 | $1,795 | $1.12 | 23d | 1 | 0.65mi |
| 228 Chadford Rd Irmo, SC | 3.0 | 2.0 | 1318 | $1,861 | $1.41 | 14d | 1 | 0.70mi |
| 530 Chadford Rd Irmo, SC | 3.0 | 2.0 | 1196 | $1,695 | $1.42 | 14d | 1 | 0.72mi |
| 22 Dean Crest Ct Irmo, SC | 3.0 | 2.0 | 1301 | $1,695 | $1.30 | 3d | 1 | 0.79mi |
| 312 Bow Church Rd Irmo, SC | 3.0 | 2.0 | 1505 | $1,861 | $1.24 | 11d | 1 | 0.90mi |
| 508 Cornerstone Cir Irmo, SC | 3.0 | 2.0 | 1867 | $2,200 | $1.18 | 23d | 1 | 1.10mi |
| 1 Crescent Ln Columbia, SC | 2.0 | 1.5 | 1300 | $1,380 | $1.06 | 2d | 1 | 1.37mi |
Listing history 8 events
-
2026-05-13status Pending
-
2026-05-07status Active
-
2026-04-27historical Active - Contingent
-
2026-04-24$209,900 Active
-
2014-11-05soldstatus $132,000
-
2012-09-25soldstatus $125,000
-
1996-08-01soldstatus $99,000
-
1990-08-01soldstatus $85,500
ⓘ Source: listings_history table (triggers on properties + properties_extension) + one-shot
backfill from property_details.listing_events for pre-trigger history.
Tax reassessment forecast SC · Resets to sale price
- Current annual tax
- $1,235 · $103/mo
- Projected year-2 tax
- $1,235 · $103/mo
- Expected delta
- $0/yr ($0/mo · 0.0%)
ⓘ Screening estimate from a state-policy table — verify with the county assessor before closing.
Climate risk First Street
- Flood 1/10 Low FEMA zone X (unshaded) · 0% chance over 30 yrs
- Wildfire 3/10 Moderate
- Heat 6/10 Major 7 d/yr ≥108°F today · 16 d/yr by 30 yrs out
- Wind 6/10 Major 60% chance of damaging wind over 30 yrs
- Air quality 3/10 Moderate 3 unhealthy d/yr today · 3 by 30 yrs out
Nearby sold comps map
Loading sold comps map…
Walkable amenities ~0.75 mi
Loading nearby amenities…
Taxation est. · year 1
- Rental income
- $24,974
- − Mortgage interest
- −$11,758
- − Property taxes
- −$1,235
- − Insurance
- −$1,050
- − Repairs & maintenance
- −$1,998
- − Management
- −$1,998
- − Depreciation
- −$6,106
- Taxable income
- $829
- Est. tax owed @ 24.0%
- −$199
- After-tax cash flow
- $4,037/yr
For passive investors: Depreciation is non-cash, so a rental often shows a tax loss while cash-flowing — sheltering income. Rental losses are passive: they offset passive income freely, and up to $25,000/yr can offset ordinary (W-2) income if you actively participate and your MAGI is under $100k (phasing out to $0 by $150k); unused losses carry forward. On sale, claimed depreciation is recaptured at up to 25%, and gains may owe capital-gains tax (a 1031 exchange can defer both). Figures are a year-1 estimate at your 24.0% rate — not tax advice; consult a CPA.
Schools (NCES district)
- District
- Lexington 05
- NCES district ID
- 4502820
- Math proficiency
- 47% ▼ -7.00%
- Reading proficiency
- 55% ▼ -4.00%
- Median HH income
- $67,732
- Composite
- 45.28/100
- National rank
- #2656
- State rank
- #5 of 80 in SC
Livability — Irmo
- Score
- 73/100
- State rank
- #38
- US rank
- #5024
Category grades
Schools grade is shown separately in the Schools card above.
Census & demographics
- Census place
- Irmo, SC
- County
- Lexington County · 232,571 people
- City population
- 38,201
- Metro
- Columbia, SC
- Population (ZIP)
- 26,620
- Household income
- $113,986
- Rent vs Own
- Severe rent burden
- 212.0
Population outlook (Lexington County) Hauer SSP2
- Today (2025)
- 322,999 people
- By 2030
- 342,356 · +6.0%
- By 2040
- 377,715 · +16.9%
- By 2050
- 406,984 · +26.0%
- By 2075
- 465,447 · +44.1%
- By 2100
- 485,674 · +50.4%
Race, ethnicity, and origin ACS 2023
- Neighborhood character
- Predominantly White (86%)
- Race & ethnicity
- White 86% Asian 5% Two or more races 4% Black 3% Hispanic / Latino 3%
- Common ancestry
- Lithuanian 4% Slovak 4% Italian 2%
- Foreign-born
- 6% · Canada, South Korea, China
- Languages at home
- 95% English-only · Other Indo-European 2% Spanish 1% Korean 1%
Political lean MEDSL · Lexington
- 2024 margin
- Solid R (+33.5) · D 32.5% · R 66.0% · Other 1.4%
- 2008→2024 swing
- +4.6pp toward D · 2008: -38.0pp · 2024: -33.5pp
- All cycles
- 2024: R+33.5 2020: R+30.1 2016: R+36.7 2012: R+37.8 2008: R+38.0
Not yet ingested
- Civics
- —
Market trends
- HPI YoY
- ▼ -134.76%
- Current HPI
- 248.3807
- Rent YoY
- —
- Metro
- Columbia, SC
- State GDP YoY
- ▲ 4.51%
- F500 in state
- 2
Industry mix (Fortune 500 HQ in SC)
| Industry | F500 HQs | Revenue |
|---|---|---|
| Packaging | 1 | $7B |
|
||
Price history
+145.5% since first listed8 events — show timeline
- 2026-05-13 Pending — Consolidated MLS
- 2026-05-07 Relisted — Consolidated MLS
- 2026-04-27 Contingent — Consolidated MLS
- 2026-04-24 Listed $209,900 Consolidated MLS
- 2014-11-05 Sold (Public Records) $132,000 Public Records
- 2012-09-25 Sold (Public Records) $125,000 Public Records
- 1996-08-01 Sold (Public Records) $99,000 Public Records
- 1990-08-01 Sold (Public Records) $85,500 Public Records
Property tax history
-5.0%/yrLatest (2024): $1,235 · +4.2% YoY. Source: county tax records.
Cash-flow waterfall
monthlySold comps — $/sqft
last 12 mo · ≤1 miLoading sold comps…