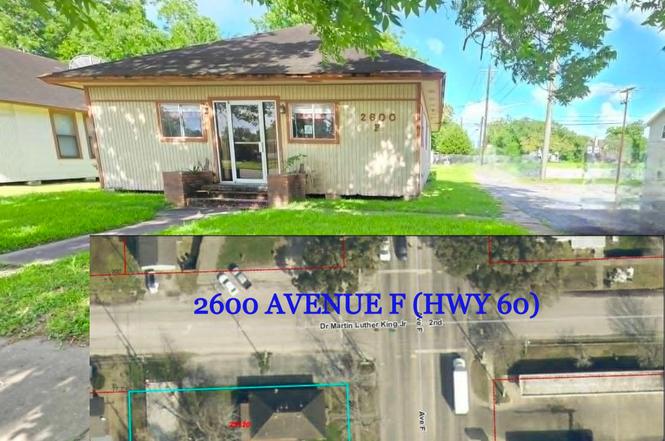
2600 Avenue F · Bay City, TX
Flood risk No data
- FEMA flood zone
- —
- Chance of flooding over 30 yrs
- —
- Est. flood insurance / yr
- —
Fire risk No data
- Est. fire insurance / yr
- —
Heat risk No data
- Hot days now (above threshold)
- —
- Hot days in 30 yrs
- —
Wind risk No data
- Chance of severe wind over 30 yrs
- —
Air-quality risk No data
- Unhealthy air days now
- —
- Unhealthy air days in 30 yrs
- —
Risk factors via First Street. Map © Google.
Why this score? — see what drove the B+ grade
The composite is a weighted blend of 9 inputs, each scored 0–100. Each bar is that input's sub-score; the figure is the points it added to the 100-point composite (weight × sub-score).
- Cash flow +30.0/30.0
- ARV discount +15.0/15.0
- DSCR +10.0/10.0
- 1% rule +9.6/10.0
- Livability +3.6/5.0
- Rent growth +3.3/5.0
- Schools +2.6/10.0
- Condition / age +1.0/5.0
- Appreciation +0.0/10.0
$110,000
🖨 Deal sheet 📄 Offer letter ✓ Due diligence
Listing remarks
Located in the heart of Bay City on Hwy 60 South, this highly visible corner property offers excellent exposure, strong traffic counts, and ample side parking. A great opportunity for a new business venture, owner-occupant setup, or income-producing property. The front office building features three spacious office rooms, a kitchenette, and a full bathroom, making it ideal for professional services, retail, or a small business headquarters. Connected to the rear of the property is a large apartment with two bedrooms and two bathrooms, offering flexibility for on-site living, employee housing, or rental income. Previously home to a thriving insurance and real estate office, this versatile pr
Key facts
- Kitchenette
- Full bathroom
- Ample side parking
Tags
Property features AI
Finance
- Other: Seller disclosure available
Exterior
- Parking: Additional parking available; Alley access; No designated parking
- Utilities: Public water; Public sewer
- Home design: Residential property; Full ownership; Built in 1956
- Construction: Cement siding and wood siding; Composition roof; Block and slab foundation
- Exterior features: Corner lot; Road surfaces include asphalt and concrete
Interior
- Bedrooms: Primary bedroom on the first floor (16x19); Bedroom on the first floor (12x14); Bedroom on the first floor (18x14); Bedroom on the first floor (15x13)
- Bathrooms: Three full bathrooms; One half bathroom
- Heating & cooling: Central heating (electric); Central air conditioning (electric)
- Interior features: Total of 4 rooms
Neighborhood map
What this means for you Summary
Snapshot
- This is a 4-bed/3.5-bath single-family listed at $110k. Condition is rated poor.
Deal economics
- At list price, monthly cash flow is $507 ($6k/yr) — positive.
- The deal already cash-flows at list — no discount required.
- Meets the 1% rule at list price ($2k rent vs $110k).
- Cap rate 11.8% vs local median 3.4% in Bay City — top-decile yield for the area; either an underpriced asset or a hidden risk that comps aren't pricing in. Stress-test before assuming the spread holds.
Location & tenants
- Location reads 71/100 on livability (#311 in TX) — a middle-class / working-renter tenant base. Strengths: cost of living A+, housing A+, health & safety A+; Watch: crime F, commute F, employment F.
- Bay City ISD (town): math 31% / reading 31% proficiency, ranked #604 of 826 in TX (top 73%) — families likely to look elsewhere, expect single-tenant / working-renter base with shorter leases; 66% free/reduced lunch — lower-income household profile, screen leases tightly.
- Zoned schools: Roberts El (513 students, 82% FRL); Bay City H S (math 35% / reading 39%, grade F, #897 of 1,632 statewide, top 57%, 1,031 students, 78% FRL).
- Market conditions: Rents rising (+3.3%/yr); 620 active listings in the ZIP; 3 comparable units currently listed for rent nearby; rentals lingering (median 44d on market — plan ~5-8 weeks vacancy on turnover, expect pricing pressure); 100% of comp listings sitting > 30 days — soft ceiling on asking rent; 153 units permitted in Matagorda County in 2024 (0 in 5+ unit buildings).
- This rent runs 33% of the median local income ($59k/yr) — at the standard rent-burdened threshold; future hikes will face affordability resistance.
Forward outlook
- Local home prices are declining (-3.0%/yr); year-one equity from $761 of loan paydown is wiped out by about $3k of value loss. Plan a longer hold.
- At projected returns (-3.0% appreciation + 3.3% rent growth), your $31k cash investment doubles in ~7 years — after that, you're playing with house money.
Negotiation context
- Only 4 days on market — expect competitive offers; lowballing is unlikely to land.
Risks & watch-outs
- Watch-outs: built in 1956 — expect roof / HVAC / electrical / plumbing capex.
Questions for the listing agent
- Have any recent inspections been done? Can we get a copy of the seller's disclosures and any deferred-maintenance estimates?
- Built in 1956 — when were the roof, HVAC, electrical panel, plumbing, and water heater last replaced?
- Is there a deadline driving the sale (1031 exchange, divorce, estate, relocation)? That informs how much negotiation room exists.
- Schools are F-rated, which usually means shorter tenancies and higher turnover. Who's the typical renter profile here, and what's been the actual vacancy rate?
- Crime grade is F in this area — have there been break-ins, vandalism, or insurance claims at this property in the last 3 years? What carrier currently insures it and at what premium?
- What's the average days-on-market for RENTAL listings here right now (not sales)? A rising rental-DOM trend means longer vacancies and softer asking-rent achievability than the comps imply.
- What's the recent tenant-quality profile in this submarket — average credit score on applications, eviction rate, late-payment / NSF rate, and stable-employment percentage? A property-management company in the area should have these aggregated.
- How much new for-sale + rental construction is in the pipeline within 1–3 miles? Heavy new supply typically softens prices + rents 12–24 months out; constrained supply supports both.
Investment metrics
- 1% rule
- 1.46% ✓
- Cap rate
- 11.82%
- Cash-on-cash
- 19.75%
- DSCR
- 1.88
- GRM
- 5.7
CMA / ARV
- ARV (on-the-fly)
- $191,600
- Comps found
- 5
Show comp detail 5 sales within ~0.75 mi
| Address | Dist | Beds/Ba | Sqft | Sold | Price | $/sf | Match |
|---|---|---|---|---|---|---|---|
| 2500 Avenue E | 0.10mi | 3/2.0 (-1) | 1,758 (-8%) | 2mo | $240,000 | $137 | 68 |
| 2909 Avenue G | 0.25mi | 3/2.0 (-1) | 2,154 (+12%) | 10mo | $215,000 | $100 | 48 |
| 2907 Avenue K | 0.46mi | 3/2.0 (-1) | 1,748 (-9%) | 12mo | $69,900 | $40 | 43 |
| 2410 Carrington St | 0.66mi | 3/2.0 (-1) | 1,845 (-4%) | 18mo | $266,500 | $144 | 37 |
| 815 Rugeley St | 0.59mi | 4/2.0 | 1,649 (-14%) | 14mo | $79,900 | $48 | 32 |
Match score weights: distance 35% · size 25% · config 20% · recency 20%. Top-matched comps best support the ARV.
Projected returns pro-forma
-3.0% appreciation · 3.28% rent growth · sell at horizon
- IRR
- 12.2%
- Equity multiple
- 1.48×
- Total profit
- $14,935
- Equity at exit
- $16,401
- IRR
- 21.3%
- Equity multiple
- 2.84×
- Total profit
- $56,542
- Equity at exit
- $9,511
Cash invested: $30,800 (down + closing). Projections, not guarantees.
Landlord ↔ Tenant lean methodology
- Overall (STATE)
- 87 Strongly Landlord-Friendly
- State Texas
- 87 Strongly Landlord-Friendly · R+5
- County
- — inherits STATE
- City
- — inherits STATE
ZIP-level market 77414
- Home prices YoY
- -17.7%
- Rents YoY
- 3.3%
- Active inventory
- 620
- Price-to-rent
- 5.7×
Monthly cashflow live
- Estimated rent
- $1,604 medium interval (Pro) →
- Mortgage (P&I)
- −$577
- Tax est. 1.5%
- −$138 /mo · $1,650/yr
- Insurance
- −$46
- HOA
- −$0
- Vacancy / Maint / Mgmt
- −$337
- Net cashflow
- $507
Break-even live
UW: 25.0% down · 7.5% · 30yr · 1.5% tax · 5.0% vac · 8.0% maint · 8.0% mgmt
Financing live
Cash to close
- Down payment
- $27,500
- Closing costs
- $3,300
- Reserves months
- —
- Total cash needed
- —
Loan-product check · same deal, 3 products live
Conventional
25% down · 7.5% · 30yr
- Down + closing
- —
- Monthly P&I
- —
- Monthly cashflow
- —
- DSCR
- —
- Eligible?
- —
Personal DTI + credit; lowest rate.
DSCR
20% down · 8.5% · 30yr
- Down + closing
- —
- Monthly P&I
- —
- Monthly cashflow
- —
- DSCR
- —
- Eligible?
- —
No personal income docs; deal must DSCR.
Hard money
10% down · 12.0% · 12mo
- Down + closing
- —
- Monthly P&I
- —
- Monthly cashflow
- —
- DSCR
- —
- Eligible?
- —
Short-term bridge; refi at stabilization.
Rent comps 3 comps
| Address | Beds | Baths | Sqft | Rent | $/sqft | DOM | Units | Dist |
|---|---|---|---|---|---|---|---|---|
| 2600 Avenue K Bay City, TX | 3.0 | 2.0 | 1277 | $1,665 | $1.30 | 44d | 1 | 0.37mi |
| 2824 4th St Bay City, TX | 4.0 | 2.0 | 1524 | $1,800 | $1.18 | 44d | 1 | 0.89mi |
| 3112 15th St Bay City, TX | 3.0 | 2.0 | 1983 | $1,800 | $0.91 | 44d | 1 | 1.41mi |
Listing history 5 events
-
2026-06-19days on market $110,000 Active 4 DOM
-
2026-06-18days on market $110,000 Active 3 DOM
-
2026-06-17days on market $110,000 Active 2 DOM
-
2026-06-16remarks 699-char remark
-
2026-06-16$110,000 Active 1 DOM
ⓘ Source: listings_history table (triggers on properties + properties_extension) + one-shot
backfill from property_details.listing_events for pre-trigger history.
Nearby sold comps map
Loading sold comps map…
Walkable amenities ~0.75 mi
Loading nearby amenities…
Taxation est. · year 1
- Rental income
- $19,246
- − Mortgage interest
- −$6,162
- − Property taxes
- −$1,650
- − Insurance
- −$550
- − Repairs & maintenance
- −$1,540
- − Management
- −$1,540
- − Depreciation
- −$3,200
- Taxable income
- $4,605
- Est. tax owed @ 24.0%
- −$1,105
- After-tax cash flow
- $4,977/yr
For passive investors: Depreciation is non-cash, so a rental often shows a tax loss while cash-flowing — sheltering income. Rental losses are passive: they offset passive income freely, and up to $25,000/yr can offset ordinary (W-2) income if you actively participate and your MAGI is under $100k (phasing out to $0 by $150k); unused losses carry forward. On sale, claimed depreciation is recaptured at up to 25%, and gains may owe capital-gains tax (a 1031 exchange can defer both). Figures are a year-1 estimate at your 24.0% rate — not tax advice; consult a CPA.
Condition & rehab AI · 12 photos
This property requires extensive renovations to improve its condition and increase its value. Immediate repairs are needed to address major issues such as the roof and exterior siding. Upgrades to the kitchen, bathrooms, and HVAC system would significantly enhance the property's appeal and value.
Repairs flagged
- Major roof — visible damage
- Major exterior siding — damaged and peeling
- Major windows — old and possibly leaky
- Major HVAC system — outdated and inefficient
- Major kitchen cabinets — dated and worn
- Major bathroom fixtures — dated and worn
- Major flooring — carpeted floors in poor condition
Value-add opportunities
- Both new roof — fixes major issue and improves curb appeal
- Both exterior siding and paint — enhances curb appeal and value
- Both new windows — improves energy efficiency and curb appeal
- Both HVAC system — increases comfort and energy efficiency
- Both new kitchen cabinets and countertops — modernizes space and increases value
- Both new bathroom fixtures and tiles — modernizes space and increases value
- Both new flooring — modernizes space and increases value
Renovation cost estimate screening
| Repair item | Severity | Est. cost |
|---|---|---|
| roof · visible damage | Major | $15,000–50,000 |
| exterior siding · damaged and peeling | Major | $15,000–50,000 |
| windows · old and possibly leaky | Major | $15,000–50,000 |
| HVAC system · outdated and inefficient | Major | $15,000–50,000 |
| kitchen cabinets · dated and worn | Major | $15,000–50,000 |
| bathroom fixtures · dated and worn | Major | $15,000–50,000 |
| flooring · carpeted floors in poor condition | Major | $15,000–50,000 |
| Total estimated repair cost · 7 items | $105,000–350,000 |
Value-add ROI direction
- Both new roof — fixes major issue and improves curb appeal ↑
- Both exterior siding and paint — enhances curb appeal and value ↑
- Both new windows — improves energy efficiency and curb appeal ↑
- Both HVAC system — increases comfort and energy efficiency ↑
- Both new kitchen cabinets and countertops — modernizes space and increases value ↑
- Both new bathroom fixtures and tiles — modernizes space and increases value ↑
- Both new flooring — modernizes space and increases value ↑
ⓘ Cost ranges are severity-bucket heuristics (US national rule-of-thumb). Get contractor quotes + a written scope before underwriting a rehab budget.
Schools (NCES district)
- District
- Bay City ISD
- NCES district ID
- 4809630
- Math proficiency
- 31% ▼ -8.00%
- Reading proficiency
- 31% ▼ -3.00%
- Median HH income
- $43,285
- Composite
- 26.4/100
- National rank
- #7229
- State rank
- #604 of 826 in TX
Livability — Bay City
- Score
- 71/100
- State rank
- #311
- US rank
- #7004
Category grades
Schools grade is shown separately in the Schools card above.
Census & demographics
- Census place
- Bay City, TX
- County
- Matagorda County · 24,334 people
- City population
- 24,334
- Metro
- Bay City, TX
- Population (ZIP)
- 24,334
- Household income
- $59,128
- Rent vs Own
- Severe rent burden
- 1228.0
Population outlook (Matagorda County) Hauer SSP2
- Today (2025)
- 37,148 people
- By 2030
- 37,082 · -0.2%
- By 2040
- 36,987 · -0.4%
- By 2050
- 36,934 · -0.6%
- By 2075
- 37,178 · +0.1%
- By 2100
- 35,184 · -5.3%
Race, ethnicity, and origin ACS 2023
- Neighborhood character
- Diverse neighborhood (Simpson 0.65)
- Race & ethnicity
- Hispanic / Latino 43% White 39% Black 13% Two or more races 13% Asian 2%
- Hispanic origin (detail)
- Mexican 37% Puerto Rican 1%
- Common ancestry
- Lithuanian 1% Slovak 1% Serbian 1%
- Foreign-born
- 12% · Canada
- Languages at home
- 71% English-only · Spanish 26% Other Indo-European 2% German/W. Germanic 1%
Political lean MEDSL · Matagorda
- 2024 margin
- Solid R (+50.5) · D 24.3% · R 74.8%
- 2008→2024 swing
- -23.1pp toward R · 2008: -27.4pp · 2024: -50.5pp
- All cycles
- 2024: R+50.5 2020: R+44.5 2016: R+40.7 2012: R+33.5 2008: R+27.4
Not yet ingested
- Civics
- —
Market trends
- HPI YoY
- ▼ -36.31%
- Current HPI
- 168.9985
- Rent YoY
- ▲ 3.28%
- Metro
- Bay City, TX
- State GDP YoY
- ▲ 3.95%
- F500 in state
- 110
Industry mix (Fortune 500 HQ in TX)
| Industry | F500 HQs | Revenue |
|---|---|---|
| Energy | 16 | $1,198B |
|
||
| Technology | 5 | $198B |
|
||
| Engineering / Construction | 4 | $72B |
|
||
| Energy Services | 3 | $60B |
|
||
| Utilities | 3 | $41B |
|
||
| Healthcare | 2 | $330B |
|
||
Price history
1 event — show timeline
- 2026-06-15 Listed $110,000 HARMLS
Cash-flow waterfall
monthlySold comps — $/sqft
last 12 mo · ≤1 miLoading sold comps…