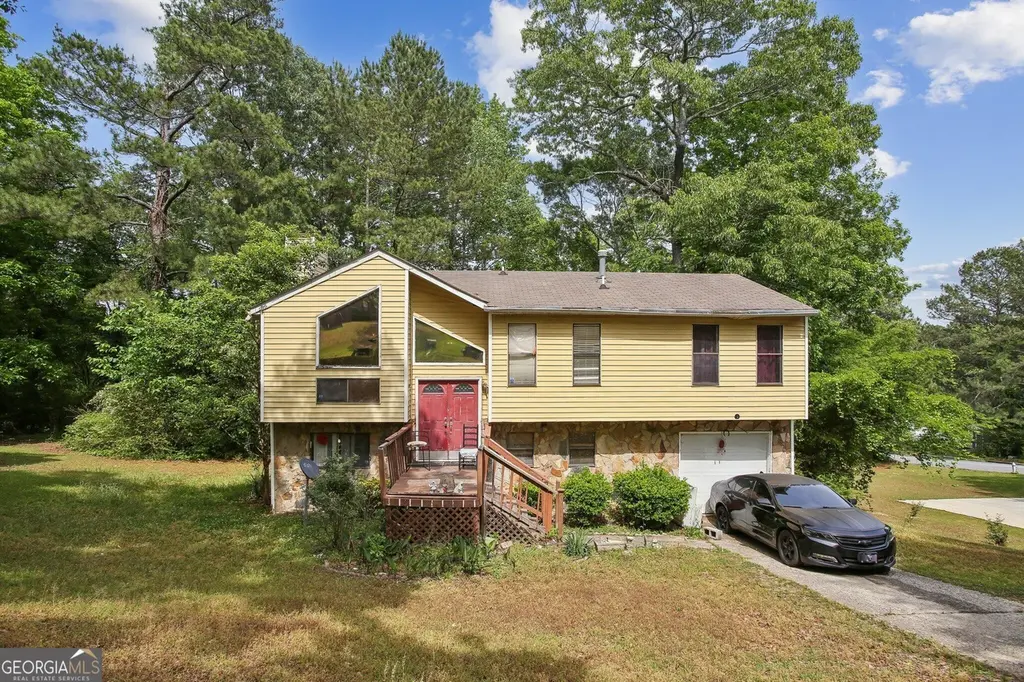
6930 Smoke Ridge Dr · South Fulton, GA
Flood risk 1/10 · Minimal
- FEMA flood zone
- X (unshaded)
- Chance of flooding over 30 yrs
- 0.0%
- Est. flood insurance / yr
- $507 – $1,088
Fire risk 3/10 · Minor
- Est. fire insurance / yr
- $963 – $1,789
Heat risk 6/10 · Moderate
- Hot days now (above 104°F)
- 7 days/yr
- Hot days in 30 yrs
- 18 days/yr
Wind risk 6/10 · Moderate
- Chance of severe wind over 30 yrs
- 27.0%
Air-quality risk 4/10 · Minor
- Unhealthy air days now
- 4 days/yr
- Unhealthy air days in 30 yrs
- 6 days/yr
Risk factors via First Street. Map © Google.
Why this score? — see what drove the C grade
The composite is a weighted blend of 9 inputs, each scored 0–100. Each bar is that input's sub-score; the figure is the points it added to the 100-point composite (weight × sub-score).
- Cash flow +22.7/30.0
- ARV discount +11.6/15.0
- DSCR +7.3/10.0
- 1% rule +4.8/10.0
- Schools +4.5/10.0
- Rent growth +3.1/5.0
- Livability +2.5/5.0
- Condition / age +2.5/5.0
- Appreciation +0.0/10.0
$199,999
🖨 Deal sheet 📄 Offer letter ✓ Due diligence
Listing remarks
Welcome to this charming home located in Fairburn, GA. Nestled on Smoke Ridge Dr, this property has a spacious layout with ample natural light throughout. The kitchen features modern appliances and plenty of counter space, appropriate for preparing meals. The living area is inviting and provides a great space for relaxation. The bedrooms are generously sized and accord comfort and privacy. Enjoy outdoor living in the backyard, appropriate for gatherings or quiet afternoons. A must-see property!
Key facts
- Ample natural light
- Modern appliances
- Backyard
Tags
Property features AI
Finance
- HOA & community: No HOA
Exterior
- Parking: Attached garage; Garage (1 parking space); Basement access to parking
- Utilities: Public water; Public sewer; Electricity available
- Home design: Single-family residence; One level; House; Resale property
- Construction: Built in 1985
- Exterior features: Vinyl siding; Wood roof
Interior
- Kitchen: Refrigerator included
- Bedrooms: 3 bedrooms
- Flooring: Other flooring
- Bathrooms: 3 full bathrooms
- Heating & cooling: Forced air heating; Central air conditioning
- Interior features: Finished full basement; Family room; Fireplace
- Laundry & utility: Laundry area (other)
Neighborhood map
What this means for you Summary
Snapshot
- This is a 3-bed/3.5-bath single-family listed at $200k.
Deal economics
- At list price, monthly cash flow is $342 ($4k/yr) — positive.
- The deal already cash-flows at list — no discount required.
- To meet the 1% rule (rent ≥ 1% of price), the offer needs to be $195k (2.4% below list).
- Recommended offer: $194k (3.0% below list) — sets the bar for market timing.
- Cap rate 8.3% vs local median 4.6% in South Fulton — top-decile yield for the area; either an underpriced asset or a hidden risk that comps aren't pricing in. Stress-test before assuming the spread holds.
Location & tenants
- Location reads: area grade C — affects rentability + tenant quality, not the cash-flow math above.
- Fulton County (suburban): math 49% / reading 53% proficiency, ranked #12 of 174 in GA (top 7%) — acceptable for families but not a draw, mixed tenant base, ~2y average lease.
- Zoned schools: Renaissance Es (math 22% / reading 32%, grade F, #689 of 1,228 statewide, top 58%, 601 students, 100% FRL); Renaissance Middle School (math 22% / reading 27%, grade F, #301 of 470 statewide, top 66%, 1,166 students, 71% FRL); Langston Hughes High School (math 8% / reading 17%, grade F, #336 of 424 statewide, top 80%, 1,964 students, 65% FRL) — zoned schools average 78% FRL vs 41% district-wide (37 pts higher); higher-poverty schools than district average — tighter screening recommended.
- Zoned-school proficiency averages 21% at this address vs 51% district-wide (-30 pts) — the specific schools serving this property underperform the Fulton County average; the district grade overstates school quality for this exact location.
- Market conditions: Rents rising (+2.5%/yr); 531 active listings in the ZIP; 23 comparable units currently listed for rent nearby; rentals at typical pace (median 21d on market — plan ~3-4 weeks tenant-placement turnaround); solid renter incomes; 11,565 units permitted in Fulton County in 2024 (8,159 in 5+ unit buildings).
Forward outlook
- Local home prices are declining (-3.0%/yr); year-one equity from $1k of loan paydown is wiped out by about $6k of value loss. Plan a longer hold.
- Fulton County population projected at +38% by 2050 — long-run rental-demand tailwind backs the buy-and-hold thesis.
Negotiation context
- It's been on market 34 days — a 3% lower offer ($194k) is reasonable based on typical stale-listing flexibility.
- Current owner paid $99k; list at $200k implies a 103% gain — meaningful room to come down on a strong offer.
Risks & watch-outs
- Climate carrying-cost: major wind risk, 27% chance of damaging wind over 30y; extreme-heat days projected 7→18/yr by 2055 (HVAC capex compounding) — expect insurance premiums to compound above CPI over the hold.
Questions for the listing agent
- It's been on market 34 days. Have you received any prior offers? Is the seller open to a 3% concession, seller financing, or rate buy-down credit?
- Is there a deadline driving the sale (1031 exchange, divorce, estate, relocation)? That informs how much negotiation room exists.
- What's the average days-on-market for RENTAL listings here right now (not sales)? A rising rental-DOM trend means longer vacancies and softer asking-rent achievability than the comps imply.
- What's the recent tenant-quality profile in this submarket — average credit score on applications, eviction rate, late-payment / NSF rate, and stable-employment percentage? A property-management company in the area should have these aggregated.
- How much new for-sale + rental construction is in the pipeline within 1–3 miles? Heavy new supply typically softens prices + rents 12–24 months out; constrained supply supports both.
Investment metrics
- 1% rule
- 0.98% ✗
- Cap rate
- 8.35%
- Cash-on-cash
- 7.34%
- DSCR
- 1.33
- GRM
- 8.5
CMA / ARV
- ARV (median comp)
- $220,166
- List price
- $199,999
- Delta
- -9.16%
- Verdict
- FAIR
- Comps
- 20 within 1.0 mi
Show comp detail 8 sales within ~0.75 mi
| Address | Dist | Beds/Ba | Sqft | Sold | Price | $/sf | Match |
|---|---|---|---|---|---|---|---|
| 6949 Merrywood Dr | 0.05mi | 3/3.0 | 1,150 (-0%) | 20mo | $205,000 | $178 | 78 |
| 6945 Brown Dr S | 0.12mi | 3/2.0 | 1,130 (-2%) | 13mo | $190,000 | $168 | 74 |
| 6470 Cedar Hurst Trl | 0.65mi | 4/2.5 (+1) | 1,150 (-0%) | 9mo | $125,000 | $109 | 53 |
| 6900 Kimberly Mill Rd | 0.42mi | 4/2.0 (+1) | 1,118 (-3%) | 17mo | $229,000 | $205 | 50 |
| 3088 Forestside Ct | 0.37mi | 3/1.5 | 1,054 (-9%) | 22mo | $165,000 | $157 | 42 |
| 7215 Buck Creek Dr | 0.37mi | 3/2.0 | 1,318 (+14%) | 20mo | $200,000 | $152 | 36 |
| 3205 Cadiz Cir | 0.50mi | 4/2.0 (+1) | 1,309 (+14%) | 16mo | $217,000 | $166 | 30 |
| 3510 Leisure Ln | 0.66mi | 3/2.0 | 1,297 (+12%) | 18mo | $205,000 | $158 | 27 |
Match score weights: distance 35% · size 25% · config 20% · recency 20%. Top-matched comps best support the ARV.
Projected returns pro-forma
-3.0% appreciation · 2.53% rent growth · sell at horizon
- IRR
- -5.6%
- Equity multiple
- 0.79×
- Total profit
- $-11,606
- Equity at exit
- $29,821
- IRR
- 3.5%
- Equity multiple
- 1.25×
- Total profit
- $13,899
- Equity at exit
- $17,292
Cash invested: $56,000 (down + closing). Projections, not guarantees.
Landlord ↔ Tenant lean methodology
- Overall (STATE)
- 90 Strongly Landlord-Friendly
- State Georgia
- 90 Strongly Landlord-Friendly · R+3
- County
- — inherits STATE
- City
- — inherits STATE
ZIP-level market 30213
- Home prices YoY
- -17.7%
- Rents YoY
- 2.5%
- Active inventory
- 531
- Price-to-rent
- 8.5×
Monthly cashflow live
- Estimated rent
- $1,952 high interval (Pro) →
- Mortgage (P&I)
- −$1,049
- Tax from tax record
- −$68 /mo · $816/yr
- Insurance
- −$83
- HOA
- −$0
- Vacancy / Maint / Mgmt
- −$410
- Net cashflow
- $342
Break-even live
UW: 25.0% down · 7.5% · 30yr · 1.5% tax · 5.0% vac · 8.0% maint · 8.0% mgmt
Financing live
Cash to close
- Down payment
- $50,000
- Closing costs
- $6,000
- Reserves months
- —
- Total cash needed
- —
Loan-product check · same deal, 3 products live
Conventional
25% down · 7.5% · 30yr
- Down + closing
- —
- Monthly P&I
- —
- Monthly cashflow
- —
- DSCR
- —
- Eligible?
- —
Personal DTI + credit; lowest rate.
DSCR
20% down · 8.5% · 30yr
- Down + closing
- —
- Monthly P&I
- —
- Monthly cashflow
- —
- DSCR
- —
- Eligible?
- —
No personal income docs; deal must DSCR.
Hard money
10% down · 12.0% · 12mo
- Down + closing
- —
- Monthly P&I
- —
- Monthly cashflow
- —
- DSCR
- —
- Eligible?
- —
Short-term bridge; refi at stabilization.
Rent comps 23 comps
| Address | Beds | Baths | Sqft | Rent | $/sqft | DOM | Units | Dist |
|---|---|---|---|---|---|---|---|---|
| 7045 Birling Dr Atlanta, GA | 4.0 | 3.0 | 1488 | $1,765 | $1.19 | 43d | 1 | 0.41mi |
| 6500 Connell Rd Atlanta, GA | 3.0 | 2.0 | 1483 | $1,650 | $1.11 | 24d | 1 | 0.45mi |
| 6445 Connell Rd Atlanta, GA | 3.0 | 2.0 | 1357 | $1,856 | $1.37 | 43d | 1 | 0.54mi |
| 3500 Keels Ln Atlanta, GA | 3.0 | 2.0 | 1272 | $1,755 | $1.38 | 1d | 1 | 0.55mi |
| 6440 Connell Rd Atlanta, GA | 3.0 | 2.0 | 1391 | $1,695 | $1.22 | 24d | 1 | 0.56mi |
| 3800 Leisure Ln Atlanta, GA | 3.0 | 2.0 | 1198 | $2,350 | $1.96 | 22d | 1 | 0.56mi |
| 7060 Kimberly Mill Rd Atlanta, GA | 3.0 | 1.0 | 1056 | $1,425 | $1.35 | 5d | 1 | 0.57mi |
| 325 Pointer Ct Atlanta, GA | 3.0 | 2.0 | 1474 | $1,620 | $1.10 | 5d | 1 | 0.68mi |
| 3206 Pine Tree Trl Unit 15C Atlanta, GA | 3.0 | 2.5 | 1466 | $1,950 | $1.33 | 4d | 1 | 0.86mi |
| 2560 Foxlair Trl Atlanta, GA | 4.0 | 2.0 | 1485 | $1,795 | $1.21 | 24d | 1 | 0.90mi |
| 2820 Greenbower Ct Atlanta, GA | 3.0 | 2.0 | 1338 | $1,730 | $1.29 | 3d | 1 | 0.99mi |
| 6770 Buffington Rd Union City, GA | 1.0–3.0 | 1.0–2.0 | 950 | $1,699 | $1.79 | 1d | 24 | 1.02mi |
| 6415 El Caudillo Ct Atlanta, GA | 3.0 | 3.0 | 1498 | $2,800 | $1.87 | 4d | 1 | 1.08mi |
| 6450 Peppermill Ln Atlanta, GA | 4.0 | 2.0 | 1188 | $1,531 | $1.29 | 24d | 1 | 1.15mi |
| 2550 Hallie Mill Rd Atlanta, GA | 3.0 | 2.0 | 1372 | $1,600 | $1.17 | 12d | 1 | 1.18mi |
| 110 Fruitwood Trce Unit A Riverdale, GA | 3.0 | 2.0 | 1100 | $1,800 | $1.64 | 20d | 1 | 1.19mi |
| 6345 Peppermill Ln Atlanta, GA | 3.0 | 2.5 | 1224 | $1,800 | $1.47 | 43d | 1 | 1.25mi |
| 7025 Brentwood Ct Riverdale, GA | 2.0 | 1.5 | 1124 | $1,425 | $1.27 | 43d | 1 | 1.27mi |
| 4050 Morgan Rd Union City, GA | 1.0–3.0 | 1.0–2.0 | 988 | $1,750 | $1.77 | 5d | 21 | 1.32mi |
| 145 W Village Ct Riverdale, GA | 3.0 | 2.5 | 1284 | $1,865 | $1.45 | 5d | 1 | 1.32mi |
| 3105 Garnet Way Atlanta, GA | 3.0 | 2.0 | 1470 | $1,660 | $1.13 | 12d | 1 | 1.37mi |
| 6237 Hickory Lane Cir Union City, GA | 4.0 | 2.5 | 1420 | $2,300 | $1.62 | 24d | 1 | 1.41mi |
| 2405 Wood Bend Ln Riverdale, GA | 3.0 | 2.5 | 1396 | $1,800 | $1.29 | 43d | 1 | 1.41mi |
Listing history 14 events
-
2026-06-18days on market $199,999 Active 34 DOM
-
2026-06-17days on market $199,999 Active 33 DOM
-
2026-06-16days on market $199,999 Active 32 DOM
-
2026-06-15days on market $199,999 Active 31 DOM
-
2026-06-13days on market $199,999 Active 29 DOM
-
2026-06-09days on market $199,999 Active 25 DOM
-
2026-06-08days on market $199,999 Active 24 DOM
-
2026-06-07days on market $199,999 Active 23 DOM
-
2026-06-04days on market $199,999 Active 20 DOM
-
2026-06-03days on market $199,999 Active 19 DOM
-
2026-06-01days on market $199,999 Active 17 DOM
-
2026-05-31days on market $199,999 Active 16 DOM
-
2026-05-15$199,999 New 499-char remark
-
2004-05-13soldstatus $98,600
ⓘ Source: listings_history table (triggers on properties + properties_extension) + one-shot
backfill from property_details.listing_events for pre-trigger history.
Tax reassessment forecast GA · Resets to sale price
- Current annual tax
- $816 · $68/mo
- Projected year-2 tax
- $1,840 · $153/mo
- Expected delta
- +$1,024/yr (+$85/mo · 125.6%)
ⓘ Screening estimate from a state-policy table — verify with the county assessor before closing.
Climate risk First Street
- Flood 1/10 Low FEMA zone X (unshaded) · 0% chance over 30 yrs
- Wildfire 3/10 Moderate
- Heat 6/10 Major 7 d/yr ≥104°F today · 18 d/yr by 30 yrs out
- Wind 6/10 Major 27% chance of damaging wind over 30 yrs
- Air quality 4/10 Moderate 4 unhealthy d/yr today · 6 by 30 yrs out
Nearby sold comps map
Loading sold comps map…
Walkable amenities ~0.75 mi
Loading nearby amenities…
Taxation est. · year 1
- Rental income
- $23,430
- − Mortgage interest
- −$11,203
- − Property taxes
- −$816
- − Insurance
- −$1,000
- − Repairs & maintenance
- −$1,874
- − Management
- −$1,874
- − Depreciation
- −$5,818
- Taxable income
- $844
- Est. tax owed @ 24.0%
- −$203
- After-tax cash flow
- $3,905/yr
For passive investors: Depreciation is non-cash, so a rental often shows a tax loss while cash-flowing — sheltering income. Rental losses are passive: they offset passive income freely, and up to $25,000/yr can offset ordinary (W-2) income if you actively participate and your MAGI is under $100k (phasing out to $0 by $150k); unused losses carry forward. On sale, claimed depreciation is recaptured at up to 25%, and gains may owe capital-gains tax (a 1031 exchange can defer both). Figures are a year-1 estimate at your 24.0% rate — not tax advice; consult a CPA.
Schools (NCES district)
- District
- Fulton County
- NCES district ID
- 1302280
- Math proficiency
- 49% ▼ -2.00%
- Reading proficiency
- 53% ▬ 0.00%
- Median HH income
- $68,035
- Composite
- 45.33/100
- National rank
- #2640
- State rank
- #12 of 174 in GA
Livability — South Fulton
No livability data for this city. (Only ~50 U.S. cities are tracked.)
Census & demographics
- Census place
- South Fulton, GA
- County
- Fulton County · 1,094,430 people
- City population
- 127,674
- Metro
- Atlanta-Sandy Springs-Alpharetta, GA
- Population (ZIP)
- 50,621
- Household income
- $94,125
- Rent vs Own
- Severe rent burden
- 1025.0
Population outlook (Fulton County) Hauer SSP2
- Today (2025)
- 1,203,707 people
- By 2030
- 1,299,706 · +8.0%
- By 2040
- 1,488,256 · +23.6%
- By 2050
- 1,664,580 · +38.3%
- By 2075
- 2,036,072 · +69.2%
- By 2100
- 2,222,402 · +84.6%
Race, ethnicity, and origin ACS 2023
- Neighborhood character
- Predominantly Black (86%)
- Race & ethnicity
- Black 86% White 8% Hispanic / Latino 4% Two or more races 3%
- Common ancestry
- Hispanic 1% Arab 1% Lithuanian 0%
- Foreign-born
- 7% · Canada
- Languages at home
- 91% English-only · Spanish 4% French/Haitian/Cajun 2% Arabic 1%
Political lean MEDSL · Fulton
- 2024 margin
- Solid D (+44.9) · D 71.9% · R 27.0% · Other 1.1%
- 2008→2024 swing
- +9.8pp toward D · 2008: 35.0pp · 2024: 44.9pp
- All cycles
- 2024: D+44.9 2020: D+46.4 2016: D+42.1 2012: D+29.6 2008: D+35.0
Not yet ingested
- Civics
- —
Market trends
- HPI YoY
- ▼ -50.66%
- Current HPI
- 235.9372
- Rent YoY
- ▲ 2.53%
- Metro
- Atlanta-Sandy Springs-Alpharetta, GA
- State GDP YoY
- ▲ 2.66%
- F500 in state
- 28
Industry mix (Fortune 500 HQ in GA)
| Industry | F500 HQs | Revenue |
|---|---|---|
| Paper / Packaging | 2 | $29B |
|
||
| Retail | 1 | $160B |
|
||
| Transportation / Logistics | 1 | $91B |
|
||
| Airlines | 1 | $62B |
|
||
| Consumer Goods | 1 | $47B |
|
||
| Utilities | 1 | $25B |
|
||
Price history
+102.8% since first listed2 events — show timeline
- 2026-05-15 Listed $199,999 GAMLS
- 2004-05-13 Sold (Public Records) $98,600 Public Records
Property tax history
-0.1%/yrLatest (2025): $816 · +3.9% YoY. Source: county tax records.
Cash-flow waterfall
monthlySold comps — $/sqft
last 12 mo · ≤1 miLoading sold comps…