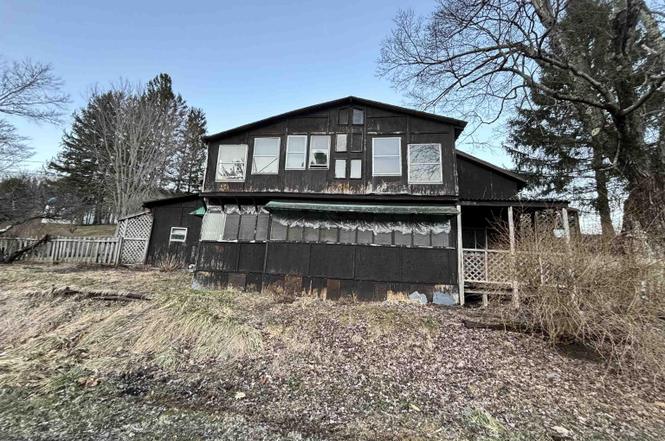
195 Railroad St · Hambleton, WV
Flood risk No data
- FEMA flood zone
- —
- Chance of flooding over 30 yrs
- —
- Est. flood insurance / yr
- —
Fire risk No data
- Est. fire insurance / yr
- —
Heat risk No data
- Hot days now (above threshold)
- —
- Hot days in 30 yrs
- —
Wind risk No data
- Chance of severe wind over 30 yrs
- —
Air-quality risk No data
- Unhealthy air days now
- —
- Unhealthy air days in 30 yrs
- —
Risk factors via First Street. Map © Google.
Why this score? — see what drove the B grade
The composite is a weighted blend of 9 inputs, each scored 0–100. Each bar is that input's sub-score; the figure is the points it added to the 100-point composite (weight × sub-score).
- Cash flow +30.0/30.0
- 1% rule +10.0/10.0
- DSCR +10.0/10.0
- ARV discount +7.5/15.0
- Appreciation +5.3/10.0
- Livability +3.0/5.0
- Rent growth +2.5/5.0
- Condition / age +2.5/5.0
- Schools +2.3/10.0
$49,000
🖨 Deal sheet 📄 Offer letter ✓ Due diligence
Listing remarks
Turn this into a second home for weekend getaways or use it as a rental or Air B & B. Take a short stroll to the Black Fork River. If you are a handyman you can update this house for income potential. Great area to just set and read a book and enjoy some of the beautiful scenery that Tucker Co offers.
Key facts
- 0.3 acre lot
- Community pool
- Built 1940
Property features AI
Finance
- HOA & community: Community pool
Exterior
- Parking: Off-street parking; On-street parking
- Security: Smoke detector(s)
- Utilities: Public water; Public sewer
- Home design: Single-family detached residence; 2 stories
- Construction: Wood siding; Shingle roof
- Exterior features: Corner, level lot; Community pool
Interior
- Kitchen: Range
- Bedrooms: Total of 6 rooms (bedroom count not specified)
- Flooring: Vinyl flooring; Wood flooring
- Bathrooms: 1 full bathroom
- Heating & cooling: Natural gas heating
- Interior features: Range; Smoke detectors installed
Neighborhood map
What this means for you Summary
Snapshot
- This is a 3-bed/1.0-bath single-family listed at $49k.
Deal economics
- At list price, monthly cash flow is $587 ($7k/yr) — positive.
- The deal already cash-flows at list — no discount required.
- Meets the 1% rule at list price ($1k rent vs $49k).
- Recommended offer: $43k (12.0% below list) — sets the bar for market timing.
Location & tenants
- Location reads 59/100 on livability (#225 in WV) — a working-class tenant base; expect higher turnover. Strengths: cost of living A+, housing A-; Watch: health & safety C-, amenities F, commute F.
- Tucker County Schools (rural): math 20% / reading 36% proficiency, ranked #40 of 55 in WV (top 73%) — low school quality limits family demand, transient renter base, plan for 1-2y turnover.
- Zoned schools: Tucker Valley Elementary Middle School (math 17% / reading 32%, grade F, #287 of 377 statewide, top 85%, 463 students, 0% FRL); Tucker County High School (math 17% / reading 52%, grade F, #42 of 110 statewide, top 47%, 293 students, 0% FRL) — zoned schools average 0% FRL vs 47% district-wide (47 pts lower); this property's tenant base skews higher-income than the district average.
- Market conditions: 3 active listings in the ZIP; 3 units permitted in Tucker County in 2024 (0 in 5+ unit buildings).
Forward outlook
- In year one you build about $594 of equity ($339 loan paydown + $255 appreciation (0.5% local appreciation)).
- Tucker County population projected at -18% by 2050 — secular population decline; favor cash flow + early exit over multi-decade hold.
- At projected returns (0.5% appreciation + 3.0% rent growth), your $14k cash investment doubles in ~2 years — after that, you're playing with house money.
Negotiation context
- It's been on market 227 days — a 12% lower offer ($43k) is reasonable based on typical stale-listing flexibility.
Risks & watch-outs
- Watch-outs: built in 1940 — expect roof / HVAC / electrical / plumbing capex.
Questions for the listing agent
- It's been on market 227 days. Have you received any prior offers? Is the seller open to a 12% concession, seller financing, or rate buy-down credit?
- Built in 1940 — when were the roof, HVAC, electrical panel, plumbing, and water heater last replaced?
- Why hasn't it sold? Are there any deal-killer items the seller is aware of (foundation, flood, title, zoning, code violations)?
- Is there a deadline driving the sale (1031 exchange, divorce, estate, relocation)? That informs how much negotiation room exists.
- Schools are F-rated, which usually means shorter tenancies and higher turnover. Who's the typical renter profile here, and what's been the actual vacancy rate?
- What's the average days-on-market for RENTAL listings here right now (not sales)? A rising rental-DOM trend means longer vacancies and softer asking-rent achievability than the comps imply.
- What's the recent tenant-quality profile in this submarket — average credit score on applications, eviction rate, late-payment / NSF rate, and stable-employment percentage? A property-management company in the area should have these aggregated.
- How much new for-sale + rental construction is in the pipeline within 1–3 miles? Heavy new supply typically softens prices + rents 12–24 months out; constrained supply supports both.
Investment metrics
- 1% rule
- 2.39% ✓
- Cap rate
- 20.66%
- Cash-on-cash
- 51.30%
- DSCR
- 3.28
- GRM
- 3.5
CMA / ARV
No comps found within radius.
Projected returns pro-forma
0.52% appreciation · 3.0% rent growth · sell at horizon
- IRR
- 53.4%
- Equity multiple
- 3.71×
- Total profit
- $37,152
- Equity at exit
- $15,514
- IRR
- 55.4%
- Equity multiple
- 7.44×
- Total profit
- $88,353
- Equity at exit
- $19,709
Cash invested: $13,720 (down + closing). Projections, not guarantees.
Landlord ↔ Tenant lean methodology
- Overall (STATE)
- 83 Strongly Landlord-Friendly
- State West Virginia
- 83 Strongly Landlord-Friendly · R+22
- County
- — inherits STATE
- City
- — inherits STATE
ZIP-level market 26269
- Home prices YoY
- 0.4%
- Active inventory
- 3
- Price-to-rent
- 3.5×
Monthly cashflow live
- Estimated rent
- $1,171 medium interval (Pro) →
- Mortgage (P&I)
- −$257
- Tax est. 1.5%
- −$61 /mo · $735/yr
- Insurance
- −$20
- HOA
- −$0
- Vacancy / Maint / Mgmt
- −$246
- Net cashflow
- $587
Break-even live
UW: 25.0% down · 7.5% · 30yr · 1.5% tax · 5.0% vac · 8.0% maint · 8.0% mgmt
Financing live
Cash to close
- Down payment
- $12,250
- Closing costs
- $1,470
- Reserves months
- —
- Total cash needed
- —
Loan-product check · same deal, 3 products live
Conventional
25% down · 7.5% · 30yr
- Down + closing
- —
- Monthly P&I
- —
- Monthly cashflow
- —
- DSCR
- —
- Eligible?
- —
Personal DTI + credit; lowest rate.
DSCR
20% down · 8.5% · 30yr
- Down + closing
- —
- Monthly P&I
- —
- Monthly cashflow
- —
- DSCR
- —
- Eligible?
- —
No personal income docs; deal must DSCR.
Hard money
10% down · 12.0% · 12mo
- Down + closing
- —
- Monthly P&I
- —
- Monthly cashflow
- —
- DSCR
- —
- Eligible?
- —
Short-term bridge; refi at stabilization.
Listing history 17 events
-
2026-06-18days on market $49,000 Active 227 DOM
-
2026-06-17days on market $49,000 Active 226 DOM
-
2026-06-16days on market $49,000 Active 225 DOM
-
2026-06-15days on market $49,000 Active 224 DOM
-
2026-06-15days on market $49,000 Active 223 DOM
-
2026-06-13days on market $49,000 Active 222 DOM
-
2026-06-12days on market $49,000 Active 221 DOM
-
2026-06-09days on market $49,000 Active 218 DOM
-
2026-06-08days on market $49,000 Active 217 DOM
-
2026-06-08days on market $49,000 Active 216 DOM
-
2026-06-07days on market $49,000 Active 215 DOM
-
2026-06-04days on market $49,000 Active 213 DOM
-
2026-06-03days on market $49,000 Active 212 DOM
-
2026-06-02days on market $49,000 Active 211 DOM
-
2026-06-01days on market $49,000 Active 210 DOM
-
2026-05-31days on market $49,000 Active 209 DOM
-
2025-11-03$49,000 Active
ⓘ Source: listings_history table (triggers on properties + properties_extension) + one-shot
backfill from property_details.listing_events for pre-trigger history.
Nearby sold comps map
Loading sold comps map…
Walkable amenities ~0.75 mi
Loading nearby amenities…
Taxation est. · year 1
- Rental income
- $14,054
- − Mortgage interest
- −$2,745
- − Property taxes
- −$735
- − Insurance
- −$245
- − Repairs & maintenance
- −$1,124
- − Management
- −$1,124
- − Depreciation
- −$1,425
- Taxable income
- $6,655
- Est. tax owed @ 24.0%
- −$1,597
- After-tax cash flow
- $5,442/yr
For passive investors: Depreciation is non-cash, so a rental often shows a tax loss while cash-flowing — sheltering income. Rental losses are passive: they offset passive income freely, and up to $25,000/yr can offset ordinary (W-2) income if you actively participate and your MAGI is under $100k (phasing out to $0 by $150k); unused losses carry forward. On sale, claimed depreciation is recaptured at up to 25%, and gains may owe capital-gains tax (a 1031 exchange can defer both). Figures are a year-1 estimate at your 24.0% rate — not tax advice; consult a CPA.
Schools (NCES district)
- District
- Tucker County Schools
- NCES district ID
- 5401410
- Math proficiency
- 20% ▼ -11.00%
- Reading proficiency
- 36% ▼ -6.00%
- Median HH income
- $38,697
- Composite
- 23.4/100
- National rank
- #7900
- State rank
- #40 of 55 in WV
Livability — Hambleton
- Score
- 59/100
- State rank
- #225
- US rank
- #19617
Category grades
Schools grade is shown separately in the Schools card above.
Census & demographics
- Census place
- Hambleton, WV
- Population (ZIP)
- 983
Population outlook (Tucker County) Hauer SSP2
- Today (2025)
- 6,675 people
- By 2030
- 6,467 · -3.1%
- By 2040
- 5,973 · -10.5%
- By 2050
- 5,460 · -18.2%
- By 2075
- 4,283 · -35.8%
- By 2100
- 3,171 · -52.5%
Race, ethnicity, and origin ACS 2023
- Neighborhood character
- Predominantly White (97%)
- Race & ethnicity
- White 97% Two or more races 3%
- Common ancestry
- Lithuanian 3% Slovak 1% Romanian 1%
- Foreign-born
- 1%
- Languages at home
- 99% English-only · Tagalog/Filipino 1%
Political lean MEDSL · Tucker
- 2024 margin
- Solid R (+48.9) · D 24.5% · R 73.4% · Other 2.1%
- 2008→2024 swing
- -25.1pp toward R · 2008: -23.8pp · 2024: -48.9pp
- All cycles
- 2024: R+48.9 2020: R+49.5 2016: R+52.2 2012: R+41.2 2008: R+23.8
Not yet ingested
- Civics
- —
Market trends
- HPI YoY
- ▲ 0.52%
- Current HPI
- 133.0846
- Rent YoY
- —
- Metro
- —
- State GDP YoY
- —
- F500 in state
- 0
Price history
1 event — show timeline
- 2025-11-03 Listed $49,000 NCWVREIN
Cash-flow waterfall
monthlySold comps — $/sqft
last 12 mo · ≤1 miLoading sold comps…