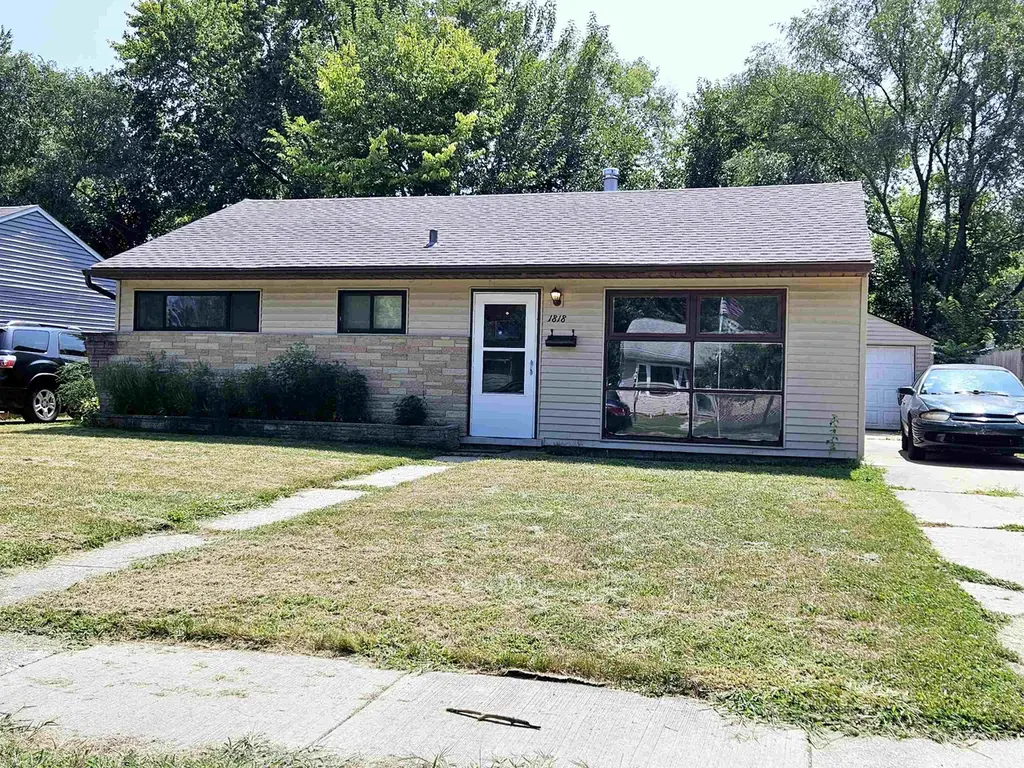
1818 Overdene Ave · Rockford, IL
Flood risk 1/10 · Minimal
- FEMA flood zone
- X (unshaded)
- Chance of flooding over 30 yrs
- 0.0%
- Est. flood insurance / yr
- $507 – $1,088
Fire risk 1/10 · Minimal
- Est. fire insurance / yr
- $804 – $1,492
Heat risk 2/10 · Minimal
- Hot days now (above 102°F)
- 7 days/yr
- Hot days in 30 yrs
- 15 days/yr
Wind risk 2/10 · Minimal
- Chance of severe wind over 30 yrs
- —
Air-quality risk 2/10 · Minimal
- Unhealthy air days now
- 1 days/yr
- Unhealthy air days in 30 yrs
- 2 days/yr
Risk factors via First Street. Map © Google.
Why this score? — see what drove the B+ grade
The composite is a weighted blend of 9 inputs, each scored 0–100. Each bar is that input's sub-score; the figure is the points it added to the 100-point composite (weight × sub-score).
- Cash flow +30.0/30.0
- ARV discount +15.0/15.0
- 1% rule +10.0/10.0
- DSCR +10.0/10.0
- Rent growth +4.5/5.0
- Livability +3.1/5.0
- Condition / age +2.5/5.0
- Schools +1.2/10.0
- Appreciation +0.0/10.0
$86,000
🖨 Deal sheet (PDF) 📄 Offer letter ✓ Due diligence
Listing remarks MLS
This 3-bedroom, 1-bath ranch offers the convenience of no stairs and a simple, functional layout. The bathroom features a walk-in shower for added accessibility. A detached 1-car garage provides parking and extra storage space. Newer roof and water heater. Main floor laundry. Home is being sold as-is. Cash or conventional financing only (no FHA/VA). A solid opportunity with great potential—come take a look!
Key facts
- Main floor laundry
- Walk-in shower
- Detached garage
Tags
Neighborhood map
What this means for you Summary
Snapshot
- This is a 3-bed/1.0-bath single-family listed at $86k.
Deal economics
- At list price, monthly cash flow is $432 ($5k/yr) — positive.
- The deal already cash-flows at list — no discount required.
- Meets the 1% rule at list price ($1k rent vs $86k).
- Cap rate 12.3% vs local median 6.1% in Rockford — top-decile yield for the area; either an underpriced asset or a hidden risk that comps aren't pricing in. Stress-test before assuming the spread holds.
Location & tenants
- Location reads 62/100 on livability (#876 in IL) — a middle-class / working-renter tenant base. Strengths: cost of living A+, housing A+, health & safety A+; Watch: crime F, amenities F, commute F.
- Rockford SD 205 (urban): math 12% / reading 16% proficiency, ranked #533 of 620 in IL (top 86%) — low school quality limits family demand, transient renter base, plan for 1-2y turnover; 73% free/reduced lunch — lower-income household profile, screen leases tightly.
- Zoned schools: West View Elem School (math 2% / reading 2%, grade F, #1,927 of 2,056 statewide, top 100%, 420 students, 0% FRL); West Middle School (math 3% / reading 11%, grade F, #627 of 665 statewide, top 95%, 849 students, 0% FRL); Guilford High School (math 15% / reading 28%, grade F, #345 of 693 statewide, top 50%, 2,071 students, 0% FRL) — zoned schools average 0% FRL vs 73% district-wide (73 pts lower); this property's tenant base skews higher-income than the district average.
- Market conditions: Rents rising fast (+8.1%/yr); 105 active listings in the ZIP; 17 comparable units currently listed for rent nearby; rentals at typical pace (median 22d on market — plan ~3-4 weeks tenant-placement turnaround); 285 units permitted in Winnebago County in 2024 (0 in 5+ unit buildings).
- This rent runs 33% of the median local income ($51k/yr) — at the standard rent-burdened threshold; future hikes will face affordability resistance.
Forward outlook
- Local home prices are declining (-3.0%/yr); year-one equity from $595 of loan paydown is wiped out by about $3k of value loss. Plan a longer hold.
- Winnebago County population projected at -20% by 2050 — secular population decline; favor cash flow + early exit over multi-decade hold.
- At projected returns (-3.0% appreciation + 8.0% rent growth), your $24k cash investment doubles in ~5 years — after that, you're playing with house money.
Negotiation context
- Only 5 days on market — expect competitive offers; lowballing is unlikely to land.
- 8 sale attempts since 19y ago with the ask held roughly flat each time — persistent listings suggest the price (not the market) is what's stuck; bring a comps-based counter.
Risks & watch-outs
- Watch-outs: built in 1955 — expect roof / HVAC / electrical / plumbing capex.
Questions for the listing agent
- Built in 1955 — when were the roof, HVAC, electrical panel, plumbing, and water heater last replaced?
- Is there a deadline driving the sale (1031 exchange, divorce, estate, relocation)? That informs how much negotiation room exists.
- Schools are F-rated, which usually means shorter tenancies and higher turnover. Who's the typical renter profile here, and what's been the actual vacancy rate?
- Crime grade is F in this area — have there been break-ins, vandalism, or insurance claims at this property in the last 3 years? What carrier currently insures it and at what premium?
- What's the average days-on-market for RENTAL listings here right now (not sales)? A rising rental-DOM trend means longer vacancies and softer asking-rent achievability than the comps imply.
- What's the recent tenant-quality profile in this submarket — average credit score on applications, eviction rate, late-payment / NSF rate, and stable-employment percentage? A property-management company in the area should have these aggregated.
- How much new for-sale + rental construction is in the pipeline within 1–3 miles? Heavy new supply typically softens prices + rents 12–24 months out; constrained supply supports both.
Investment metrics
- 1% rule
- 1.61% ✓
- Cap rate
- 12.32%
- Cash-on-cash
- 21.53%
- DSCR
- 1.96
- GRM
- 5.2
CMA / ARV
- ARV (on-the-fly)
- $123,950
- Comps found
- 12
Show comp detail 12 sales within ~0.75 mi
| Address | Dist | Beds/Ba | Sqft | Sold | Price | $/sf | Match |
|---|---|---|---|---|---|---|---|
| 2011 Overdene Ave | 0.11mi | 3/1.0 | 875 (-5%) | 1mo | $132,000 | $151 | 85 |
| 2011 Overdene Ave | 0.11mi | 3/1.0 | 875 (-5%) | 1mo | $132,000 | $151 | 85 |
| 1803 Ridgeland (sbr) Rd | 0.05mi | 3/1.0 | 1,004 (+8%) | 1mo | $49,000 | $49 | 82 |
| 1504 Barton Blvd | 0.29mi | 2/1.0 (-1) | 896 (-3%) | 5mo | $135,000 | $151 | 72 |
| 3311 Hanover Dr | 0.66mi | 3/1.0 | 936 (+1%) | 1mo | $135,000 | $144 | 66 |
| 1720 Paradise Blvd | 0.21mi | 2/1.0 (-1) | 858 (-7%) | 8mo | $115,000 | $134 | 66 |
| 1807 Bell Ave | 0.29mi | 3/1.0 | 820 (-11%) | 4mo | $139,900 | $171 | 64 |
| 1620 Pierce Ave | 0.30mi | 2/1.0 (-1) | 857 (-7%) | 6mo | $100,000 | $117 | 64 |
| 2216 N Court St | 0.49mi | 3/1.0 | 1,000 (+8%) | 3mo | $125,000 | $125 | 61 |
| 2404 Glenwood Ave | 0.39mi | 2/1.0 (-1) | 1,037 (+12%) | 5mo | $110,000 | $106 | 53 |
| 2804 Gladstone Ave | 0.74mi | 3/1.0 | 864 (-7%) | 7mo | $105,000 | $122 | 49 |
| 2724 Prial Ave | 0.58mi | 2/1.0 (-1) | 1,036 (+12%) | 4mo | $100,000 | $97 | 45 |
Match score weights: distance 35% · size 25% · config 20% · recency 20%. Top-matched comps best support the ARV.
Projected returns pro-forma
-3.0% appreciation · 8.0% rent growth · sell at horizon
- IRR
- 20.0%
- Equity multiple
- 1.87×
- Total profit
- $20,971
- Equity at exit
- $12,823
- IRR
- 31.7%
- Equity multiple
- 4.63×
- Total profit
- $87,312
- Equity at exit
- $7,436
Cash invested: $24,080 (down + closing). Projections, not guarantees.
Landlord ↔ Tenant lean methodology
- Overall (STATE)
- 43 Moderately Tenant-Leaning
- State Illinois
- 43 Moderately Tenant-Leaning · D+7
- County
- — inherits STATE
- City
- — inherits STATE
ZIP-level market 61103
- Home prices YoY
- -27.3%
- Rents YoY
- 8.1%
- Active inventory
- 105
- Price-to-rent
- 5.2×
Monthly cashflow live
- Estimated rent
- $1,387 high interval (Pro) →
- Mortgage (P&I)
- −$451
- Tax from tax record
- −$177 /mo · $2,125/yr
- Insurance
- −$36
- HOA
- −$0
- Vacancy / Maint / Mgmt
- −$291
- Net cashflow
- $432
Break-even live
Sensitivity live
| Price | -10% $481 | -5% $456 | +0% $432 | +5% $408 | +10% $383 |
|---|---|---|---|---|---|
| Rent | -10% $322 | -5% $377 | +0% $432 | +5% $487 | +10% $542 |
| Rate | -1.0pp $475 | -0.5pp $454 | base $432 | +0.5pp $410 | +1.0pp $387 |
UW: 25.0% down · 7.5% · 30yr · 1.5% tax · 5.0% vac · 8.0% maint · 8.0% mgmt
Financing live
Cash to close
- Down payment
- $21,500
- Closing costs
- $2,580
- Reserves months
- —
- Total cash needed
- —
Loan-product check · same deal, 3 products live
Conventional
25% down · 7.5% · 30yr
- Down + closing
- —
- Monthly P&I
- —
- Monthly cashflow
- —
- DSCR
- —
- Eligible?
- —
Personal DTI + credit; lowest rate.
DSCR
20% down · 8.5% · 30yr
- Down + closing
- —
- Monthly P&I
- —
- Monthly cashflow
- —
- DSCR
- —
- Eligible?
- —
No personal income docs; deal must DSCR.
Hard money
10% down · 12.0% · 12mo
- Down + closing
- —
- Monthly P&I
- —
- Monthly cashflow
- —
- DSCR
- —
- Eligible?
- —
Short-term bridge; refi at stabilization.
Rent comps 17 comps
| Address | Beds | Baths | Sqft | Rent | $/sqft | DOM | Units | Dist |
|---|---|---|---|---|---|---|---|---|
| 1823 Overdene Ave Rockford, IL | 3.0 | 1.0 | 875 | $1,500 | $1.71 | 22d | 1 | 0.03mi |
| 1823 Overdene Ave Rockford, IL | 3.0 | 1.0 | 875 | $1,400 | $1.60 | 14d | 1 | 0.03mi |
| 2019 Overdene Ave Rockford, IL | 3.0 | 1.0 | 875 | $1,400 | $1.60 | 14d | 1 | 0.13mi |
| 2019 Overdene Ave Rockford, IL | 3.0 | 1.0 | 875 | $1,500 | $1.71 | 44d | 1 | 0.13mi |
| 2208 Fremont St Rockford, IL | 3.0 | 1.0 | 938 | $1,400 | $1.49 | 14d | 1 | 0.62mi |
| 2215 Hecker Ave Unit 2215 Rockford, IL | 3.0 | 1.0 | 800 | $1,095 | $1.37 | 44d | 1 | 0.67mi |
| 3311 Sun Valley Ter Unit 3311-8 Rockford, IL | 2.0 | 1.0 | 850 | $995 | $1.17 | 44d | 1 | 0.77mi |
| 2535 Halsted Rd Rockford, IL | 3.0 | 1.0–1.5 | 850 | $1,399 | $1.65 | 14d | 1 | 0.78mi |
| 3303 Sun Valley Ter Unit 3303-11 Rockford, IL | 2.0 | 1.0 | 850 | $950 | $1.12 | 22d | 1 | 0.80mi |
| 1832 N Main St Rockford, IL | 2.0–3.0 | 1.0–2.0 | 872 | $1,199 | $1.37 | 14d | 1 | 0.86mi |
| 3936 Eagle Dr Rockford, IL | 1.0–2.0 | 1.0 | 712 | $999 | $1.40 | 14d | 1 | 0.96mi |
| 1904 Auburn St Unit 1904-4 Rockford, IL | 2.0 | 1.0 | 800 | $1,050 | $1.31 | 44d | 1 | 1.01mi |
| 1401 N Court St Rockford, IL | 2.0 | 1.0 | 850 | $950 | $1.12 | 44d | 1 | 1.09mi |
| 2330 Kilburn Ave Rockford, IL | 2.0–3.0 | 1.0–2.0 | 950 | $1,199 | $1.26 | 14d | 1 | 1.13mi |
| 1614 Pauline Ave Rockford, IL | 2.0 | 1.0 | 956 | $1,400 | $1.46 | 44d | 1 | 1.14mi |
| 3701 Trilling Ave Unit 3701-104 Rockford, IL | 3.0 | 1.0 | 1100 | $1,345 | $1.22 | 14d | 1 | 1.20mi |
| 1121 N Church St Rockford, IL | 2.0 | 1.0 | 900 | $1,200 | $1.33 | 22d | 1 | 1.39mi |
Listing history 21 events
-
2026-02-26status Pending 416-char remark
Show marketing remark (416 chars)
This 3-bedroom, 1-bath ranch offers the convenience of no stairs and a simple, functional layout. The bathroom features a walk-in shower for added accessibility. A detached 1-car garage provides parking and extra storage space. Newer roof and water heater. Main floor laundry. Home is being sold as-is. Cash or conventional financing only (no FHA/VA). A solid opportunity with great potential—come take a look!
-
2026-02-26status Pending
Show marketing remark (416 chars)
This 3-bedroom, 1-bath ranch offers the convenience of no stairs and a simple, functional layout. The bathroom features a walk-in shower for added accessibility. A detached 1-car garage provides parking and extra storage space. Newer roof and water heater. Main floor laundry. Home is being sold as-is. Cash or conventional financing only (no FHA/VA). A solid opportunity with great potential—come take a look!
-
2026-02-21$86,000 Active 416-char remark
Show marketing remark (416 chars)
This 3-bedroom, 1-bath ranch offers the convenience of no stairs and a simple, functional layout. The bathroom features a walk-in shower for added accessibility. A detached 1-car garage provides parking and extra storage space. Newer roof and water heater. Main floor laundry. Home is being sold as-is. Cash or conventional financing only (no FHA/VA). A solid opportunity with great potential—come take a look!
-
2026-02-20$86,000 Active
-
2024-11-25soldstatus $105,000
-
2024-11-21soldstatus $105,000 Closed 112-char remark
Show marketing remark (112 chars)
Adorable 3 bedroom home on the North West side of town. Detached 1.5 car garage. Currently rented until Sept 30.
-
2024-11-04status Pending 112-char remark
Show marketing remark (112 chars)
Adorable 3 bedroom home on the North West side of town. Detached 1.5 car garage. Currently rented until Sept 30.
-
2024-10-01status Active 112-char remark
Show marketing remark (112 chars)
Adorable 3 bedroom home on the North West side of town. Detached 1.5 car garage. Currently rented until Sept 30.
-
2024-09-20historical 112-char remark
Show marketing remark (112 chars)
Adorable 3 bedroom home on the North West side of town. Detached 1.5 car garage. Currently rented until Sept 30.
-
2024-08-26$110,000 Active 112-char remark
Show marketing remark (112 chars)
Adorable 3 bedroom home on the North West side of town. Detached 1.5 car garage. Currently rented until Sept 30.
-
2022-08-12soldstatus $63,334
-
2022-04-29$63,000
-
2009-02-25soldstatus $55,500 Closed Sale
-
2009-02-24historical
-
2009-02-13soldstatus $55,500
-
2009-01-05$59,000
-
2008-12-11historical
-
2008-06-10
-
2008-05-09historical
-
2007-11-10
-
2004-07-14soldstatus $59,500
ⓘ Source: listings_history table (triggers on properties + properties_extension) + one-shot
backfill from property_details.listing_events for pre-trigger history.
Tax reassessment forecast IL · Partial reset (capped growth)
- Current annual tax
- $2,125 · $177/mo
- Projected year-2 tax
- $2,125 · $177/mo
- Expected delta
- $0/yr ($0/mo · 0.0%)
ⓘ Screening estimate from a state-policy table — verify with the county assessor before closing.
Climate risk First Street
- Flood 1/10 Low FEMA zone X (unshaded) · 0% chance over 30 yrs
- Wildfire 1/10 Low
- Heat 2/10 Low 7 d/yr ≥102°F today · 15 d/yr by 30 yrs out
- Wind 2/10 Low
- Air quality 2/10 Low 1 unhealthy d/yr today · 2 by 30 yrs out
Nearby sold comps map
Loading sold comps map…
Walkable amenities ~0.75 mi
Loading nearby amenities…
Taxation est. · year 1
- Rental income
- $16,646
- − Mortgage interest
- −$4,817
- − Property taxes
- −$2,125
- − Insurance
- −$430
- − Repairs & maintenance
- −$1,332
- − Management
- −$1,332
- − Depreciation
- −$2,502
- Taxable income
- $4,109
- Est. tax owed @ 24.0%
- −$986
- After-tax cash flow
- $4,197/yr
For passive investors: Depreciation is non-cash, so a rental often shows a tax loss while cash-flowing — sheltering income. Rental losses are passive: they offset passive income freely, and up to $25,000/yr can offset ordinary (W-2) income if you actively participate and your MAGI is under $100k (phasing out to $0 by $150k); unused losses carry forward. On sale, claimed depreciation is recaptured at up to 25%, and gains may owe capital-gains tax (a 1031 exchange can defer both). Figures are a year-1 estimate at your 24.0% rate — not tax advice; consult a CPA.
Schools (NCES district)
- District
- Rockford SD 205
- NCES district ID
- 1734510
- Math proficiency
- 12% ▼ -2.00%
- Reading proficiency
- 16% ▼ -3.00%
- Median HH income
- $42,533
- Composite
- 12.21/100
- National rank
- #9649
- State rank
- #533 of 620 in IL
Livability — Rockford
- Score
- 62/100
- State rank
- #876
- US rank
- #17035
Category grades
Schools grade is shown separately in the Schools card above.
Census & demographics
- Census place
- Rockford, IL
- County
- Winnebago County · 147,297 people
- City population
- 147,297
- Metro
- Rockford, IL
- Population (ZIP)
- 22,869
- Household income
- $51,161
- Rent vs Own
- Severe rent burden
- 1402.0
Population outlook (Winnebago County) Hauer SSP2
- Today (2025)
- 271,080 people
- By 2030
- 260,684 · -3.8%
- By 2040
- 238,405 · -12.1%
- By 2050
- 216,129 · -20.3%
- By 2075
- 172,882 · -36.2%
- By 2100
- 135,336 · -50.1%
Race, ethnicity, and origin ACS 2023
- Neighborhood character
- Diverse neighborhood (Simpson 0.61)
- Race & ethnicity
- White 56% Black 25% Two or more races 13% Hispanic / Latino 12%
- Hispanic origin (detail)
- Mexican 10%
- Common ancestry
- Romanian 3% Portuguese 2% Italian 2%
- Foreign-born
- 7% · Canada
- Languages at home
- 88% English-only · Spanish 9% Russian/Polish/Slavic 1%
Political lean MEDSL · Winnebago
- 2024 margin
- Toss-up / Even · D 49.5% · R 49.0% · Other 1.5%
- 2008→2024 swing
- -12.2pp toward R · 2008: 12.8pp · 2024: 0.6pp
- All cycles
- 2024: D+0.6 2020: D+2.5 2016: R+1.2 2012: D+5.7 2008: D+12.8
Not yet ingested
- Civics
- —
Market trends
- HPI YoY
- ▼ -81.02%
- Current HPI
- 215.8559
- Rent YoY
- ▲ 8.11%
- Metro
- Rockford, IL
- State GDP YoY
- ▲ 1.59%
- F500 in state
- 60
Industry mix (Fortune 500 HQ in IL)
| Industry | F500 HQs | Revenue |
|---|---|---|
| Insurance | 4 | $201B |
|
||
| Consumer Goods | 4 | $87B |
|
||
| Industrial Machinery | 3 | $64B |
|
||
| Healthcare | 2 | $55B |
|
||
| Retail / Pharmacy | 1 | $148B |
|
||
| Agriculture / Food | 1 | $86B |
|
||
Price history
+44.5% since first listed21 events — show timeline
- 2026-02-26 Pending — NWIAR
- 2026-02-26 Pending — MRED as Distributed by MLS Grid
- 2026-02-21 Listed $86,000 NWIAR
- 2026-02-20 Listed $86,000 MRED as Distributed by MLS Grid
- 2024-11-25 Sold (Public Records) $105,000 Public Records
- 2024-11-21 Sold (MLS) $105,000 NWIAR
- 2024-11-04 Pending — NWIAR
- 2024-10-01 Relisted — NWIAR
- 2024-09-20 Delisted — NWIAR
- 2024-08-26 Listed $110,000 NWIAR
- 2022-08-12 Sold (MLS) $63,334 NWIAR
- 2022-04-29 Listed $63,000 NWIAR
- 2009-02-25 Sold (MLS) $55,500 MRED as Distributed by MLS Grid
- 2009-02-24 Listing Removed — MRED as Distributed by MLS Grid
- 2009-02-13 Sold (Public Records) $55,500 Public Records
- 2009-01-05 Listed $59,000 MRED as Distributed by MLS Grid
- 2008-12-11 Listing Removed — MRED as Distributed by MLS Grid
- 2008-06-10 Listed — MRED as Distributed by MLS Grid
- 2008-05-09 Listing Removed — MRED as Distributed by MLS Grid
- 2007-11-10 Listed — MRED as Distributed by MLS Grid
- 2004-07-14 Sold (Public Records) $59,500 Public Records
Property tax history
-0.2%/yrLatest (2024): $2,125 · +3.5% YoY. Source: county tax records.
Cash-flow waterfall
monthlySold comps — $/sqft
last 12 mo · ≤1 miLoading sold comps…