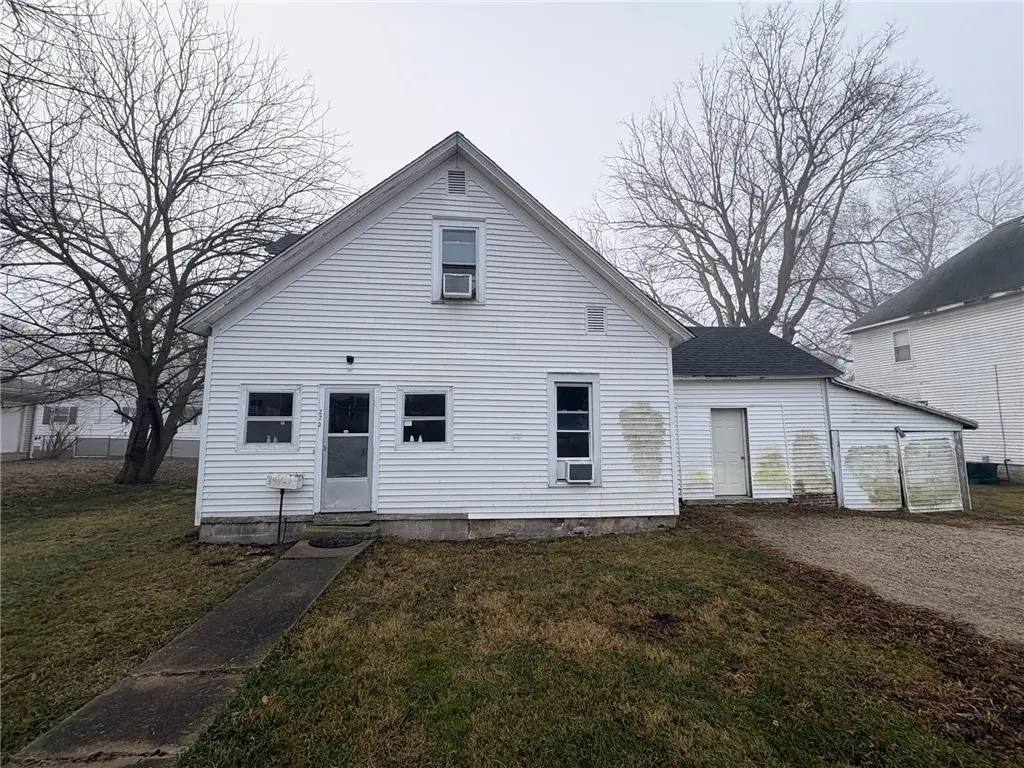
223 Montgomery St · Niantic, IL
Flood risk 1/10 · Minimal
- FEMA flood zone
- X (unshaded)
- Chance of flooding over 30 yrs
- 0.0%
- Est. flood insurance / yr
- $473 – $860
Fire risk 1/10 · Minimal
- Est. fire insurance / yr
- $804 – $1,492
Heat risk 3/10 · Minor
- Hot days now (above 105°F)
- 7 days/yr
- Hot days in 30 yrs
- 19 days/yr
Wind risk 2/10 · Minimal
- Chance of severe wind over 30 yrs
- 2.0%
Air-quality risk 2/10 · Minimal
- Unhealthy air days now
- 1 days/yr
- Unhealthy air days in 30 yrs
- 1 days/yr
Risk factors via First Street. Map © Google.
Why this score? — see what drove the B grade
The composite is a weighted blend of 9 inputs, each scored 0–100. Each bar is that input's sub-score; the figure is the points it added to the 100-point composite (weight × sub-score).
- Cash flow +30.0/30.0
- 1% rule +10.0/10.0
- DSCR +10.0/10.0
- ARV discount +7.5/15.0
- Appreciation +5.8/10.0
- Livability +3.0/5.0
- Rent growth +2.5/5.0
- Condition / age +2.5/5.0
- Schools +1.7/10.0
$48,500
🖨 Deal sheet (PDF) 📄 Offer letter ✓ Due diligence
Listing remarks MLS
Spacious home located in Niantic far west on Montgomery St. Whether you are just wanting the small town feeling or looking for a quality investment opportunity, this is for your. 3 bedrooms and 2 full bathrooms, plus a bonus room on the main floor and an enclosed porch area. Parking in both front and back. Siding, roof, subfloor and flooring new in 2024.
Key facts
- New siding
- New flooring
- Bonus room
Tags
Neighborhood map
What this means for you Summary
Snapshot
- This is a 3-bed/1.0-bath other listed at $48k.
Deal economics
- At list price, monthly cash flow is $306 ($4k/yr) — positive.
- The deal already cash-flows at list — no discount required.
- Meets the 1% rule at list price ($953 rent vs $48k).
- Recommended offer: $43k (12.0% below list) — sets the bar for market timing.
Location & tenants
- Location reads 59/100 on livability (#1,038 in IL) — a working-class tenant base; expect higher turnover. Strengths: cost of living A+, housing A+; Watch: employment D, schools D-, crime D-.
- Sangamon Valley CUSD 9 (rural): math 10% / reading 27% proficiency, ranked #432 of 620 in IL (top 70%) — low school quality limits family demand, transient renter base, plan for 1-2y turnover.
- Market conditions: 5 active listings in the ZIP; 63 units permitted in Macon County in 2024 (0 in 5+ unit buildings).
Forward outlook
- In year one you build about $1k of equity ($335 loan paydown + $752 appreciation (1.6% local appreciation)).
- Macon County population projected at -24% by 2050 — secular population decline; favor cash flow + early exit over multi-decade hold.
- At projected returns (1.6% appreciation + 3.0% rent growth), your $14k cash investment doubles in ~3 years — after that, you're playing with house money.
Negotiation context
- It's been on market 159 days — a 12% lower offer ($43k) is reasonable based on typical stale-listing flexibility.
- 2 sale attempts; this cycle's ask has dropped $16k (25%) from the opening price — seller is motivated, your offer sets the floor, not the list.
Risks & watch-outs
- Watch-outs: property tax is 4.2% of price; built in 1890 — expect roof / HVAC / electrical / plumbing capex.
Questions for the listing agent
- It's been on market 159 days. Have you received any prior offers? Is the seller open to a 12% concession, seller financing, or rate buy-down credit?
- Built in 1890 — when were the roof, HVAC, electrical panel, plumbing, and water heater last replaced?
- Property tax is high relative to price — has the assessment been appealed recently, and will the sale trigger a re-assessment?
- Why hasn't it sold? Are there any deal-killer items the seller is aware of (foundation, flood, title, zoning, code violations)?
- Is there a deadline driving the sale (1031 exchange, divorce, estate, relocation)? That informs how much negotiation room exists.
- Schools are D-rated, which usually means shorter tenancies and higher turnover. Who's the typical renter profile here, and what's been the actual vacancy rate?
- Crime grade is D in this area — have there been break-ins, vandalism, or insurance claims at this property in the last 3 years? What carrier currently insures it and at what premium?
- What's the average days-on-market for RENTAL listings here right now (not sales)? A rising rental-DOM trend means longer vacancies and softer asking-rent achievability than the comps imply.
- What's the recent tenant-quality profile in this submarket — average credit score on applications, eviction rate, late-payment / NSF rate, and stable-employment percentage? A property-management company in the area should have these aggregated.
- How much new for-sale + rental construction is in the pipeline within 1–3 miles? Heavy new supply typically softens prices + rents 12–24 months out; constrained supply supports both.
Investment metrics
- 1% rule
- 1.96% ✓
- Cap rate
- 13.87%
- Cash-on-cash
- 27.08%
- DSCR
- 2.20
- GRM
- 4.2
CMA / ARV
- ARV (median comp)
- $152,639
- List price
- $48,500
- Delta
- -68.23%
- Verdict
- UNDERPRICED
- Comps
- 16 within 1.0 mi
Projected returns pro-forma
1.55% appreciation · 3.0% rent growth · sell at horizon
- IRR
- 30.5%
- Equity multiple
- 2.61×
- Total profit
- $21,825
- Equity at exit
- $17,961
- IRR
- 32.4%
- Equity multiple
- 5.07×
- Total profit
- $55,240
- Equity at exit
- $24,994
Cash invested: $13,580 (down + closing). Projections, not guarantees.
Landlord ↔ Tenant lean methodology
- Overall (STATE)
- 43 Moderately Tenant-Leaning
- State Illinois
- 43 Moderately Tenant-Leaning · D+7
- County
- — inherits STATE
- City
- — inherits STATE
ZIP-level market 62551
- Home prices YoY
- 1.1%
- Active inventory
- 5
- Price-to-rent
- 4.2×
Monthly cashflow live
- Estimated rent
- $953 medium interval (Pro) →
- Mortgage (P&I)
- −$254
- Tax from tax record
- −$172 /mo · $2,060/yr
- Insurance
- −$20
- HOA
- −$0
- Vacancy / Maint / Mgmt
- −$200
- Net cashflow
- $306
Break-even live
Sensitivity live
| Price | -10% $334 | -5% $320 | +0% $306 | +5% $293 | +10% $279 |
|---|---|---|---|---|---|
| Rent | -10% $231 | -5% $269 | +0% $306 | +5% $344 | +10% $382 |
| Rate | -1.0pp $331 | -0.5pp $319 | base $306 | +0.5pp $294 | +1.0pp $281 |
UW: 25.0% down · 7.5% · 30yr · 1.5% tax · 5.0% vac · 8.0% maint · 8.0% mgmt
Financing live
Cash to close
- Down payment
- $12,125
- Closing costs
- $1,455
- Reserves months
- —
- Total cash needed
- —
Loan-product check · same deal, 3 products live
Conventional
25% down · 7.5% · 30yr
- Down + closing
- —
- Monthly P&I
- —
- Monthly cashflow
- —
- DSCR
- —
- Eligible?
- —
Personal DTI + credit; lowest rate.
DSCR
20% down · 8.5% · 30yr
- Down + closing
- —
- Monthly P&I
- —
- Monthly cashflow
- —
- DSCR
- —
- Eligible?
- —
No personal income docs; deal must DSCR.
Hard money
10% down · 12.0% · 12mo
- Down + closing
- —
- Monthly P&I
- —
- Monthly cashflow
- —
- DSCR
- —
- Eligible?
- —
Short-term bridge; refi at stabilization.
Listing history 22 events
-
2026-06-21days on market $48,500 Active 159 DOM
-
2026-06-19days on market $48,500 Active 157 DOM
-
2026-06-18days on market $48,500 Active 156 DOM
-
2026-06-17days on market $48,500 Active 155 DOM
-
2026-06-16days on market $48,500 Active 154 DOM
-
2026-06-15days on market $48,500 Active 153 DOM
-
2026-06-14days on market $48,500 Active 151 DOM
-
2026-06-13days on market $48,500 Active 150 DOM
-
2026-06-10days on market $48,500 Active 148 DOM
-
2026-06-09days on market $48,500 Active 147 DOM
-
2026-06-08days on market $48,500 Active 146 DOM
-
2026-06-07days on market $48,500 Active 145 DOM
-
2026-06-05days on market $48,500 Active 142 DOM
-
2026-06-02days on market $48,500 Active 140 DOM
-
2026-06-01days on market $48,500 Active 139 DOM
-
2026-06-01days on market $48,500 Active 138 DOM
-
2026-05-30days on market $48,500 Active 137 DOM
-
2026-05-16price $48,500 357-char remark
Show marketing remark (357 chars)
Spacious home located in Niantic far west on Montgomery St. Whether you are just wanting the small town feeling or looking for a quality investment opportunity, this is for your. 3 bedrooms and 2 full bathrooms, plus a bonus room on the main floor and an enclosed porch area. Parking in both front and back. Siding, roof, subfloor and flooring new in 2024.
-
2026-05-05status Active 357-char remark
Show marketing remark (357 chars)
Spacious home located in Niantic far west on Montgomery St. Whether you are just wanting the small town feeling or looking for a quality investment opportunity, this is for your. 3 bedrooms and 2 full bathrooms, plus a bonus room on the main floor and an enclosed porch area. Parking in both front and back. Siding, roof, subfloor and flooring new in 2024.
-
2026-04-07price $52,500 357-char remark
Show marketing remark (357 chars)
Spacious home located in Niantic far west on Montgomery St. Whether you are just wanting the small town feeling or looking for a quality investment opportunity, this is for your. 3 bedrooms and 2 full bathrooms, plus a bonus room on the main floor and an enclosed porch area. Parking in both front and back. Siding, roof, subfloor and flooring new in 2024.
-
2026-02-03price $60,000 357-char remark
Show marketing remark (357 chars)
Spacious home located in Niantic far west on Montgomery St. Whether you are just wanting the small town feeling or looking for a quality investment opportunity, this is for your. 3 bedrooms and 2 full bathrooms, plus a bonus room on the main floor and an enclosed porch area. Parking in both front and back. Siding, roof, subfloor and flooring new in 2024.
-
2026-01-08$65,000 Active 357-char remark
Show marketing remark (357 chars)
Spacious home located in Niantic far west on Montgomery St. Whether you are just wanting the small town feeling or looking for a quality investment opportunity, this is for your. 3 bedrooms and 2 full bathrooms, plus a bonus room on the main floor and an enclosed porch area. Parking in both front and back. Siding, roof, subfloor and flooring new in 2024.
ⓘ Source: listings_history table (triggers on properties + properties_extension) + one-shot
backfill from property_details.listing_events for pre-trigger history.
Tax reassessment forecast IL · Partial reset (capped growth)
- Current annual tax
- $2,060 · $172/mo
- Projected year-2 tax
- $2,060 · $172/mo
- Expected delta
- $0/yr ($0/mo · 0.0%)
ⓘ Screening estimate from a state-policy table — verify with the county assessor before closing.
Climate risk First Street
- Flood 1/10 Low FEMA zone X (unshaded) · 0% chance over 30 yrs
- Wildfire 1/10 Low
- Heat 3/10 Moderate 7 d/yr ≥105°F today · 19 d/yr by 30 yrs out
- Wind 2/10 Low 2% chance of damaging wind over 30 yrs
- Air quality 2/10 Low 1 unhealthy d/yr today · 1 by 30 yrs out
Nearby sold comps map
Loading sold comps map…
Walkable amenities ~0.75 mi
Loading nearby amenities…
Taxation est. · year 1
- Rental income
- $11,432
- − Mortgage interest
- −$2,717
- − Property taxes
- −$2,060
- − Insurance
- −$242
- − Repairs & maintenance
- −$915
- − Management
- −$915
- − Depreciation
- −$1,411
- Taxable income
- $3,173
- Est. tax owed @ 24.0%
- −$762
- After-tax cash flow
- $2,915/yr
For passive investors: Depreciation is non-cash, so a rental often shows a tax loss while cash-flowing — sheltering income. Rental losses are passive: they offset passive income freely, and up to $25,000/yr can offset ordinary (W-2) income if you actively participate and your MAGI is under $100k (phasing out to $0 by $150k); unused losses carry forward. On sale, claimed depreciation is recaptured at up to 25%, and gains may owe capital-gains tax (a 1031 exchange can defer both). Figures are a year-1 estimate at your 24.0% rate — not tax advice; consult a CPA.
Schools (NCES district)
- District
- Sangamon Valley CUSD 9
- NCES district ID
- 1700324
- Math proficiency
- 10% ▼ -16.00%
- Reading proficiency
- 27% ▼ -26.00%
- Median HH income
- $57,341
- Composite
- 17.31/100
- National rank
- #9084
- State rank
- #432 of 620 in IL
Livability — Niantic
- Score
- 59/100
- State rank
- #1038
- US rank
- #19875
Category grades
Schools grade is shown separately in the Schools card above.
Census & demographics
- Census place
- Niantic, IL
- Population (ZIP)
- 908
Population outlook (Macon County) Hauer SSP2
- Today (2025)
- 99,568 people
- By 2030
- 94,973 · -4.6%
- By 2040
- 85,250 · -14.4%
- By 2050
- 75,920 · -23.8%
- By 2075
- 55,962 · -43.8%
- By 2100
- 36,468 · -63.4%
Race, ethnicity, and origin ACS 2023
- Neighborhood character
- Predominantly White (82%)
- Race & ethnicity
- White 82% Two or more races 15% Hispanic / Latino 10%
- Hispanic origin (detail)
- Mexican 10%
- Common ancestry
- Slovak 4% Serbian 2% Lithuanian 2%
- Foreign-born
- 3% · Canada
- Languages at home
- 92% English-only · Spanish 8% Other Indo-European 1%
Political lean MEDSL · Macon
- 2024 margin
- R (+18.9) · D 39.8% · R 58.7% · Other 1.4%
- 2008→2024 swing
- -20.0pp toward R · 2008: 1.1pp · 2024: -18.9pp
- All cycles
- 2024: R+18.9 2020: R+17.7 2016: R+18.1 2012: R+5.2 2008: D+1.1
Not yet ingested
- Civics
- —
Market trends
- HPI YoY
- ▲ 1.55%
- Current HPI
- 143.4612
- Rent YoY
- —
- Metro
- —
- State GDP YoY
- ▲ 1.59%
- F500 in state
- 60
Industry mix (Fortune 500 HQ in IL)
| Industry | F500 HQs | Revenue |
|---|---|---|
| Insurance | 4 | $201B |
|
||
| Consumer Goods | 4 | $87B |
|
||
| Industrial Machinery | 3 | $64B |
|
||
| Healthcare | 2 | $55B |
|
||
| Retail / Pharmacy | 1 | $148B |
|
||
| Agriculture / Food | 1 | $86B |
|
||
Price history
-25.4% since first listed5 events — show timeline
- 2026-05-16 Price Changed $48,500 CIBR
- 2026-05-05 Relisted — CIBR
- 2026-04-07 Price Changed $52,500 CIBR
- 2026-02-03 Price Changed $60,000 CIBR
- 2026-01-08 Listed $65,000 CIBR
Property tax history
+10.5%/yrLatest (2024): $2,060 · +5.0% YoY. Source: county tax records.
Cash-flow waterfall
monthlySold comps — $/sqft
last 12 mo · ≤1 miLoading sold comps…