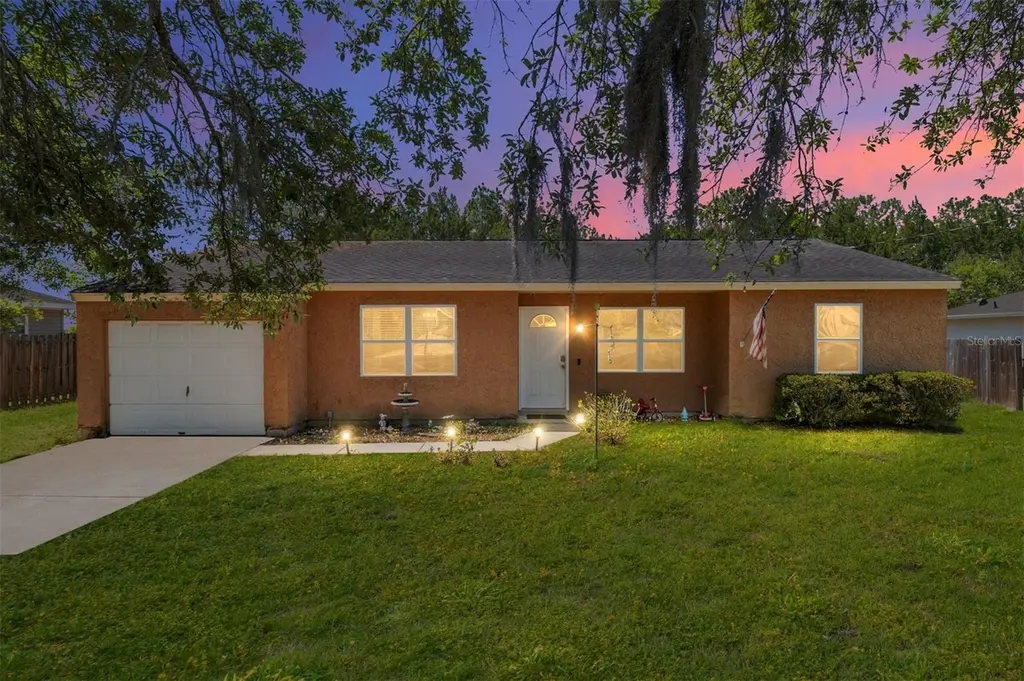
18 Olive Cir · Silver Springs Shores, FL
Flood risk 1/10 · Minimal
- FEMA flood zone
- X (unshaded)
- Chance of flooding over 30 yrs
- 0.0%
- Est. flood insurance / yr
- $507 – $1,088
Fire risk 5/10 · Moderate
- Est. fire insurance / yr
- $947 – $1,759
Heat risk 8/10 · Major
- Hot days now (above 108°F)
- 7 days/yr
- Hot days in 30 yrs
- 21 days/yr
Wind risk 9/10 · Severe
- Chance of severe wind over 30 yrs
- 99.0%
Air-quality risk 3/10 · Minor
- Unhealthy air days now
- 3 days/yr
- Unhealthy air days in 30 yrs
- 4 days/yr
Risk factors via First Street. Map © Google.
Why this score? — see what drove the C+ grade
The composite is a weighted blend of 9 inputs, each scored 0–100. Each bar is that input's sub-score; the figure is the points it added to the 100-point composite (weight × sub-score).
- Cash flow +20.0/30.0
- ARV discount +11.3/15.0
- Appreciation +8.0/10.0
- DSCR +6.3/10.0
- 1% rule +4.2/10.0
- Schools +3.6/10.0
- Livability +3.4/5.0
- Rent growth +2.5/5.0
- Condition / age +2.5/5.0
$204,900
🖨 Deal sheet 📄 Offer letter ✓ Due diligence
Listing remarks MLS
Welcome to this charming 3-bedroom, 2-bath home located in the desirable Silver Springs Shores community. Nestled on a quiet road in a well-established neighborhood, this property offers a peaceful setting while still being conveniently close to shopping, dining, and schools. Spacious layout with great potential, perfect for first-time buyers, investors, or anyone looking to enjoy a relaxed Florida lifestyle. Major upgrades include 2018 Roof and 2018 A/C
Key facts
- 0.23 acre lot
- Garage
- Built 1987
Neighborhood map
What this means for you Summary
Snapshot
- This is a 3-bed/2.0-bath single-family listed at $205k.
Deal economics
- At list price, monthly cash flow is $251 ($3k/yr) — positive.
- The deal already cash-flows at list — no discount required.
- To meet the 1% rule (rent ≥ 1% of price), the offer needs to be $189k (8.0% below list).
- Recommended offer: $189k (8.0% below list) — sets the bar for 1% rule.
- Cap rate 7.8% vs local median 4.7% in Silver Springs Shores — top-decile yield for the area; either an underpriced asset or a hidden risk that comps aren't pricing in. Stress-test before assuming the spread holds.
Location & tenants
- Location reads 68/100 on livability (#527 in FL) — a middle-class / working-renter tenant base. Strengths: cost of living A+, housing A+, health & safety A-; Watch: crime C-, employment D, schools F.
- Marion (rural): math 42% / reading 43% proficiency, ranked #61 of 73 in FL (top 84%) — families likely to look elsewhere, expect single-tenant / working-renter base with shorter leases; 61% free/reduced lunch — lower-income household profile, screen leases tightly.
- Market conditions: Rents flat; 674 active listings in the ZIP; 6 comparable units currently listed for rent nearby; rentals leasing fast (median 14d on market — plan ~1-2 weeks tenant-placement turnaround); 7,071 units permitted in Marion County in 2024 (534 in 5+ unit buildings).
- This rent runs 35% of the median local income ($64k/yr) — at the standard rent-burdened threshold; future hikes will face affordability resistance.
Forward outlook
- In year one you build about $14k of equity ($1k loan paydown + $12k appreciation (5.9% local appreciation)).
- Marion County population projected at +13% by 2050 — modest demand growth; plan on rents tracking national, not racing it.
- At projected returns (5.9% appreciation + 0.2% rent growth), your $57k cash investment doubles in ~4 years — after that, you're playing with house money.
- By year 3, paydown + projected appreciation supports a ~$34k cash-out refi (75% LTV) — recoverable capital for the next deal without selling this one.
Negotiation context
- It's been on market 57 days — a 3% lower offer ($199k) is reasonable based on typical stale-listing flexibility.
- 4 sale attempts since 18y ago with the ask held roughly flat each time — persistent listings suggest the price (not the market) is what's stuck; bring a comps-based counter.
- Current owner paid $76k; list at $205k implies a 170% gain — meaningful room to come down on a strong offer.
Risks & watch-outs
- Climate carrying-cost: severe wind risk, 99% chance of damaging wind over 30y; moderate wildfire risk; extreme-heat days projected 7→21/yr by 2055 (HVAC capex compounding) — expect insurance premiums to compound above CPI over the hold.
Questions for the listing agent
- It's been on market 57 days. Have you received any prior offers? Is the seller open to a 8% concession, seller financing, or rate buy-down credit?
- Is there a deadline driving the sale (1031 exchange, divorce, estate, relocation)? That informs how much negotiation room exists.
- Schools are F-rated, which usually means shorter tenancies and higher turnover. Who's the typical renter profile here, and what's been the actual vacancy rate?
- What's the average days-on-market for RENTAL listings here right now (not sales)? A rising rental-DOM trend means longer vacancies and softer asking-rent achievability than the comps imply.
- What's the recent tenant-quality profile in this submarket — average credit score on applications, eviction rate, late-payment / NSF rate, and stable-employment percentage? A property-management company in the area should have these aggregated.
- How much new for-sale + rental construction is in the pipeline within 1–3 miles? Heavy new supply typically softens prices + rents 12–24 months out; constrained supply supports both.
Investment metrics
- 1% rule
- 0.92% ✗
- Cap rate
- 7.76%
- Cash-on-cash
- 5.25%
- DSCR
- 1.23
- GRM
- 9.1
CMA / ARV
- ARV (median comp)
- $224,014
- List price
- $204,900
- Delta
- -8.53%
- Verdict
- FAIR
- Comps
- 20 within 1.0 mi
Show comp detail 4 sales within ~0.75 mi
| Address | Dist | Beds/Ba | Sqft | Sold | Price | $/sf | Match |
|---|---|---|---|---|---|---|---|
| 73 Olive Cir | 0.16mi | 3/2.0 | 1,140 (-2%) | 22mo | $220,000 | $193 | 71 |
| 49 Oak Pass Loop | 0.52mi | 3/2.0 | 1,192 (+2%) | 14mo | $195,000 | $164 | 60 |
| 42 Olive Dr | 0.44mi | 3/2.0 | 1,336 (+15%) | 2mo | $196,000 | $147 | 53 |
| 200 Oak Lane Cir | 0.70mi | 3/2.0 | 1,331 (+14%) | 3mo | $249,900 | $188 | 41 |
Match score weights: distance 35% · size 25% · config 20% · recency 20%. Top-matched comps best support the ARV.
Projected returns pro-forma
5.93% appreciation · 0.17% rent growth · sell at horizon
- IRR
- 18.3%
- Equity multiple
- 2.20×
- Total profit
- $69,015
- Equity at exit
- $127,936
- IRR
- 17.0%
- Equity multiple
- 4.16×
- Total profit
- $181,111
- Equity at exit
- $231,257
Cash invested: $57,372 (down + closing). Projections, not guarantees.
Landlord ↔ Tenant lean methodology
- Overall (STATE)
- 87 Strongly Landlord-Friendly
- State Florida
- 87 Strongly Landlord-Friendly · R+3
- County
- — inherits STATE
- City
- — inherits STATE
ZIP-level market 34472
- Home prices YoY
- 2.4%
- Rents YoY
- 0.2%
- Active inventory
- 674
- Price-to-rent
- 9.1×
Monthly cashflow live
- Estimated rent
- $1,886 high interval (Pro) →
- Mortgage (P&I)
- −$1,075
- Tax from tax record
- −$79 /mo · $950/yr
- Insurance
- −$85
- HOA
- −$0
- Vacancy / Maint / Mgmt
- −$396
- Net cashflow
- $251
Break-even live
UW: 25.0% down · 7.5% · 30yr · 1.5% tax · 5.0% vac · 8.0% maint · 8.0% mgmt
Financing live
Cash to close
- Down payment
- $51,225
- Closing costs
- $6,147
- Reserves months
- —
- Total cash needed
- —
Loan-product check · same deal, 3 products live
Conventional
25% down · 7.5% · 30yr
- Down + closing
- —
- Monthly P&I
- —
- Monthly cashflow
- —
- DSCR
- —
- Eligible?
- —
Personal DTI + credit; lowest rate.
DSCR
20% down · 8.5% · 30yr
- Down + closing
- —
- Monthly P&I
- —
- Monthly cashflow
- —
- DSCR
- —
- Eligible?
- —
No personal income docs; deal must DSCR.
Hard money
10% down · 12.0% · 12mo
- Down + closing
- —
- Monthly P&I
- —
- Monthly cashflow
- —
- DSCR
- —
- Eligible?
- —
Short-term bridge; refi at stabilization.
Rent comps 6 comps
| Address | Beds | Baths | Sqft | Rent | $/sqft | DOM | Units | Dist |
|---|---|---|---|---|---|---|---|---|
| 21 Olive Cir Ocala, FL | 3.0 | 2.0 | 1459 | $1,800 | $1.23 | 13d | 1 | 0.04mi |
| 5 Olive Dr Ocala, FL | 3.0 | 2.0 | 1450 | $1,800 | $1.24 | 21d | 1 | 0.19mi |
| 106 Oak Cir Ocala, FL | 3.0 | 2.0 | 1453 | $1,795 | $1.24 | 13d | 1 | 0.23mi |
| 226 Oak Cir Ocala, FL | 3.0 | 2.0 | 1406 | $1,675 | $1.19 | 13d | 1 | 0.88mi |
| 2 Ash Dr Ocala, FL | 3.0 | 2.0 | 1083 | $1,750 | $1.62 | 13d | 1 | 1.06mi |
| 8 Ash Pass Run Ocala, FL | 3.0 | 2.0 | 1128 | $1,650 | $1.46 | 21d | 1 | 1.20mi |
Listing history 25 events
-
2026-06-18days on market $204,900 Active 57 DOM
-
2026-06-17days on market $204,900 Active 56 DOM
-
2026-06-16days on market $204,900 Active 55 DOM
-
2026-06-15days on market $204,900 Active 54 DOM
-
2026-06-14days on market $204,900 Active 52 DOM
-
2026-06-13days on market $204,900 Active 51 DOM
-
2026-06-10days on market $204,900 Active 49 DOM
-
2026-06-09days on market $204,900 Active 48 DOM
-
2026-06-08days on market $204,900 Active 47 DOM
-
2026-06-07days on market $204,900 Active 46 DOM
-
2026-06-03days on market $204,900 Active 42 DOM
-
2026-06-02days on market $204,900 Active 41 DOM
-
2026-06-01days on market $204,900 Active 40 DOM
-
2026-05-31days on market $204,900 Active 39 DOM
-
2026-05-30days on market $204,900 Active 38 DOM
-
2026-04-22$209,900 Active 458-char remark
Show marketing remark (458 chars)
Welcome to this charming 3-bedroom, 2-bath home located in the desirable Silver Springs Shores community. Nestled on a quiet road in a well-established neighborhood, this property offers a peaceful setting while still being conveniently close to shopping, dining, and schools. Spacious layout with great potential, perfect for first-time buyers, investors, or anyone looking to enjoy a relaxed Florida lifestyle. Major upgrades include 2018 Roof and 2018 A/C
-
2016-12-07soldstatus $76,000
-
2016-12-02soldstatus $76,000 241-char remark
Show marketing remark (241 chars)
This 3/2/1 has recent upgrades of insulated vinyl framed windows, central AC and Heat, refrigerator and new bathroom vanity with sink and faucet. Tile floors through kitchen, breakfast nook, living room, dining area, master bedroom and bath.
-
2016-03-15$79,900 241-char remark
Show marketing remark (241 chars)
This 3/2/1 has recent upgrades of insulated vinyl framed windows, central AC and Heat, refrigerator and new bathroom vanity with sink and faucet. Tile floors through kitchen, breakfast nook, living room, dining area, master bedroom and bath.
-
2009-08-31historical
-
2009-03-31$105,000
-
2009-01-31historical
-
2008-08-01$105,000
-
1998-02-06soldstatus $41,500
-
1987-12-01soldstatus $72,000
ⓘ Source: listings_history table (triggers on properties + properties_extension) + one-shot
backfill from property_details.listing_events for pre-trigger history.
Tax reassessment forecast FL · Resets to sale price
- Current annual tax
- $950 · $79/mo
- Projected year-2 tax
- $1,701 · $142/mo
- Expected delta
- +$751/yr (+$63/mo · 79.1%)
ⓘ Screening estimate from a state-policy table — verify with the county assessor before closing.
Climate risk First Street
- Flood 1/10 Low FEMA zone X (unshaded) · 0% chance over 30 yrs
- Wildfire 5/10 Major
- Heat 8/10 Severe 7 d/yr ≥108°F today · 21 d/yr by 30 yrs out
- Wind 9/10 Extreme 99% chance of damaging wind over 30 yrs
- Air quality 3/10 Moderate 3 unhealthy d/yr today · 4 by 30 yrs out
Nearby sold comps map
Loading sold comps map…
Walkable amenities ~0.75 mi
Loading nearby amenities…
Taxation est. · year 1
- Rental income
- $22,632
- − Mortgage interest
- −$11,478
- − Property taxes
- −$950
- − Insurance
- −$1,024
- − Repairs & maintenance
- −$1,811
- − Management
- −$1,811
- − Depreciation
- −$5,961
- Taxable loss
- −$402
- Est. tax savings @ 24.0%
- +$96
- After-tax cash flow
- $3,107/yr
For passive investors: Depreciation is non-cash, so a rental often shows a tax loss while cash-flowing — sheltering income. Rental losses are passive: they offset passive income freely, and up to $25,000/yr can offset ordinary (W-2) income if you actively participate and your MAGI is under $100k (phasing out to $0 by $150k); unused losses carry forward. On sale, claimed depreciation is recaptured at up to 25%, and gains may owe capital-gains tax (a 1031 exchange can defer both). Figures are a year-1 estimate at your 24.0% rate — not tax advice; consult a CPA.
Schools (NCES district)
- District
- Marion
- NCES district ID
- 1201260
- Math proficiency
- 42% ▼ -7.00%
- Reading proficiency
- 43% ▼ -4.00%
- Median HH income
- $40,015
- Composite
- 35.61/100
- National rank
- #4890
- State rank
- #61 of 73 in FL
Livability — Silver Springs Shores
- Score
- 68/100
- State rank
- #527
- US rank
- #9854
Category grades
Schools grade is shown separately in the Schools card above.
Census & demographics
- Census place
- Silver Springs Shores, FL
- County
- Marion County · 315,796 people
- City population
- 34,665
- Metro
- Ocala, FL
- Population (ZIP)
- 35,851
- Household income
- $64,208
- Rent vs Own
- Severe rent burden
- 655.0
Population outlook (Marion County) Hauer SSP2
- Today (2025)
- 365,905 people
- By 2030
- 376,768 · +3.0%
- By 2040
- 396,555 · +8.4%
- By 2050
- 412,723 · +12.8%
- By 2075
- 446,090 · +21.9%
- By 2100
- 436,193 · +19.2%
Race, ethnicity, and origin ACS 2023
- Neighborhood character
- Diverse neighborhood (Simpson 0.65)
- Race & ethnicity
- White 50% Hispanic / Latino 25% Black 21% Two or more races 18% Asian 2%
- Hispanic origin (detail)
- Mexican 2% Puerto Rican 14% Cuban 3%
- Common ancestry
- Romanian 2% Iranian 1% Lithuanian 1%
- Foreign-born
- 11% · Canada, Jamaica, China
- Languages at home
- 78% English-only · Spanish 19% Other Indo-European 1%
Political lean MEDSL · Marion
- 2024 margin
- Solid R (+31.6) · D 33.8% · R 65.5%
- 2008→2024 swing
- -20.0pp toward R · 2008: -11.6pp · 2024: -31.6pp
- All cycles
- 2024: R+31.6 2020: R+25.9 2016: R+26.2 2012: R+16.2 2008: R+11.6
Not yet ingested
- Civics
- —
Market trends
- HPI YoY
- ▲ 5.93%
- Current HPI
- 255.0714
- Rent YoY
- ▲ 0.17%
- Metro
- Ocala, FL
- State GDP YoY
- ▲ 3.28%
- F500 in state
- 36
Industry mix (Fortune 500 HQ in FL)
| Industry | F500 HQs | Revenue |
|---|---|---|
| Industrial Technology | 2 | $29B |
|
||
| Insurance | 2 | $17B |
|
||
| Retail | 1 | $60B |
|
||
| Technology Distribution | 1 | $58B |
|
||
| Homebuilding | 1 | $35B |
|
||
| Technology Manufacturing | 1 | $35B |
|
||
Price history
+191.5% since first listed10 events — show timeline
- 2026-04-22 Listed $209,900 Stellar MLS as Distributed by MLS Grid
- 2016-12-07 Sold (Public Records) $76,000 Public Records
- 2016-12-02 Sold (MLS) $76,000 Stellar MLS as Distributed by MLS Grid
- 2016-03-15 Listed $79,900 Stellar MLS as Distributed by MLS Grid
- 2009-08-31 Listing Removed — Stellar MLS as Distributed by MLS Grid
- 2009-03-31 Listed $105,000 Stellar MLS as Distributed by MLS Grid
- 2009-01-31 Listing Removed — Stellar MLS as Distributed by MLS Grid
- 2008-08-01 Listed $105,000 Stellar MLS as Distributed by MLS Grid
- 1998-02-06 Sold (Public Records) $41,500 Public Records
- 1987-12-01 Sold (Public Records) $72,000 Public Records
Property tax history
-0.3%/yrLatest (2025): $950 · +29.7% YoY. Source: county tax records.
Cash-flow waterfall
monthlySold comps — $/sqft
last 12 mo · ≤1 miLoading sold comps…