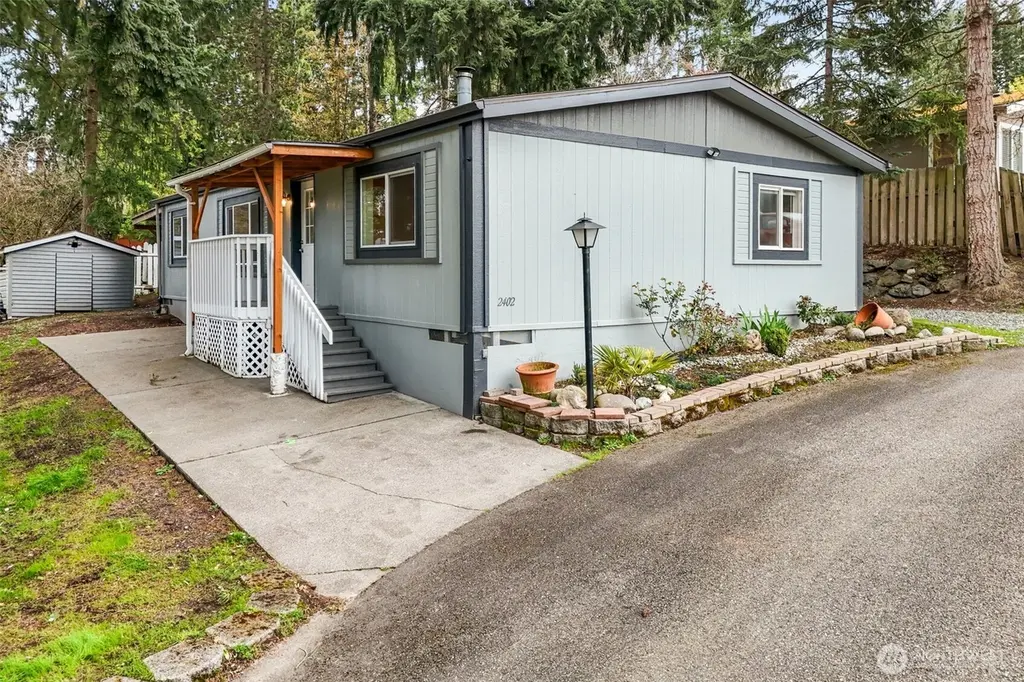
2402 S 370th Pl · Lakeland South, WA
Flood risk 1/10 · Minimal
- FEMA flood zone
- X (unshaded)
- Chance of flooding over 30 yrs
- 0.0%
- Est. flood insurance / yr
- $507 – $1,088
Fire risk 1/10 · Minimal
- Est. fire insurance / yr
- $604 – $1,122
Heat risk 3/10 · Minor
- Hot days now (above 88°F)
- 7 days/yr
- Hot days in 30 yrs
- 15 days/yr
Wind risk 1/10 · Minimal
- Chance of severe wind over 30 yrs
- —
Air-quality risk 7/10 · Major
- Unhealthy air days now
- 10 days/yr
- Unhealthy air days in 30 yrs
- 11 days/yr
Risk factors via First Street. Map © Google.
Why this score? — see what drove the C+ grade
The composite is a weighted blend of 9 inputs, each scored 0–100. Each bar is that input's sub-score; the figure is the points it added to the 100-point composite (weight × sub-score).
- Cash flow +30.0/30.0
- 1% rule +10.0/10.0
- DSCR +10.0/10.0
- Livability +4.0/5.0
- Condition / age +4.0/5.0
- Schools +3.9/10.0
- Rent growth +3.1/5.0
- ARV discount +0.0/15.0
- Appreciation +0.0/10.0
$165,000
🖨 Deal sheet 📄 Offer letter ✓ Due diligence
Listing remarks
Discover life at Killarney Woods, a sought-after all-ages community! This beautifully remodeled, move-in ready home features 3 bedrooms and 2 bathrooms with a generous single-level floor plan designed for easy, everyday living. The updated kitchen is designed with a chef-inspired layout, offering both style and functionality. A separate laundry room adds everyday convenience, while the remodeled bathrooms bring a modern, refreshed feel throughout the home. The expansive primary suite offers a private full bathroom along with a large walk-in closet, creating a comfortable resting space. Positioned on a premium corner lot, the home provides added privacy, and the outdoor patio is perfectly si
Key facts
- Parking
- Built 1989
- Listed 73 days
Neighborhood map
What this means for you Summary
Snapshot
- This is a 3-bed/2.0-bath manufactured listed at $165k. Condition is rated good.
Deal economics
- At list price, monthly cash flow is $943 ($11k/yr) — positive.
- The deal already cash-flows at list — no discount required.
- Meets the 1% rule at list price ($3k rent vs $165k).
- Recommended offer: $155k (6.0% below list) — sets the bar for market timing.
- Cap rate 13.1% vs local median 2.9% in Lakeland South — top-decile yield for the area; either an underpriced asset or a hidden risk that comps aren't pricing in. Stress-test before assuming the spread holds.
Location & tenants
- Location reads 79/100 on livability (#113 in WA, #2,299 nationally) — a middle-class / working-renter tenant base. Strengths: commute A+, employment A+, housing A+; Watch: amenities F, cost of living F.
- Federal Way School District (suburban): math 35% / reading 47% proficiency, ranked #207 of 291 in WA (top 71%) — families likely to look elsewhere, expect single-tenant / working-renter base with shorter leases.
- Market conditions: Rents rising (+2.3%/yr); 231 active listings in the ZIP; 6 comparable units currently listed for rent nearby; rentals leasing fast (median 2d on market — plan ~1-2 weeks tenant-placement turnaround); solid renter incomes; 10,555 units permitted in King County in 2024 (7,119 in 5+ unit buildings).
- This rent runs 42% of the median local income ($75k/yr) — at the standard rent-burdened threshold; future hikes will face affordability resistance.
Forward outlook
- Local home prices are declining (-3.0%/yr); year-one equity from $1k of loan paydown is wiped out by about $5k of value loss. Plan a longer hold.
- King County population projected at +44% by 2050 — long-run rental-demand tailwind backs the buy-and-hold thesis.
- At projected returns (-3.0% appreciation + 2.3% rent growth), your $46k cash investment doubles in ~6 years — after that, you're playing with house money.
Negotiation context
- It's been on market 73 days — a 6% lower offer ($155k) is reasonable based on typical stale-listing flexibility.
Questions for the listing agent
- It's been on market 73 days. Have you received any prior offers? Is the seller open to a 6% concession, seller financing, or rate buy-down credit?
- Why hasn't it sold? Are there any deal-killer items the seller is aware of (foundation, flood, title, zoning, code violations)?
- Is there a deadline driving the sale (1031 exchange, divorce, estate, relocation)? That informs how much negotiation room exists.
- What's the average days-on-market for RENTAL listings here right now (not sales)? A rising rental-DOM trend means longer vacancies and softer asking-rent achievability than the comps imply.
- What's the recent tenant-quality profile in this submarket — average credit score on applications, eviction rate, late-payment / NSF rate, and stable-employment percentage? A property-management company in the area should have these aggregated.
- How much new for-sale + rental construction is in the pipeline within 1–3 miles? Heavy new supply typically softens prices + rents 12–24 months out; constrained supply supports both.
Investment metrics
- 1% rule
- 1.60% ✓
- Cap rate
- 13.15%
- Cash-on-cash
- 24.48%
- DSCR
- 2.09
- GRM
- 5.2
CMA / ARV
- ARV (median comp)
- $136,510
- List price
- $165,000
- Delta
- 20.87%
- Verdict
- OVERPRICED
- Comps
- 20 within 1.0 mi
Show comp detail 12 sales within ~0.75 mi
| Address | Dist | Beds/Ba | Sqft | Sold | Price | $/sf | Match |
|---|---|---|---|---|---|---|---|
| 2500 S 370th St #54 | 0.14mi | 3/2.0 | 1,344 (0%) | 9mo | $127,500 | $95 | 86 |
| 2500 S 370th St #162 | 0.14mi | 3/2.0 | 1,380 (+3%) | 4mo | $160,000 | $116 | 86 |
| 2500 S 370th St N #85 | 0.14mi | 2/2.0 (-1) | 1,344 (0%) | 6mo | $125,000 | $93 | 84 |
| 2500 S 370th St #213 | 0.14mi | 2/2.0 (-1) | 1,344 (0%) | 7mo | $69,900 | $52 | 83 |
| 2500 S 370th St #32 | 0.12mi | 2/2.0 (-1) | 1,248 (-7%) | 0mo | $84,000 | $67 | 77 |
| 2430 S 371st St #49 | 0.12mi | 3/2.0 | 1,200 (-11%) | 2mo | $190,000 | $158 | 75 |
| 37301 28th Ave S | 0.18mi | 2/2.0 (-1) | 1,248 (-7%) | 0mo | $200,000 | $160 | 74 |
| 2500 S 370th St #225 | 0.14mi | 3/2.0 | 1,500 (+12%) | 0mo | $160,000 | $107 | 74 |
| 2500 S 370th St #161 | 0.12mi | 3/2.0 | 1,500 (+12%) | 2mo | $175,000 | $117 | 74 |
| 2500 Alder St #33 | 0.71mi | 2/2.0 (-1) | 1,440 (+7%) | 2mo | $130,000 | $90 | 48 |
| 2500 Alder St #16 | 0.71mi | 2/2.0 (-1) | 1,248 (-7%) | 5mo | $138,000 | $111 | 46 |
| 2500 Alder St #52 | 0.60mi | 2/2.0 (-1) | 1,536 (+14%) | 5mo | $145,000 | $94 | 39 |
Match score weights: distance 35% · size 25% · config 20% · recency 20%. Top-matched comps best support the ARV.
Projected returns pro-forma
-3.0% appreciation · 2.33% rent growth · sell at horizon
- IRR
- 17.1%
- Equity multiple
- 1.68×
- Total profit
- $31,567
- Equity at exit
- $24,602
- IRR
- 25.1%
- Equity multiple
- 3.12×
- Total profit
- $97,800
- Equity at exit
- $14,266
Cash invested: $46,200 (down + closing). Projections, not guarantees.
Landlord ↔ Tenant lean methodology
- Overall (STATE)
- 28 Tenant-Leaning
- State Washington
- 28 Tenant-Leaning · D+8
- County
- — inherits STATE
- City
- — inherits STATE
ZIP-level market 98003
- Rents YoY
- 2.3%
- Active inventory
- 231
- Price-to-rent
- 5.2×
Monthly cashflow live
- Estimated rent
- $2,636 high interval (Pro) →
- Mortgage (P&I)
- −$865
- Tax est. 1.5%
- −$206 /mo · $2,475/yr
- Insurance
- −$69
- HOA
- −$0
- Vacancy / Maint / Mgmt
- −$554
- Net cashflow
- $943
Break-even live
UW: 25.0% down · 7.5% · 30yr · 1.5% tax · 5.0% vac · 8.0% maint · 8.0% mgmt
Financing live
Cash to close
- Down payment
- $41,250
- Closing costs
- $4,950
- Reserves months
- —
- Total cash needed
- —
Loan-product check · same deal, 3 products live
Conventional
25% down · 7.5% · 30yr
- Down + closing
- —
- Monthly P&I
- —
- Monthly cashflow
- —
- DSCR
- —
- Eligible?
- —
Personal DTI + credit; lowest rate.
DSCR
20% down · 8.5% · 30yr
- Down + closing
- —
- Monthly P&I
- —
- Monthly cashflow
- —
- DSCR
- —
- Eligible?
- —
No personal income docs; deal must DSCR.
Hard money
10% down · 12.0% · 12mo
- Down + closing
- —
- Monthly P&I
- —
- Monthly cashflow
- —
- DSCR
- —
- Eligible?
- —
Short-term bridge; refi at stabilization.
Rent comps 6 comps
| Address | Beds | Baths | Sqft | Rent | $/sqft | DOM | Units | Dist |
|---|---|---|---|---|---|---|---|---|
| 1926 S 368th Pl #206 Federal Way, WA | 2.0 | 2.5 | 1176 | $2,995 | $2.55 | 1d | 1 | 0.30mi |
| 2020 S 360th St Federal Way, WA | 1.0–3.0 | 1.0–2.0 | 971 | $2,305 | $2.37 | 1d | 24 | 0.83mi |
| 1211 S 376th St Milton, WA | 1.0–2.0 | 1.0–2.0 | 952 | $3,350 | $3.52 | 1d | 63 | 0.84mi |
| 210 27th Ave Milton, WA | 1.0–2.0 | 1.0–2.0 | 837 | $2,199 | $2.63 | 1d | 5 | 0.88mi |
| 207 Meridian Ave E Edgewood, WA | 1.0–2.0 | 1.0–2.0 | 835 | $2,649 | $3.17 | 1d | 18 | 1.14mi |
| 35703 16th Ave S Federal Way, WA | 1.0–5.0 | 1.0–3.0 | 1098 | $2,217 | $2.02 | 1d | 28 | 1.15mi |
Listing history 15 events
-
2026-06-18days on market $165,000 Active 73 DOM
-
2026-06-17days on market $165,000 Active 72 DOM
-
2026-06-16days on market $165,000 Active 71 DOM
-
2026-06-15days on market $165,000 Active 70 DOM
-
2026-06-13days on market $165,000 Active 68 DOM
-
2026-06-09days on market $165,000 Active 64 DOM
-
2026-06-08days on market $165,000 Active 63 DOM
-
2026-06-07days on market $165,000 Active 62 DOM
-
2026-06-04days on market $165,000 Active 59 DOM
-
2026-06-03days on market $165,000 Active 58 DOM
-
2026-06-02days on market $165,000 Active 57 DOM
-
2026-06-01days on market $165,000 Active 56 DOM
-
2026-05-31days on market $165,000 Active 55 DOM
-
2026-04-29price $170,000
-
2026-04-02$180,000 Active
ⓘ Source: listings_history table (triggers on properties + properties_extension) + one-shot
backfill from property_details.listing_events for pre-trigger history.
Climate risk First Street
- Flood 1/10 Low FEMA zone X (unshaded) · 0% chance over 30 yrs
- Wildfire 1/10 Low
- Heat 3/10 Moderate 7 d/yr ≥88°F today · 15 d/yr by 30 yrs out
- Wind 1/10 Low
- Air quality 7/10 Severe 10 unhealthy d/yr today · 11 by 30 yrs out
Nearby sold comps map
Loading sold comps map…
Walkable amenities ~0.75 mi
Loading nearby amenities…
Taxation est. · year 1
- Rental income
- $31,638
- − Mortgage interest
- −$9,243
- − Property taxes
- −$2,475
- − Insurance
- −$825
- − Repairs & maintenance
- −$2,531
- − Management
- −$2,531
- − Depreciation
- −$4,800
- Taxable income
- $9,233
- Est. tax owed @ 24.0%
- −$2,216
- After-tax cash flow
- $9,094/yr
For passive investors: Depreciation is non-cash, so a rental often shows a tax loss while cash-flowing — sheltering income. Rental losses are passive: they offset passive income freely, and up to $25,000/yr can offset ordinary (W-2) income if you actively participate and your MAGI is under $100k (phasing out to $0 by $150k); unused losses carry forward. On sale, claimed depreciation is recaptured at up to 25%, and gains may owe capital-gains tax (a 1031 exchange can defer both). Figures are a year-1 estimate at your 24.0% rate — not tax advice; consult a CPA.
Condition & rehab AI · 12 photos
This move-in ready home features a beautifully remodeled kitchen and bathrooms, with a good condition exterior and interior. It offers a good investment opportunity with potential for minor exterior and landscaping improvements.
Value-add opportunities
- Both Painting exterior siding — Enhances curb appeal and value.
- Both Landscaping improvements — Enhances curb appeal and value.
- Both Add a small shed or storage unit — Provides additional storage and enhances curb appeal.
Renovation cost estimate screening
Value-add ROI direction
- Both Painting exterior siding — Enhances curb appeal and value. ↑
- Both Landscaping improvements — Enhances curb appeal and value. ↑
- Both Add a small shed or storage unit — Provides additional storage and enhances curb appeal. ↑
ⓘ Cost ranges are severity-bucket heuristics (US national rule-of-thumb). Get contractor quotes + a written scope before underwriting a rehab budget.
Schools (NCES district)
- District
- Federal Way School District
- NCES district ID
- 5302820
- Math proficiency
- 35% ▬ 0.00%
- Reading proficiency
- 47% ▬ 0.00%
- Median HH income
- $61,594
- Composite
- 38.79/100
- National rank
- #8361
- State rank
- #207 of 291 in WA
Livability — Lakeland South
- Score
- 79/100
- State rank
- #113
- US rank
- #2299
Category grades
Schools grade is shown separately in the Schools card above.
Census & demographics
- Census place
- Lakeland South, WA
- County
- King County · 2,251,916 people
- Metro
- Seattle-Tacoma-Bellevue, WA
- Population (ZIP)
- 51,619
- Household income
- $75,319
- Rent vs Own
- Severe rent burden
- 2895.0
Population outlook (King County) Hauer SSP2
- Today (2025)
- 2,576,485 people
- By 2030
- 2,803,316 · +8.8%
- By 2040
- 3,255,921 · +26.4%
- By 2050
- 3,706,444 · +43.9%
- By 2075
- 4,746,063 · +84.2%
- By 2100
- 5,407,730 · +109.9%
Race, ethnicity, and origin ACS 2023
- Neighborhood character
- Highly diverse neighborhood (Simpson 0.79)
- Race & ethnicity
- White 32% Hispanic / Latino 23% Black 19% Two or more races 16% Asian 13% Pacific Islander 2%
- Hispanic origin (detail)
- Mexican 18%
- Common ancestry
- Portuguese 3% Lithuanian 2% Swedish 2%
- Foreign-born
- 32% · Canada, South Korea, Vietnam
- Languages at home
- 57% English-only · Spanish 18% Other Indo-European 3% Russian/Polish/Slavic 3%
Political lean MEDSL · King
- 2024 margin
- Solid D (+51.7) · D 74.2% · R 22.5% · Other 3.4%
- 2008→2024 swing
- +9.6pp toward D · 2008: 42.1pp · 2024: 51.7pp
- All cycles
- 2024: D+51.7 2020: D+52.7 2016: D+50.4 2012: D+39.9 2008: D+42.1
Not yet ingested
- Civics
- —
Market trends
- HPI YoY
- ▼ -623.87%
- Current HPI
- 327.5371
- Rent YoY
- ▲ 2.33%
- Metro
- Seattle-Tacoma-Bellevue, WA
- State GDP YoY
- ▲ 4.65%
- F500 in state
- 22
Industry mix (Fortune 500 HQ in WA)
| Industry | F500 HQs | Revenue |
|---|---|---|
| Retail | 2 | $269B |
|
||
| Technology / Retail | 1 | $638B |
|
||
| Technology | 1 | $245B |
|
||
| Telecommunications | 1 | $38B |
|
||
| Food / Beverage | 1 | $36B |
|
||
| Automotive / Trucks | 1 | $34B |
|
||
Price history
-5.6% since first listed2 events — show timeline
- 2026-04-29 Price Changed $170,000 NWMLS as Distributed by MLS Grid
- 2026-04-02 Listed $180,000 NWMLS as Distributed by MLS Grid
Cash-flow waterfall
monthlySold comps — $/sqft
last 12 mo · ≤1 miLoading sold comps…