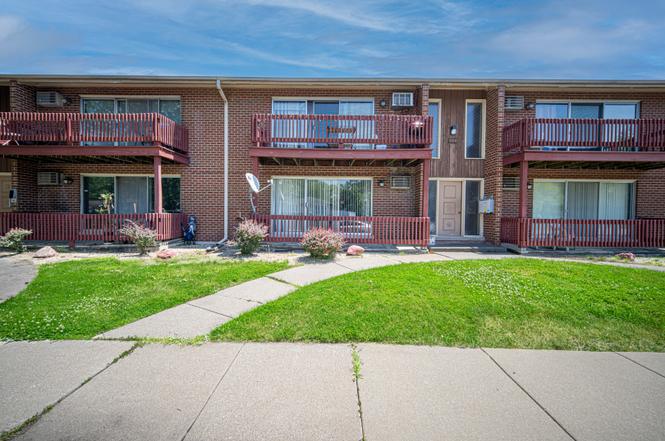
553 N Carroll Pkwy Unit 1D · Glenwood, IL
Flood risk 6/10 · Moderate
- FEMA flood zone
- X (unshaded)
- Chance of flooding over 30 yrs
- 0.71%
- Est. flood insurance / yr
- $507 – $1,088
Fire risk 1/10 · Minimal
- Est. fire insurance / yr
- $804 – $1,492
Heat risk 3/10 · Minor
- Hot days now (above 101°F)
- 7 days/yr
- Hot days in 30 yrs
- 15 days/yr
Wind risk 2/10 · Minimal
- Chance of severe wind over 30 yrs
- —
Air-quality risk 4/10 · Minor
- Unhealthy air days now
- 4 days/yr
- Unhealthy air days in 30 yrs
- 5 days/yr
Risk factors via First Street. Map © Google.
Why this score? — see what drove the C+ grade
The composite is a weighted blend of 9 inputs, each scored 0–100. Each bar is that input's sub-score; the figure is the points it added to the 100-point composite (weight × sub-score).
- Cash flow +26.8/30.0
- 1% rule +10.0/10.0
- DSCR +9.2/10.0
- ARV discount +7.5/15.0
- Livability +3.3/5.0
- Rent growth +2.5/5.0
- Condition / age +2.5/5.0
- Schools +2.4/10.0
- Appreciation +0.0/10.0
$120,000
🖨 Deal sheet 📄 Offer letter ✓ Due diligence
Listing remarks
Welcome home to this beautifully maintained 2 bedroom, 1 bathroom first-floor condo offering comfort, convenience, and security. The building features a locked main entrance, providing added peace of mind. Step inside to a spacious living room filled with natural light, creating a warm and inviting atmosphere. Sliding glass doors lead to your private front balcony, perfect for morning coffee or relaxing evenings. The kitchen is equipped with granite countertops and stainless steel appliances, offering both style and functionality for everyday living and entertaining. Additional highlights include new roof (2023), laundry and dedicated storage space in the basement, 2 parking spaces (1 assig
Key facts
- Locked main entrance
- Granite countertops
- New roof
Tags
Property features AI
Finance
- Other: Located in the Glenwood Manor subdivision with commuter and interstate access; Eight-unit building; Living area listed as estimated
- HOA & community: Monthly association fee of $290; Association fee includes heat, water, gas, parking, exterior maintenance, lawn care, and snow removal; Building amenities: coin laundry, storage, security door locks; Manager off-site; Pets allowed (cats and dogs)
Exterior
- Parking: Two parking spaces; Assigned and unassigned off-street parking
- Security: Security door locks in the building
- Utilities: Public water; Public sewer
- Home design: Attached single unit in a low-rise condo (1–3 stories); Entry level: 1; Condo ownership; Rehab completed in 2023
- Construction: Brick construction; Building age approximately 51–60 years; Built before 1978
- Exterior features: Common grounds
Interior
- Kitchen: Kitchen on the main level (16 x 10); Range; Microwave; Refrigerator
- Bedrooms: Master bedroom on the main level (15 x 11); Second bedroom on the main level (13 x 11); Two additional bedrooms listed (no dimensions provided)
- Flooring: Wood laminate flooring throughout main living areas and bedrooms
- Bathrooms: One full bathroom
- Heating & cooling: Steam heating; Wall-mounted air conditioning units
- Interior features: Five total rooms; Common area laundry with a utility sink
- Laundry & utility: Laundry in common area; Laundry sink
Neighborhood map
What this means for you Summary
Snapshot
- This is a 2-bed/1.0-bath condo listed at $120k.
Deal economics
- At list price, monthly cash flow is $329 ($4k/yr) — positive.
- The deal already cash-flows at list — no discount required.
- Meets the 1% rule at list price ($2k rent vs $120k).
- Recommended offer: $109k (9.0% below list) — sets the bar for market timing.
Location & tenants
- Location reads 66/100 on livability (#545 in IL) — a middle-class / working-renter tenant base. Strengths: cost of living A+, housing A+, employment B; Watch: health & safety D+, amenities F, commute F.
- Homewood Flossmoor Chsd 233 (suburban): math 21% / reading 27% proficiency, ranked #272 of 620 in IL (top 44%) — low school quality limits family demand, transient renter base, plan for 1-2y turnover.
- Zoned schools: Homewood-Flossmoor High School (math 21% / reading 27%, grade F, #304 of 693 statewide, top 44%, 2,798 students, 0% FRL).
- Market conditions: 53 active listings in the ZIP; 2 comparable units currently listed for rent nearby; 6,272 units permitted in Cook County in 2024 (4,658 in 5+ unit buildings).
Forward outlook
- Local home prices are declining (-3.0%/yr); year-one equity from $830 of loan paydown is wiped out by about $4k of value loss. Plan a longer hold.
- At projected returns (-3.0% appreciation + 3.0% rent growth), your $34k cash investment doubles in ~10 years — after that, you're playing with house money.
Negotiation context
- It's been on market 115 days — a 9% lower offer ($109k) is reasonable based on typical stale-listing flexibility.
- 4 sale attempts since 12y ago with the ask held roughly flat each time — persistent listings suggest the price (not the market) is what's stuck; bring a comps-based counter.
- Current owner paid $20k; list at $120k implies a 500% gain — meaningful room to come down on a strong offer.
Risks & watch-outs
- Watch-outs: property tax is 2.9% of price.
- Climate carrying-cost: major flood risk — expect insurance premiums to compound above CPI over the hold.
Questions for the listing agent
- It's been on market 115 days. Have you received any prior offers? Is the seller open to a 9% concession, seller financing, or rate buy-down credit?
- Built in 1975 — when were the roof, HVAC, electrical panel, plumbing, and water heater last replaced?
- Property tax is high relative to price — has the assessment been appealed recently, and will the sale trigger a re-assessment?
- What does the HOA fee cover, when was the last increase, and are there any pending special assessments or reserve-fund shortfalls?
- Any open or pending special assessments — roof, HVAC, plumbing, elevator, façade? What's the per-unit balance and payoff schedule, and is the seller paying it off at close or rolling it to the buyer?
- Why hasn't it sold? Are there any deal-killer items the seller is aware of (foundation, flood, title, zoning, code violations)?
- Is there a deadline driving the sale (1031 exchange, divorce, estate, relocation)? That informs how much negotiation room exists.
- Schools are F-rated, which usually means shorter tenancies and higher turnover. Who's the typical renter profile here, and what's been the actual vacancy rate?
- What's the average days-on-market for RENTAL listings here right now (not sales)? A rising rental-DOM trend means longer vacancies and softer asking-rent achievability than the comps imply.
- What's the recent tenant-quality profile in this submarket — average credit score on applications, eviction rate, late-payment / NSF rate, and stable-employment percentage? A property-management company in the area should have these aggregated.
- How much new apartment / multifamily construction is in the pipeline within 1–3 miles? Heavy new supply (>2% of stock underway) typically softens rents 12–24 months out; light construction supports rent growth.
Investment metrics
- 1% rule
- 1.68% ✓
- Cap rate
- 9.58%
- Cash-on-cash
- 11.76%
- DSCR
- 1.52
- GRM
- 5.0
CMA / ARV
No comps found within radius.
Projected returns pro-forma
-3.0% appreciation · 3.0% rent growth · sell at horizon
- IRR
- 1.4%
- Equity multiple
- 1.05×
- Total profit
- $1,818
- Equity at exit
- $17,892
- IRR
- 11.2%
- Equity multiple
- 1.89×
- Total profit
- $29,788
- Equity at exit
- $10,375
Cash invested: $33,600 (down + closing). Projections, not guarantees.
Landlord ↔ Tenant lean methodology
- Overall (STATE)
- 43 Moderately Tenant-Leaning
- State Illinois
- 43 Moderately Tenant-Leaning · D+7
- County
- — inherits STATE
- City
- — inherits STATE
ZIP-level market 60425
- Home prices YoY
- -10.6%
- Active inventory
- 53
- Price-to-rent
- 5.0×
Monthly cashflow live
- Estimated rent
- $2,015 medium interval (Pro) →
- Mortgage (P&I)
- −$629
- Tax from tax record
- −$294 /mo · $3,525/yr
- Insurance
- −$50
- HOA
- −$290
- Vacancy / Maint / Mgmt
- −$423
- Net cashflow
- $329
Break-even live
UW: 25.0% down · 7.5% · 30yr · 1.5% tax · 5.0% vac · 8.0% maint · 8.0% mgmt
Financing live
Cash to close
- Down payment
- $30,000
- Closing costs
- $3,600
- Reserves months
- —
- Total cash needed
- —
Loan-product check · same deal, 3 products live
Conventional
25% down · 7.5% · 30yr
- Down + closing
- —
- Monthly P&I
- —
- Monthly cashflow
- —
- DSCR
- —
- Eligible?
- —
Personal DTI + credit; lowest rate.
DSCR
20% down · 8.5% · 30yr
- Down + closing
- —
- Monthly P&I
- —
- Monthly cashflow
- —
- DSCR
- —
- Eligible?
- —
No personal income docs; deal must DSCR.
Hard money
10% down · 12.0% · 12mo
- Down + closing
- —
- Monthly P&I
- —
- Monthly cashflow
- —
- DSCR
- —
- Eligible?
- —
Short-term bridge; refi at stabilization.
Rent comps 2 comps
| Address | Beds | Baths | Sqft | Rent | $/sqft | DOM | Units | Dist |
|---|---|---|---|---|---|---|---|---|
| 44 N Glenwood Ave Glenwood, IL | 1.0 | 1.0 | 700 | $1,900 | $2.71 | 1d | 1 | 0.81mi |
| 208 Blackstone St Thornton, IL | 2.0 | 1.5 | 923 | $2,200 | $2.38 | 1d | 1 | 1.29mi |
HOA detail condo
- Monthly dues
- $290 · $3,480/yr
- Likely covers
- security
- Assessments
- None detected in remarks — confirm with the listing agent.
Listing history 24 events
-
2026-06-18days on market $120,000 Active 115 DOM
-
2026-06-17days on market $120,000 Active 114 DOM
-
2026-06-16days on market $120,000 Active 113 DOM
-
2026-06-15days on market $120,000 Active 112 DOM
-
2026-06-13days on market $120,000 Active 110 DOM
-
2026-06-09days on market $120,000 Active 106 DOM
-
2026-06-08days on market $120,000 Active 105 DOM
-
2026-06-07days on market $120,000 Active 104 DOM
-
2026-06-04days on market $120,000 Active 101 DOM
-
2026-06-03days on market $120,000 Active 100 DOM
-
2026-06-02days on market $120,000 Active 99 DOM
-
2026-06-01days on market $120,000 Active 98 DOM
-
2026-05-31days on market $120,000 Active 97 DOM
-
2026-02-23$120,000 Active
-
2025-11-01historical
-
2025-05-01Active
-
2024-12-13historical
-
2024-06-14Active
-
2014-11-12soldstatus $20,000 Closed Sale
-
2014-10-31status Pending
-
2014-10-17$20,900 New
-
2002-07-02soldstatus $59,000
-
1999-10-26soldstatus $50,000
-
1994-06-01soldstatus $50,000
ⓘ Source: listings_history table (triggers on properties + properties_extension) + one-shot
backfill from property_details.listing_events for pre-trigger history.
Tax reassessment forecast IL · Partial reset (capped growth)
- Current annual tax
- $3,525 · $294/mo
- Projected year-2 tax
- $3,525 · $294/mo
- Expected delta
- $0/yr ($0/mo · 0.0%)
ⓘ Screening estimate from a state-policy table — verify with the county assessor before closing.
Climate risk First Street
- Flood 6/10 Major FEMA zone X (unshaded) · 71% chance over 30 yrs
- Wildfire 1/10 Low
- Heat 3/10 Moderate 7 d/yr ≥101°F today · 15 d/yr by 30 yrs out
- Wind 2/10 Low
- Air quality 4/10 Moderate 4 unhealthy d/yr today · 5 by 30 yrs out
Nearby sold comps map
Loading sold comps map…
Walkable amenities ~0.75 mi
Loading nearby amenities…
Taxation est. · year 1
- Rental income
- $24,185
- − Mortgage interest
- −$6,722
- − Property taxes
- −$3,525
- − Insurance
- −$600
- − Repairs & maintenance
- −$1,935
- − Management
- −$1,935
- − HOA
- −$3,480
- − Depreciation
- −$3,491
- Taxable income
- $2,498
- Est. tax owed @ 24.0%
- −$600
- After-tax cash flow
- $3,351/yr
For passive investors: Depreciation is non-cash, so a rental often shows a tax loss while cash-flowing — sheltering income. Rental losses are passive: they offset passive income freely, and up to $25,000/yr can offset ordinary (W-2) income if you actively participate and your MAGI is under $100k (phasing out to $0 by $150k); unused losses carry forward. On sale, claimed depreciation is recaptured at up to 25%, and gains may owe capital-gains tax (a 1031 exchange can defer both). Figures are a year-1 estimate at your 24.0% rate — not tax advice; consult a CPA.
Schools (NCES district)
- District
- Homewood Flossmoor Chsd 233
- NCES district ID
- 1719560
- Math proficiency
- 21% ▼ -15.00%
- Reading proficiency
- 27% ▼ -13.00%
- Median HH income
- $83,564
- Composite
- 24.42/100
- National rank
- #7681
- State rank
- #272 of 620 in IL
Livability — Glenwood
- Score
- 66/100
- State rank
- #545
- US rank
- #11292
Category grades
Schools grade is shown separately in the Schools card above.
Census & demographics
- Census place
- Glenwood, IL
- City population
- 8,730
- Population (ZIP)
- 8,730
Population outlook (Cook County) Hauer SSP2
- Today (2025)
- 5,347,519 people
- By 2030
- 5,357,703 · +0.2%
- By 2040
- 5,324,924 · -0.4%
- By 2050
- 5,230,762 · -2.2%
- By 2075
- 4,785,735 · -10.5%
- By 2100
- 4,188,836 · -21.7%
Race, ethnicity, and origin ACS 2023
- Neighborhood character
- Predominantly Black (68%)
- Race & ethnicity
- Black 68% White 22% Hispanic / Latino 6% Two or more races 4%
- Hispanic origin (detail)
- Mexican 5%
- Common ancestry
- Romanian 3% Iranian 1% Lithuanian 1%
- Foreign-born
- 3% · Canada
- Languages at home
- 95% English-only · Spanish 4%
Political lean MEDSL · Cook
- 2024 margin
- Solid D (+42.0) · D 70.4% · R 28.4% · Other 1.2%
- 2008→2024 swing
- -11.4pp toward R · 2008: 53.4pp · 2024: 42.0pp
- All cycles
- 2024: D+42.0 2020: D+50.3 2016: D+53.0 2012: D+49.4 2008: D+53.4
Not yet ingested
- Civics
- —
Market trends
- HPI YoY
- ▼ -37.24%
- Current HPI
- 314.1777
- Rent YoY
- —
- Metro
- —
- State GDP YoY
- ▲ 1.59%
- F500 in state
- 60
Industry mix (Fortune 500 HQ in IL)
| Industry | F500 HQs | Revenue |
|---|---|---|
| Insurance | 4 | $201B |
|
||
| Consumer Goods | 4 | $87B |
|
||
| Industrial Machinery | 3 | $64B |
|
||
| Healthcare | 2 | $55B |
|
||
| Retail / Pharmacy | 1 | $148B |
|
||
| Agriculture / Food | 1 | $86B |
|
||
Price history
+140.0% since first listed11 events — show timeline
- 2026-02-23 Listed $120,000 MRED as Distributed by MLS Grid
- 2025-11-01 Listing Removed — MRED as Distributed by MLS Grid
- 2025-05-01 Listed — MRED as Distributed by MLS Grid
- 2024-12-13 Listing Removed — MRED as Distributed by MLS Grid
- 2024-06-14 Listed — MRED as Distributed by MLS Grid
- 2014-11-12 Sold (MLS) $20,000 MRED as Distributed by MLS Grid
- 2014-10-31 Pending — MRED as Distributed by MLS Grid
- 2014-10-17 Listed $20,900 MRED as Distributed by MLS Grid
- 2002-07-02 Sold (Public Records) $59,000 Public Records
- 1999-10-26 Sold (Public Records) $50,000 Public Records
- 1994-06-01 Sold (Public Records) $50,000 Public Records
Property tax history
+5.8%/yrLatest (2023): $3,525 · +69.0% YoY. Source: county tax records.
Cash-flow waterfall
monthlySold comps — $/sqft
last 12 mo · ≤1 miLoading sold comps…