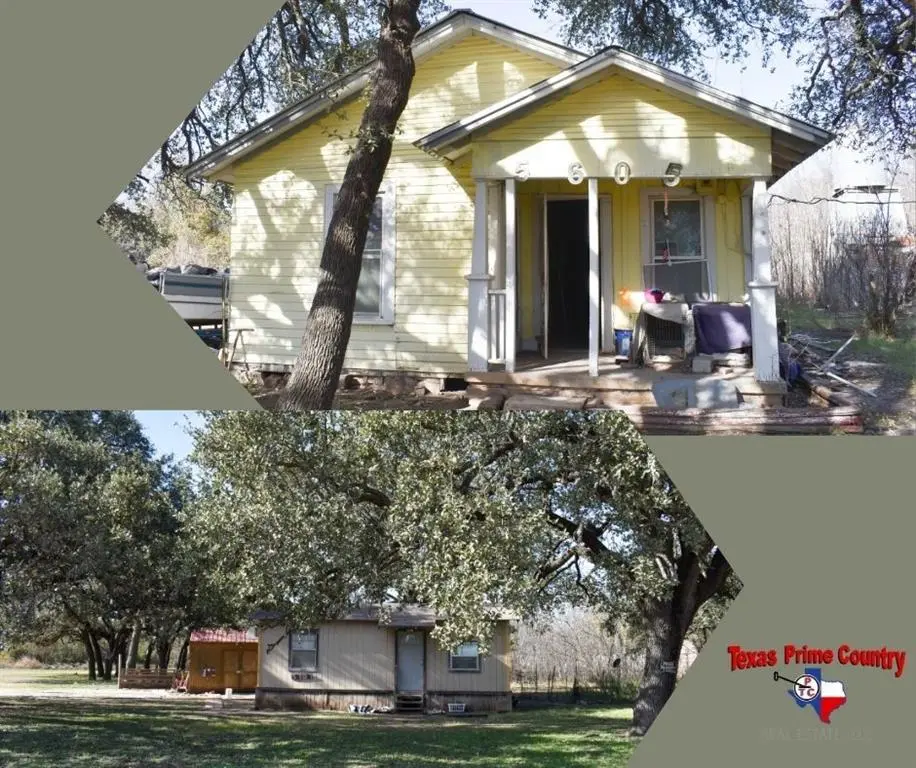
5605 Front St · Rochelle, TX
Flood risk 3/10 · Minor
- FEMA flood zone
- —
- Chance of flooding over 30 yrs
- 0.2%
- Est. flood insurance / yr
- —
Fire risk 5/10 · Moderate
- Est. fire insurance / yr
- $1,222 – $2,270
Heat risk 6/10 · Moderate
- Hot days now (above 105°F)
- 6 days/yr
- Hot days in 30 yrs
- 20 days/yr
Wind risk 6/10 · Moderate
- Chance of severe wind over 30 yrs
- 27.0%
Air-quality risk 1/10 · Minimal
- Unhealthy air days now
- 0 days/yr
- Unhealthy air days in 30 yrs
- 0 days/yr
Risk factors via First Street. Map © Google.
Why this score? — see what drove the C+ grade
The composite is a weighted blend of 9 inputs, each scored 0–100. Each bar is that input's sub-score; the figure is the points it added to the 100-point composite (weight × sub-score).
- Cash flow +20.6/30.0
- ARV discount +15.0/15.0
- DSCR +6.5/10.0
- 1% rule +5.1/10.0
- Appreciation +5.0/10.0
- Schools +4.1/10.0
- Rent growth +2.5/5.0
- Livability +2.5/5.0
- Condition / age +2.5/5.0
$85,000
🖨 Deal sheet 📄 Offer letter ✓ Due diligence
Listing remarks MLS
Opportunity awaits with this unique residential property spanning 10 lots, offering space, and future potential. Features two existing homes, the older 2bedroom, 1bath home is ready for TLC and perfect for buyers looking to renovate. There is an additional 1 bedroom, 1bath cabin providing current living quarters or a future guest house. Call today to schedule your showing!
Key facts
- 1 bedroom cabin
- Two existing homes
- 0.72 acre lot
Tags
Neighborhood map
What this means for you Summary
Snapshot
- This is a 2-bed/1.0-bath single-family listed at $85k.
Deal economics
- At list price, monthly cash flow is $113 ($1k/yr) — positive.
- The deal already cash-flows at list — no discount required.
- Meets the 1% rule at list price ($861 rent vs $85k).
- Recommended offer: $75k (12.0% below list) — sets the bar for market timing.
Location & tenants
- Location reads: area grade C — affects rentability + tenant quality, not the cash-flow math above.
- Rochelle ISD (rural): math 50% / reading 40% proficiency, ranked #503 of 1,141 in TX (top 44%) — families likely to look elsewhere, expect single-tenant / working-renter base with shorter leases.
- Market conditions: 35 active listings in the ZIP; 2 units permitted in McCulloch County in 2024 (0 in 5+ unit buildings).
Forward outlook
- In year one you build about $3k of equity ($588 loan paydown + $3k appreciation (3.0% local appreciation)).
- At projected returns (3.0% appreciation + 3.0% rent growth), your $24k cash investment doubles in ~5 years — after that, you're playing with house money.
- By year 10, paydown + projected appreciation supports a ~$30k cash-out refi (75% LTV) — recoverable capital for the next deal without selling this one.
Negotiation context
- It's been on market 181 days — a 12% lower offer ($75k) is reasonable based on typical stale-listing flexibility.
Risks & watch-outs
- Watch-outs: built in 1920 — expect roof / HVAC / electrical / plumbing capex.
- Climate carrying-cost: major wind risk, 27% chance of damaging wind over 30y; moderate wildfire risk; extreme-heat days projected 6→20/yr by 2055 (HVAC capex compounding) — expect insurance premiums to compound above CPI over the hold.
Questions for the listing agent
- It's been on market 181 days. Have you received any prior offers? Is the seller open to a 12% concession, seller financing, or rate buy-down credit?
- Built in 1920 — when were the roof, HVAC, electrical panel, plumbing, and water heater last replaced?
- Why hasn't it sold? Are there any deal-killer items the seller is aware of (foundation, flood, title, zoning, code violations)?
- Is there a deadline driving the sale (1031 exchange, divorce, estate, relocation)? That informs how much negotiation room exists.
- What's the average days-on-market for RENTAL listings here right now (not sales)? A rising rental-DOM trend means longer vacancies and softer asking-rent achievability than the comps imply.
- What's the recent tenant-quality profile in this submarket — average credit score on applications, eviction rate, late-payment / NSF rate, and stable-employment percentage? A property-management company in the area should have these aggregated.
- How much new for-sale + rental construction is in the pipeline within 1–3 miles? Heavy new supply typically softens prices + rents 12–24 months out; constrained supply supports both.
Investment metrics
- 1% rule
- 1.01% ✓
- Cap rate
- 7.89%
- Cash-on-cash
- 5.70%
- DSCR
- 1.25
- GRM
- 8.2
CMA / ARV
- ARV (median comp)
- $131,248
- List price
- $85,000
- Delta
- -35.24%
- Verdict
- UNDERPRICED
- Comps
- 1 within 2.0 mi
Projected returns pro-forma
3.0% appreciation · 3.0% rent growth · sell at horizon
- IRR
- 12.8%
- Equity multiple
- 1.73×
- Total profit
- $17,438
- Equity at exit
- $38,220
- IRR
- 14.8%
- Equity multiple
- 3.19×
- Total profit
- $52,005
- Equity at exit
- $58,901
Cash invested: $23,800 (down + closing). Projections, not guarantees.
Landlord ↔ Tenant lean methodology
- Overall (STATE)
- 87 Strongly Landlord-Friendly
- State Texas
- 87 Strongly Landlord-Friendly · R+5
- County
- — inherits STATE
- City
- — inherits STATE
ZIP-level market 76872
- Active inventory
- 35
- Price-to-rent
- 8.2×
Monthly cashflow live
- Estimated rent
- $861 medium interval (Pro) →
- Mortgage (P&I)
- −$446
- Tax from tax record
- −$86 /mo · $1,037/yr
- Insurance
- −$35
- HOA
- −$0
- Vacancy / Maint / Mgmt
- −$181
- Net cashflow
- $113
Break-even live
UW: 25.0% down · 7.5% · 30yr · 1.5% tax · 5.0% vac · 8.0% maint · 8.0% mgmt
Financing live
Cash to close
- Down payment
- $21,250
- Closing costs
- $2,550
- Reserves months
- —
- Total cash needed
- —
Loan-product check · same deal, 3 products live
Conventional
25% down · 7.5% · 30yr
- Down + closing
- —
- Monthly P&I
- —
- Monthly cashflow
- —
- DSCR
- —
- Eligible?
- —
Personal DTI + credit; lowest rate.
DSCR
20% down · 8.5% · 30yr
- Down + closing
- —
- Monthly P&I
- —
- Monthly cashflow
- —
- DSCR
- —
- Eligible?
- —
No personal income docs; deal must DSCR.
Hard money
10% down · 12.0% · 12mo
- Down + closing
- —
- Monthly P&I
- —
- Monthly cashflow
- —
- DSCR
- —
- Eligible?
- —
Short-term bridge; refi at stabilization.
Listing history 19 events
-
2026-06-18days on market $85,000 Active 181 DOM
-
2026-06-17days on market $85,000 Active 180 DOM
-
2026-06-16days on market $85,000 Active 179 DOM
-
2026-06-15days on market $85,000 Active 178 DOM
-
2026-06-15days on market $85,000 Active 177 DOM
-
2026-06-13days on market $85,000 Active 176 DOM
-
2026-06-12days on market $85,000 Active 175 DOM
-
2026-06-09days on market $85,000 Active 172 DOM
-
2026-06-08days on market $85,000 Active 171 DOM
-
2026-06-08days on market $85,000 Active 170 DOM
-
2026-06-05days on market $85,000 Active 168 DOM
-
2026-06-04price $85,000 Active 166 DOM
-
2026-06-03days on market $95,000 Active 166 DOM
-
2026-06-02days on market $95,000 Active 165 DOM
-
2026-06-01days on market $95,000 Active 164 DOM
-
2026-05-31days on market $95,000 Active 163 DOM
-
2025-12-08$95,000 Active 375-char remark
Show marketing remark (375 chars)
Opportunity awaits with this unique residential property spanning 10 lots, offering space, and future potential. Features two existing homes, the older 2bedroom, 1bath home is ready for TLC and perfect for buyers looking to renovate. There is an additional 1 bedroom, 1bath cabin providing current living quarters or a future guest house. Call today to schedule your showing!
-
2007-02-12soldstatus
-
1990-06-13soldstatus
ⓘ Source: listings_history table (triggers on properties + properties_extension) + one-shot
backfill from property_details.listing_events for pre-trigger history.
Tax reassessment forecast TX · Resets to sale price
- Current annual tax
- $1,037 · $86/mo
- Projected year-2 tax
- $1,556 · $130/mo
- Expected delta
- +$519/yr (+$43/mo · 50.1%)
ⓘ Screening estimate from a state-policy table — verify with the county assessor before closing.
Climate risk First Street
- Flood 3/10 Moderate 20% chance over 30 yrs
- Wildfire 5/10 Major
- Heat 6/10 Major 6 d/yr ≥105°F today · 20 d/yr by 30 yrs out
- Wind 6/10 Major 27% chance of damaging wind over 30 yrs
- Air quality 1/10 Low 0 unhealthy d/yr today · 0 by 30 yrs out
Nearby sold comps map
Loading sold comps map…
Walkable amenities ~0.75 mi
Loading nearby amenities…
Taxation est. · year 1
- Rental income
- $10,338
- − Mortgage interest
- −$4,761
- − Property taxes
- −$1,037
- − Insurance
- −$425
- − Repairs & maintenance
- −$827
- − Management
- −$827
- − Depreciation
- −$2,473
- Taxable loss
- −$12
- Est. tax savings @ 24.0%
- +$3
- After-tax cash flow
- $1,359/yr
For passive investors: Depreciation is non-cash, so a rental often shows a tax loss while cash-flowing — sheltering income. Rental losses are passive: they offset passive income freely, and up to $25,000/yr can offset ordinary (W-2) income if you actively participate and your MAGI is under $100k (phasing out to $0 by $150k); unused losses carry forward. On sale, claimed depreciation is recaptured at up to 25%, and gains may owe capital-gains tax (a 1031 exchange can defer both). Figures are a year-1 estimate at your 24.0% rate — not tax advice; consult a CPA.
Schools (NCES district)
- District
- Rochelle ISD
- NCES district ID
- 4837500
- Math proficiency
- 50% ▬ 0.00%
- Reading proficiency
- 40% ▲ 5.00%
- Median HH income
- $55,376
- Composite
- 41.4/100
- National rank
- #7318
- State rank
- #503 of 1141 in TX
Livability — Rochelle
No livability data for this city. (Only ~50 U.S. cities are tracked.)
Census & demographics
- Census place
- Rochelle, TX
- Population (ZIP)
- 662
Population outlook (McCulloch County) Hauer SSP2
- Today (2025)
- 8,509 people
- By 2030
- 8,544 · +0.4%
- By 2040
- 8,555 · +0.5%
- By 2050
- 8,486 · -0.3%
- By 2075
- 8,089 · -4.9%
- By 2100
- 6,599 · -22.4%
Race, ethnicity, and origin ACS 2023
- Neighborhood character
- Predominantly White (90%)
- Race & ethnicity
- White 90% Hispanic / Latino 7% Two or more races 6% Asian 1%
- Hispanic origin (detail)
- Mexican 7%
- Common ancestry
- Romanian 8% Italian 5% Slovak 1%
- Foreign-born
- 1% · Vietnam
- Languages at home
- 94% English-only · Spanish 4% Vietnamese 1% Russian/Polish/Slavic 1%
Political lean MEDSL · McCulloch
- 2024 margin
- Solid R (+73.4) · D 12.9% · R 86.3%
- 2008→2024 swing
- -22.4pp toward R · 2008: -51.0pp · 2024: -73.4pp
- All cycles
- 2024: R+73.4 2020: R+70.3 2016: R+67.0 2012: R+62.9 2008: R+51.0
Not yet ingested
- Civics
- —
Market trends
- HPI YoY
- —
- Current HPI
- —
- Rent YoY
- —
- Metro
- —
- State GDP YoY
- ▲ 3.95%
- F500 in state
- 110
Industry mix (Fortune 500 HQ in TX)
| Industry | F500 HQs | Revenue |
|---|---|---|
| Energy | 16 | $1,198B |
|
||
| Technology | 5 | $198B |
|
||
| Engineering / Construction | 4 | $72B |
|
||
| Energy Services | 3 | $60B |
|
||
| Utilities | 3 | $41B |
|
||
| Healthcare | 2 | $330B |
|
||
Price history
3 events — show timeline
- 2025-12-08 Listed $95,000 NTREIS
- 2007-02-12 Sold (Public Records) — Public Records
- 1990-06-13 Sold (Public Records) — Public Records
Property tax history
+15.0%/yrLatest (2025): $1,037 · -1.2% YoY. Source: county tax records.
Cash-flow waterfall
monthlySold comps — $/sqft
last 12 mo · ≤1 miLoading sold comps…