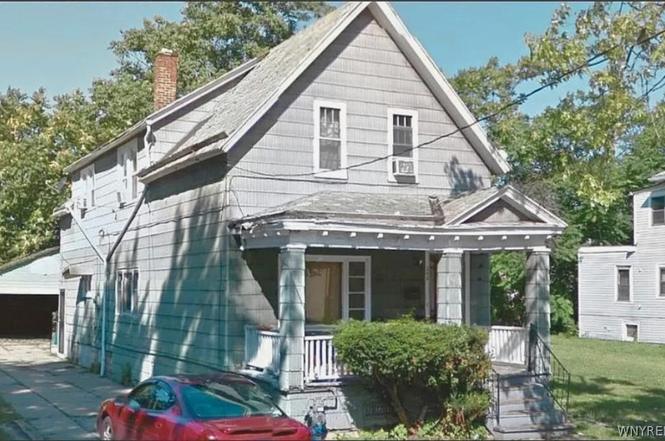
246 Carl St · Buffalo, NY
Flood risk 1/10 · Minimal
- FEMA flood zone
- X (unshaded)
- Chance of flooding over 30 yrs
- 0.0%
- Est. flood insurance / yr
- $473 – $860
Fire risk 1/10 · Minimal
- Est. fire insurance / yr
- $691 – $1,283
Heat risk 2/10 · Minimal
- Hot days now (above 93°F)
- 7 days/yr
- Hot days in 30 yrs
- 14 days/yr
Wind risk 1/10 · Minimal
- Chance of severe wind over 30 yrs
- —
Air-quality risk 3/10 · Minor
- Unhealthy air days now
- 2 days/yr
- Unhealthy air days in 30 yrs
- 3 days/yr
Risk factors via First Street. Map © Google.
Why this score? — see what drove the B grade
The composite is a weighted blend of 9 inputs, each scored 0–100. Each bar is that input's sub-score; the figure is the points it added to the 100-point composite (weight × sub-score).
- Cash flow +28.3/30.0
- ARV discount +15.0/15.0
- DSCR +10.0/10.0
- 1% rule +7.8/10.0
- Livability +3.9/5.0
- Schools +3.3/10.0
- Rent growth +2.7/5.0
- Condition / age +2.5/5.0
- Appreciation +0.0/10.0
$124,900
🖨 Deal sheet (PDF) 📄 Offer letter ✓ Due diligence
Listing remarks
Welcome to 246 Carl St, Buffalo, NY 14215! This spacious home offers a flexible layout perfect for comfortable everyday living. Featuring 3 generously sized bedrooms, 1 full bathroom, and additional bonus rooms, this property provides plenty of space for a home office, guest room, playroom, or extra storage. The home features a bright and inviting living room, a formal dining area ideal for gatherings, and a large kitchen with ample cabinet and counter space. Natural light fills the home, creating a warm and welcoming atmosphere throughout. The functional floor plan offers both comfort and versatility for a variety of living needs. Additional highlights include a full basement with laundry
Key facts
- Flexible layout
- Bonus rooms
- Large kitchen
Tags
Property features AI
Exterior
- Parking: No garage; Shared driveway
- Utilities: Public water connected; Sewer connected
- Home design: Single-story property; Existing construction (resale)
- Construction: Construction details: see remarks
- Exterior features: Exterior details: see remarks; Rectangular lot (30 x 140)
Interior
- Bathrooms: 1 full bathroom
- Heating & cooling: Heating details: see remarks
- Interior features: Other features (see remarks); Full basement
- Laundry & utility: Laundry located in basement; Electric water heater; Gas water heater
Neighborhood map
What this means for you Summary
Snapshot
- This is a 3-bed/1.0-bath single-family listed at $125k.
Deal economics
- At list price, monthly cash flow is $400 ($5k/yr) — positive.
- The deal already cash-flows at list — no discount required.
- Meets the 1% rule at list price ($2k rent vs $125k).
- Cap rate 10.1% vs local median 8.0% in Buffalo — meaningfully above typical; check what's discounted (condition, days-on-market, listing class) to confirm the premium yield is real.
Location & tenants
- Location reads 77/100 on livability (#195 in NY, #3,011 nationally) — a middle-class / working-renter tenant base. Strengths: commute A+, housing A+, health & safety A+; Watch: crime F, employment D-.
- Buffalo City School District (urban): math 41% / reading 40% proficiency, ranked #535 of 590 in NY (top 91%) — families likely to look elsewhere, expect single-tenant / working-renter base with shorter leases; 75% free/reduced lunch — lower-income household profile, screen leases tightly.
- Zoned schools: International School (math 8% / reading 17%, grade F, #2,048 of 2,108 statewide, top 97%, 981 students, 92% FRL); Hutchinson Central Technical High School (math 96% / reading 32%, grade B-, #807 of 1,100 statewide, top 73%, 1,175 students, 78% FRL).
- Market conditions: Rents flat; 239 active listings in the ZIP; 19 comparable units currently listed for rent nearby; rentals at typical pace (median 25d on market — plan ~3-4 weeks tenant-placement turnaround); lower-income renter base — watch delinquency; 1,244 units permitted in Erie County in 2024 (563 in 5+ unit buildings).
- This rent runs 43% of the median local income ($45k/yr) — at the standard rent-burdened threshold; future hikes will face affordability resistance.
Forward outlook
- Local home prices are declining (-3.0%/yr); year-one equity from $864 of loan paydown is wiped out by about $4k of value loss. Plan a longer hold.
Negotiation context
- Only 10 days on market — expect competitive offers; lowballing is unlikely to land.
- 6 sale attempts with the ask held roughly flat each time — persistent listings suggest the price (not the market) is what's stuck; bring a comps-based counter.
- Current owner paid $52k; list at $125k implies a 140% gain — meaningful room to come down on a strong offer.
Risks & watch-outs
- Watch-outs: built in 1910 — expect roof / HVAC / electrical / plumbing capex.
Questions for the listing agent
- Built in 1910 — when were the roof, HVAC, electrical panel, plumbing, and water heater last replaced?
- Is there a deadline driving the sale (1031 exchange, divorce, estate, relocation)? That informs how much negotiation room exists.
- Crime grade is F in this area — have there been break-ins, vandalism, or insurance claims at this property in the last 3 years? What carrier currently insures it and at what premium?
- What's the average days-on-market for RENTAL listings here right now (not sales)? A rising rental-DOM trend means longer vacancies and softer asking-rent achievability than the comps imply.
- What's the recent tenant-quality profile in this submarket — average credit score on applications, eviction rate, late-payment / NSF rate, and stable-employment percentage? A property-management company in the area should have these aggregated.
- How much new for-sale + rental construction is in the pipeline within 1–3 miles? Heavy new supply typically softens prices + rents 12–24 months out; constrained supply supports both.
Investment metrics
- 1% rule
- 1.28% ✓
- Cap rate
- 10.14%
- Cash-on-cash
- 13.73%
- DSCR
- 1.61
- GRM
- 6.5
CMA / ARV
- ARV (on-the-fly)
- $188,370
- Comps found
- 12
Show comp detail 12 sales within ~0.75 mi
| Address | Dist | Beds/Ba | Sqft | Sold | Price | $/sf | Match |
|---|---|---|---|---|---|---|---|
| 127 Durham Ave | 0.31mi | 3/1.0 | 1,550 (-5%) | 1mo | $216,000 | $139 | 76 |
| 316 Wyoming Ave | 0.22mi | 3/1.0 | 1,474 (-10%) | 8mo | $148,000 | $100 | 66 |
| 323 Grider St | 0.15mi | 4/2.0 (+1) | 1,418 (-13%) | 1mo | $128,000 | $90 | 61 |
| 92 Fernhill Ave | 0.49mi | 3/1.0 | 1,494 (-9%) | 13mo | $215,000 | $144 | 52 |
| 368 Northumberland Ave | 0.43mi | 3/1.0 | 1,420 (-13%) | 8mo | $125,000 | $88 | 51 |
| 48 Sussex St | 0.42mi | 4/1.5 (+1) | 1,567 (-4%) | 20mo | $180,000 | $115 | 50 |
| 51 Sussex St | 0.40mi | 4/2.0 (+1) | 1,465 (-11%) | 7mo | $251,000 | $171 | 49 |
| 986 E Ferry St | 0.46mi | 2/1.0 (-1) | 1,518 (-7%) | 17mo | $106,000 | $70 | 47 |
| 351 Cambridge Ave | 0.34mi | 4/2.0 (+1) | 1,443 (-12%) | 11mo | $220,000 | $152 | 46 |
| 877 Woodlawn Ave | 0.57mi | 4/1.5 (+1) | 1,516 (-7%) | 12mo | $210,000 | $139 | 44 |
| 624 Kensington Ave | 0.72mi | 4/1.5 (+1) | 1,742 (+6%) | 8mo | $95,000 | $55 | 42 |
| 466 Northland Ave | 0.73mi | 3/1.0 | 1,814 (+11%) | 19mo | $200,000 | $110 | 32 |
Match score weights: distance 35% · size 25% · config 20% · recency 20%. Top-matched comps best support the ARV.
Projected returns pro-forma
-3.0% appreciation · 0.67% rent growth · sell at horizon
- IRR
- 1.2%
- Equity multiple
- 1.05×
- Total profit
- $1,614
- Equity at exit
- $18,623
- IRR
- 8.4%
- Equity multiple
- 1.57×
- Total profit
- $19,980
- Equity at exit
- $10,799
Cash invested: $34,972 (down + closing). Projections, not guarantees.
Landlord ↔ Tenant lean methodology
- Overall (STATE)
- 15 Strongly Tenant-Friendly
- State New York
- 15 Strongly Tenant-Friendly · D+10
- County
- — inherits STATE
- City
- — inherits STATE
ZIP-level market 14215
- Home prices YoY
- -30.0%
- Rents YoY
- 0.7%
- Active inventory
- 239
- Price-to-rent
- 6.5×
Monthly cashflow live
- Estimated rent
- $1,599 high interval (Pro) →
- Mortgage (P&I)
- −$655
- Tax est. 1.5%
- −$156 /mo · $1,874/yr
- Insurance
- −$52
- HOA
- −$0
- Vacancy / Maint / Mgmt
- −$336
- Net cashflow
- $400
Break-even live
Sensitivity live
| Price | -10% $487 | -5% $443 | +0% $400 | +5% $357 | +10% $314 |
|---|---|---|---|---|---|
| Rent | -10% $274 | -5% $337 | +0% $400 | +5% $463 | +10% $527 |
| Rate | -1.0pp $463 | -0.5pp $432 | base $400 | +0.5pp $368 | +1.0pp $335 |
UW: 25.0% down · 7.5% · 30yr · 1.5% tax · 5.0% vac · 8.0% maint · 8.0% mgmt
Financing live
Cash to close
- Down payment
- $31,225
- Closing costs
- $3,747
- Reserves months
- —
- Total cash needed
- —
Loan-product check · same deal, 3 products live
Conventional
25% down · 7.5% · 30yr
- Down + closing
- —
- Monthly P&I
- —
- Monthly cashflow
- —
- DSCR
- —
- Eligible?
- —
Personal DTI + credit; lowest rate.
DSCR
20% down · 8.5% · 30yr
- Down + closing
- —
- Monthly P&I
- —
- Monthly cashflow
- —
- DSCR
- —
- Eligible?
- —
No personal income docs; deal must DSCR.
Hard money
10% down · 12.0% · 12mo
- Down + closing
- —
- Monthly P&I
- —
- Monthly cashflow
- —
- DSCR
- —
- Eligible?
- —
Short-term bridge; refi at stabilization.
Rent comps 19 comps
| Address | Beds | Baths | Sqft | Rent | $/sqft | DOM | Units | Dist |
|---|---|---|---|---|---|---|---|---|
| 74 Dorris Ave Buffalo, NY | 3.0 | 1.0 | 1200 | $1,450 | $1.21 | 45d | 1 | 0.73mi |
| 73 Inter Park Ave Buffalo, NY | 3.0 | 1.0 | 2080 | $1,300 | $0.62 | 16d | 1 | 0.74mi |
| 517 Goodyear Ave Buffalo, NY | 3.0 | 1.0 | 1559 | $1,800 | $1.15 | 20d | 1 | 0.80mi |
| 563 Humboldt Pkwy Buffalo, NY | 3.0 | 1.0 | 2004 | $1,200 | $0.60 | 25d | 1 | 0.82mi |
| 71 Gerald Ave Buffalo, NY | 2.0 | 1.0 | 1773 | $1,100 | $0.62 | 45d | 1 | 0.91mi |
| 179 Donaldson Rd Buffalo, NY | 3.0 | 1.0 | 1152 | $1,350 | $1.17 | 5d | 1 | 0.92mi |
| 184 Butler Ave Unit 1545840P Buffalo, NY | 4.0 | 1.0 | 1496 | $3,226 | $2.16 | 16d | 1 | 0.93mi |
| 216 Newburgh Ave Buffalo, NY | 2.0 | 1.0 | 1690 | $1,150 | $0.68 | 25d | 1 | 0.97mi |
| 110 Gerald Ave Buffalo, NY | 2.0 | 1.0 | 2098 | $1,100 | $0.52 | 25d | 1 | 0.98mi |
| 25 Parkridge Ave Buffalo, NY | 3.0 | 1.0 | 1914 | $1,350 | $0.71 | 16d | 1 | 1.06mi |
| 121 Humboldt Pkwy Unit B Buffalo, NY | 2.0 | 1.0 | 1265 | $1,750 | $1.38 | 45d | 1 | 1.37mi |
| 117 Humboldt Pkwy Unit A Buffalo, NY | 3.0 | 1.0 | 1105 | $2,300 | $2.08 | 45d | 1 | 1.39mi |
| 102 Florida St Buffalo, NY | 3.0 | 1.0 | 1296 | $1,650 | $1.27 | 45d | 1 | 1.39mi |
| 96 Academy Rd Buffalo, NY | 3.0 | 1.0 | 2247 | $1,400 | $0.62 | 25d | 1 | 1.40mi |
| 65 Domedion Ave Buffalo, NY | 3.0 | 1.0 | 1632 | $1,500 | $0.92 | 3d | 1 | 1.40mi |
| 107 Humboldt Pkwy Unit A Buffalo, NY | 2.0 | 1.0 | 1172 | $1,995 | $1.70 | 45d | 1 | 1.40mi |
| 76 Vernon Pl Unit Upper Buffalo, NY | 3.0 | 1.0 | 1190 | $1,595 | $1.34 | 16d | 1 | 1.44mi |
| 76 Vernon Pl Unit Lower Buffalo, NY | 3.0 | 1.0 | 1190 | $1,445 | $1.21 | 16d | 1 | 1.44mi |
| 2 Agassiz Cir Unit A Buffalo, NY | 2.0 | 1.0 | 1076 | $2,150 | $2.00 | 25d | 1 | 1.47mi |
Listing history 8 events
-
2026-06-21days on market $124,900 Active 10 DOM
-
2026-06-18days on market $124,900 Active 7 DOM
-
2026-06-17days on market $124,900 Active 6 DOM
-
2026-06-16days on market $124,900 Active 5 DOM
-
2026-06-15days on market $124,900 Active 4 DOM
-
2026-06-13days on market $124,900 Active 2 DOM
-
2026-06-13remarks 699-char remark
-
2026-06-13$124,900 Active 1 DOM
ⓘ Source: listings_history table (triggers on properties + properties_extension) + one-shot
backfill from property_details.listing_events for pre-trigger history.
Climate risk First Street
- Flood 1/10 Low FEMA zone X (unshaded) · 0% chance over 30 yrs
- Wildfire 1/10 Low
- Heat 2/10 Low 7 d/yr ≥93°F today · 14 d/yr by 30 yrs out
- Wind 1/10 Low
- Air quality 3/10 Moderate 2 unhealthy d/yr today · 3 by 30 yrs out
Nearby sold comps map
Loading sold comps map…
Walkable amenities ~0.75 mi
Loading nearby amenities…
Taxation est. · year 1
- Rental income
- $19,191
- − Mortgage interest
- −$6,996
- − Property taxes
- −$1,874
- − Insurance
- −$624
- − Repairs & maintenance
- −$1,535
- − Management
- −$1,535
- − Depreciation
- −$3,633
- Taxable income
- $2,993
- Est. tax owed @ 24.0%
- −$718
- After-tax cash flow
- $4,085/yr
For passive investors: Depreciation is non-cash, so a rental often shows a tax loss while cash-flowing — sheltering income. Rental losses are passive: they offset passive income freely, and up to $25,000/yr can offset ordinary (W-2) income if you actively participate and your MAGI is under $100k (phasing out to $0 by $150k); unused losses carry forward. On sale, claimed depreciation is recaptured at up to 25%, and gains may owe capital-gains tax (a 1031 exchange can defer both). Figures are a year-1 estimate at your 24.0% rate — not tax advice; consult a CPA.
Schools (NCES district)
- District
- Buffalo City School District
- NCES district ID
- 3605850
- Math proficiency
- 41% ▲ 11.00%
- Reading proficiency
- 40% ▲ 7.00%
- Median HH income
- $31,665
- Composite
- 33.17/100
- National rank
- #5544
- State rank
- #535 of 590 in NY
Livability — Buffalo
- Score
- 77/100
- State rank
- #195
- US rank
- #3011
Category grades
Schools grade is shown separately in the Schools card above.
Census & demographics
- Census place
- Buffalo, NY
- County
- Erie County · 714,559 people
- City population
- 440,021
- Metro
- Buffalo-Cheektowaga, NY
- Population (ZIP)
- 42,524
- Household income
- $44,955
- Rent vs Own
- Severe rent burden
- 2873.0
Population outlook (Erie County) Hauer SSP2
- Today (2025)
- 933,037 people
- By 2030
- 935,181 · +0.2%
- By 2040
- 928,531 · -0.5%
- By 2050
- 905,725 · -2.9%
- By 2075
- 834,037 · -10.6%
- By 2100
- 708,033 · -24.1%
Race, ethnicity, and origin ACS 2023
- Neighborhood character
- Predominantly Black (67%)
- Race & ethnicity
- Black 67% White 15% Asian 7% Hispanic / Latino 6% Two or more races 6%
- Hispanic origin (detail)
- Puerto Rican 4%
- Common ancestry
- Romanian 4% Lithuanian 1% Italian 1%
- Foreign-born
- 9% · Canada, China
- Languages at home
- 88% English-only · Other Indo-European 4% Spanish 4% Chinese 1%
Political lean MEDSL · Erie
- 2024 margin
- Lean D (+9.7) · D 54.8% · R 45.2%
- 2008→2024 swing
- -7.9pp toward R · 2008: 17.5pp · 2024: 9.7pp
- All cycles
- 2024: D+9.7 2020: D+14.7 2016: D+4.8 2012: D+15.6 2008: D+17.5
Not yet ingested
- Civics
- —
Market trends
- HPI YoY
- ▼ -126.29%
- Current HPI
- 295.2966
- Rent YoY
- ▲ 0.67%
- Metro
- Buffalo-Cheektowaga, NY
- State GDP YoY
- ▲ 2.60%
- F500 in state
- 92
Industry mix (Fortune 500 HQ in NY)
| Industry | F500 HQs | Revenue |
|---|---|---|
| Financial Services | 10 | $950B |
|
||
| Consumer Goods | 9 | $162B |
|
||
| Insurance | 4 | $225B |
|
||
| Telecommunications | 2 | $144B |
|
||
| Pharmaceuticals | 2 | $112B |
|
||
| Media / Entertainment | 2 | $69B |
|
||
Price history
+262.0% since first listed14 events — show timeline
- 2026-06-11 Listed $124,900 WNYREIS
- 2025-08-21 Rental Removed $1,450 RENTEC
- 2025-07-12 Listed for Rent $1,450 RENTEC
- 2025-07-03 Rental Removed $1,450 RENTEC
- 2025-06-21 Listed for Rent $1,450 RENTEC
- 2025-06-13 Rental Removed $1,450 RENTEC
- 2025-06-06 Price Changed $1,450 RENTEC
- 2025-05-29 Listed for Rent $1,500 RENTEC
- 2025-05-17 Rental Removed $1,450 RENTEC
- 2025-05-14 Listed for Rent $1,450 RENTEC
- 2025-04-30 Rental Removed $1,450 RENTEC
- 2025-04-19 Listed for Rent $1,450 RENTEC
- 2017-01-13 Sold (Public Records) $52,075 Public Records
- 1997-07-14 Sold (Public Records) $34,500 Public Records
Property tax history
+5.5%/yrLatest (2025): $185 · -15.4% YoY. Source: county tax records.
Cash-flow waterfall
monthlySold comps — $/sqft
last 12 mo · ≤1 miLoading sold comps…