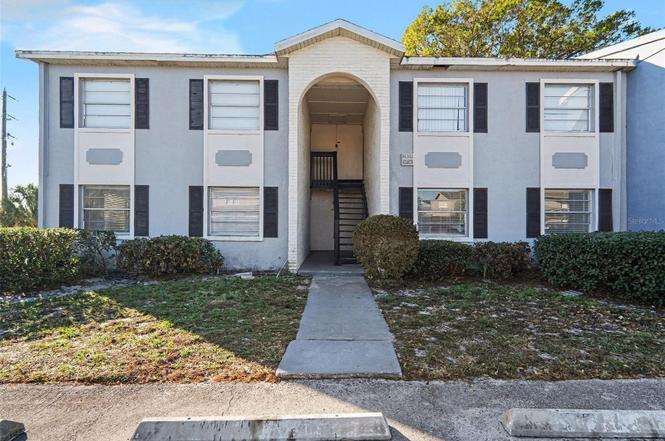
2535 N Alafaya Trl #66 · University, FL
Flood risk No data
- FEMA flood zone
- —
- Chance of flooding over 30 yrs
- —
- Est. flood insurance / yr
- —
Fire risk No data
- Est. fire insurance / yr
- —
Heat risk No data
- Hot days now (above threshold)
- —
- Hot days in 30 yrs
- —
Wind risk No data
- Chance of severe wind over 30 yrs
- —
Air-quality risk No data
- Unhealthy air days now
- —
- Unhealthy air days in 30 yrs
- —
Risk factors via First Street. Map © Google.
Why this score? — see what drove the D grade
The composite is a weighted blend of 9 inputs, each scored 0–100. Each bar is that input's sub-score; the figure is the points it added to the 100-point composite (weight × sub-score).
- Cash flow +13.1/30.0
- ARV discount +7.5/15.0
- 1% rule +5.4/10.0
- Livability +4.2/5.0
- Schools +4.1/10.0
- DSCR +3.9/10.0
- Condition / age +2.5/5.0
- Rent growth +1.5/5.0
- Appreciation +0.0/10.0
$150,000
🖨 Deal sheet (PDF) 📄 Offer letter ✓ Due diligence
Listing remarks MLS
Priced to sell!!! Great for first time home buyers or investors. Wood flooring throught, close to UCF. Hurry before before its gone. * * PQ Letter or Proof of Funds & COPY of Deposit Check MUST Accompany Offers. Special Addenda Required. All Offers to be Su bmitted on an As-Is FAR/BAR. Buyer to verify all home square feet and lot sizes. If exact square footage is a concern, the property should be independently measured. * *
Key facts
- Custom cabinetry
- Screened lanai
- Move in ready
Tags
Property features AI
Finance
- Other: No lease restrictions reported
- Financial info: Total monthly fees $250; total annual fees $3,000
- HOA & community: Monthly HOA/condo fee of $250 (includes pool); Association name: Barry Watson; Pets allowed (weight limit effectively unrestricted)
Exterior
- Utilities: Public water; Public sewer; Electricity connected
- Home design: Condominium; Residential property; 2 total stories; Second-floor unit; South-facing
- Construction: Block construction; Shingle roof; Block foundation; Built as part of building number 66
- Exterior features: Storage
Interior
- Kitchen: Dishwasher; Range; Refrigerator
- Bedrooms: 2 bedrooms
- Flooring: Ceramic tile; Laminate
- Bathrooms: 1 full bathroom
- Heating & cooling: Central heating; Central air conditioning
- Interior features: Ceiling fans
- Laundry & utility: No laundry in unit
Neighborhood map
What this means for you Summary
Snapshot
- This is a 2-bed/1.0-bath condo listed at $150k.
Deal economics
- At list price, monthly cash flow is $-5 ($-64/yr) — negative.
- To cash-flow at today's rent, offer at most $149k (0.6% below list).
- Meets the 1% rule at list price ($2k rent vs $150k).
- Recommended offer: $136k (9.0% below list) — sets the bar for market timing.
- Cap rate 6.3% vs local median 3.8% in University — top-decile yield for the area; either an underpriced asset or a hidden risk that comps aren't pricing in. Stress-test before assuming the spread holds.
Location & tenants
- Location reads 85/100 on livability (#28 in FL, #603 nationally) — a professional / high-income tenant draw. Strengths: amenities A+, commute A+, cost of living A+.
- Orange (suburban): math 46% / reading 51% proficiency, ranked #43 of 73 in FL (top 59%) — families likely to look elsewhere, expect single-tenant / working-renter base with shorter leases.
- Zoned schools: Riverdale Elementary (math 48% / reading 53%, grade D+, #1,055 of 2,144 statewide, top 50%, 595 students, 71% FRL); Corner Lake Middle (math 42% / reading 47%, grade D, #320 of 571 statewide, top 57%, 841 students, 54% FRL); University High (math 25% / reading 57%, grade F, #289 of 667 statewide, top 44%, 2,555 students, 45% FRL) — zoned schools at 57% FRL track the district average.
- Market conditions: Rents falling (-4.0%/yr); 105 active listings in the ZIP; 40 comparable units currently listed for rent nearby; rentals at typical pace (median 22d on market — plan ~3-4 weeks tenant-placement turnaround); 8,053 units permitted in Orange County in 2024 (3,133 in 5+ unit buildings).
Forward outlook
- Local home prices are declining (-3.0%/yr); year-one equity from $1k of loan paydown is wiped out by about $4k of value loss. Plan a longer hold.
- Orange County population projected at +52% by 2050 — long-run rental-demand tailwind backs the buy-and-hold thesis.
Negotiation context
- It's been on market 114 days — a 9% lower offer ($136k) is reasonable based on typical stale-listing flexibility.
- 5 sale attempts since 18y ago; this cycle's ask has dropped $10k (6%) from the opening price — seller is motivated, your offer sets the floor, not the list.
- Current owner paid $31k; list at $150k implies a 382% gain — meaningful room to come down on a strong offer.
Questions for the listing agent
- What do current leases actually rent for vs. the listed asking? Can we see a recent rent roll and the last 12 months of T-12 income?
- It's been on market 114 days. Have you received any prior offers? Is the seller open to a 9% concession, seller financing, or rate buy-down credit?
- Built in 1973 — when were the roof, HVAC, electrical panel, plumbing, and water heater last replaced?
- What does the HOA fee cover, when was the last increase, and are there any pending special assessments or reserve-fund shortfalls?
- Any open or pending special assessments — roof, HVAC, plumbing, elevator, façade? What's the per-unit balance and payoff schedule, and is the seller paying it off at close or rolling it to the buyer?
- Why hasn't it sold? Are there any deal-killer items the seller is aware of (foundation, flood, title, zoning, code violations)?
- Is there a deadline driving the sale (1031 exchange, divorce, estate, relocation)? That informs how much negotiation room exists.
- The area grade is low — what's the realistic commute time and amenity access for the typical tenant pool here? Any planned neighborhood developments (good or bad) we should know about?
- What's the average days-on-market for RENTAL listings here right now (not sales)? A rising rental-DOM trend means longer vacancies and softer asking-rent achievability than the comps imply.
- What's the recent tenant-quality profile in this submarket — average credit score on applications, eviction rate, late-payment / NSF rate, and stable-employment percentage? A property-management company in the area should have these aggregated.
- How much new apartment / multifamily construction is in the pipeline within 1–3 miles? Heavy new supply (>2% of stock underway) typically softens rents 12–24 months out; light construction supports rent growth.
Investment metrics
- 1% rule
- 1.04% ✓
- Cap rate
- 6.25%
- Cash-on-cash
- -0.15%
- DSCR
- 0.99
- GRM
- 8.0
CMA / ARV
No comps found within radius.
Projected returns pro-forma
-3.0% appreciation · 0.0% rent growth · sell at horizon
- IRR
- -20.6%
- Equity multiple
- 0.31×
- Total profit
- $-29,066
- Equity at exit
- $22,365
- IRR
- -24.8%
- Equity multiple
- -0.02×
- Total profit
- $-42,797
- Equity at exit
- $12,969
Cash invested: $42,000 (down + closing). Projections, not guarantees.
Landlord ↔ Tenant lean methodology
- Overall (STATE)
- 87 Strongly Landlord-Friendly
- State Florida
- 87 Strongly Landlord-Friendly · R+3
- County
- — inherits STATE
- City
- — inherits STATE
ZIP-level market 32826
- Home prices YoY
- -17.0%
- Rents YoY
- -4.0%
- Active inventory
- 105
- Price-to-rent
- 8.0×
Monthly cashflow live
- Estimated rent
- $1,558 high interval (Pro) →
- Mortgage (P&I)
- −$787
- Tax from tax record
- −$137 /mo · $1,642/yr
- Insurance
- −$62
- HOA
- −$250
- Vacancy / Maint / Mgmt
- −$327
- Net cashflow
- $-5
Break-even live
Sensitivity live
| Price | -10% $80 | -5% $37 | +0% $-5 | +5% $-48 | +10% $-90 |
|---|---|---|---|---|---|
| Rent | -10% $-128 | -5% $-67 | +0% $-5 | +5% $56 | +10% $118 |
| Rate | -1.0pp $70 | -0.5pp $33 | base $-5 | +0.5pp $-44 | +1.0pp $-84 |
UW: 25.0% down · 7.5% · 30yr · 1.5% tax · 5.0% vac · 8.0% maint · 8.0% mgmt
Financing live
Cash to close
- Down payment
- $37,500
- Closing costs
- $4,500
- Reserves months
- —
- Total cash needed
- —
Loan-product check · same deal, 3 products live
Conventional
25% down · 7.5% · 30yr
- Down + closing
- —
- Monthly P&I
- —
- Monthly cashflow
- —
- DSCR
- —
- Eligible?
- —
Personal DTI + credit; lowest rate.
DSCR
20% down · 8.5% · 30yr
- Down + closing
- —
- Monthly P&I
- —
- Monthly cashflow
- —
- DSCR
- —
- Eligible?
- —
No personal income docs; deal must DSCR.
Hard money
10% down · 12.0% · 12mo
- Down + closing
- —
- Monthly P&I
- —
- Monthly cashflow
- —
- DSCR
- —
- Eligible?
- —
Short-term bridge; refi at stabilization.
Rent comps 40 comps
| Address | Beds | Baths | Sqft | Rent | $/sqft | DOM | Units | Dist |
|---|---|---|---|---|---|---|---|---|
| 2521 N Alafaya Trl #37 Orlando, FL | 2.0 | 1.0 | 850 | $1,420 | $1.67 | 25d | 1 | 0.02mi |
| 2519 N Alafaya Trl #34 Orlando, FL | 2.0 | 1.0 | 850 | $1,450 | $1.71 | 25d | 1 | 0.02mi |
| 2547 N Alafaya Trl #92 Orlando, FL | 2.0 | 1.0 | 850 | $1,380 | $1.62 | 9d | 1 | 0.02mi |
| 2533 N Alafaya Trl #62 Orlando, FL | 2.0 | 1.0 | 850 | $1,295 | $1.52 | 19d | 1 | 0.03mi |
| 2515 N Alafaya Trl Orlando, FL | 2.0 | 1.0 | 850 | $1,295 | $1.52 | 23d | 1 | 0.04mi |
| 2549 N Alafaya Trl Orlando, FL | 2.0 | 1.0 | 850 | $1,200 | $1.41 | 6d | 1 | 0.05mi |
| 2557 N Alafaya Trl #110 Orlando, FL | 2.0 | 1.0 | 900 | $1,295 | $1.44 | 19d | 1 | 0.05mi |
| 2507 N Alafaya Trl #12 Orlando, FL | 2.0 | 1.0 | 850 | $1,300 | $1.53 | 22d | 1 | 0.07mi |
| 2509 N Alafaya Trl #16 Orlando, FL | 2.0 | 1.0 | 850 | $1,495 | $1.76 | 25d | 1 | 0.08mi |
| 2505 N Alafaya Trl #8 Orlando, FL | 2.0 | 1.0 | 850 | $1,395 | $1.64 | 25d | 1 | 0.08mi |
| 2505 N Alafaya Trl Orlando, FL | 2.0 | 1.0 | 850 | $1,395 | $1.64 | 25d | 1 | 0.08mi |
| 2565 N Alafaya Trl Orlando, FL | 2.0 | 1.0 | 850 | $1,495 | $1.76 | 25d | 1 | 0.08mi |
| 12222 Fox Hound Ln Orlando, FL | 2.0 | 2.0 | 1060 | $1,900 | $1.79 | 5d | 1 | 0.11mi |
| 12216 Fox Hound Ln Orlando, FL | 2.0 | 2.0 | 1048 | $1,650 | $1.57 | 23d | 1 | 0.12mi |
| 12216 Fox Hound Ln Orlando, FL | 2.0 | 2.0 | 1048 | $1,650 | $1.57 | 0d | 1 | 0.12mi |
| 12352 Fox Hound Ct Orlando, FL | 2.0 | 1.5 | 1006 | $1,600 | $1.59 | 9d | 1 | 0.14mi |
| 2720 Gray Fox Ln Orlando, FL | 2.0 | 1.5 | 992 | $1,500 | $1.51 | 23d | 1 | 0.18mi |
| 2724 Gray Fox Ln Orlando, FL | 2.0 | 1.5 | 992 | $1,500 | $1.51 | 25d | 1 | 0.19mi |
| 2612 Adela Ave Unit 2612 Orlando, FL | 2.0 | 2.0 | 880 | $1,550 | $1.76 | 6d | 1 | 0.20mi |
| 2550 N Alafaya Trl Orlando, FL | 1.0–3.0 | 1.0–2.0 | 870 | $1,512 | $1.74 | 9d | 4 | 0.21mi |
| 2550 N Alafaya Trl Orlando, FL | 1.0–3.0 | 1.0–2.0 | 870 | $1,562 | $1.80 | 0d | 4 | 0.21mi |
| 2643 Laser Ct Orlando, FL | 2.0 | 2.0 | 1033 | $1,550 | $1.50 | 4d | 1 | 0.26mi |
| 2714 Adela Ave Orlando, FL | 2.0 | 2.0 | 880 | $1,525 | $1.73 | 23d | 1 | 0.28mi |
| 12240 Eastcove Dr Orlando, FL | 2.0 | 2.0 | 837 | $1,599 | $1.91 | 22d | 1 | 0.34mi |
| 12164 Pepperdine Pl Orlando, FL | 2.0 | 2.0 | 960 | $1,525 | $1.59 | 25d | 1 | 0.40mi |
| 12078 Tift Cir Orlando, FL | 2.0 | 2.5 | 935 | $1,550 | $1.66 | 25d | 1 | 0.41mi |
| 12062 Tift Cir Orlando, FL | 2.0 | 2.5 | 960 | $1,800 | $1.88 | 25d | 1 | 0.43mi |
| 12058 Tift Cir Orlando, FL | 2.0 | 2.5 | 935 | $1,650 | $1.76 | 25d | 1 | 0.43mi |
| 12165 Pepperdine Pl Orlando, FL | 2.0 | 2.0 | 960 | $1,900 | $1.98 | 25d | 1 | 0.43mi |
| 12034 Tift Cir Unit 12038TIF Orlando, FL | 2.0 | 2.0 | 960 | $1,549 | $1.61 | 25d | 1 | 0.47mi |
| 12028 Pepperdine Pl Orlando, FL | 2.0 | 1.5 | 1005 | $1,595 | $1.59 | 0d | 1 | 0.47mi |
| 12221 E Colonial Dr Orlando, FL | 2.0 | 1.0–2.0 | 804 | $2,040 | $2.54 | 0d | 6 | 0.72mi |
| 11640 Anjali Ct Unit 1 Orlando, FL | 2.0 | 2.0 | 982 | $1,649 | $1.68 | 23d | 1 | 0.74mi |
| 1421 Sophie Blvd Orlando, FL | 2.0 | 2.0 | 1087 | $1,795 | $1.65 | 19d | 1 | 0.80mi |
| 12137 Ashton Manor Way Orlando, FL | 1.0–3.0 | 1.0–2.0 | 1024 | $1,693 | $1.65 | 0d | 9 | 0.90mi |
| 1230 Sophie Blvd Orlando, FL | 2.0 | 2.0 | 1087 | $1,550 | $1.43 | 5d | 1 | 0.98mi |
| 1700 Woodbury Rd Orlando, FL | 1.0–3.0 | 1.0–2.0 | 940 | $1,692 | $1.80 | 0d | 9 | 1.06mi |
| 12000 Bryonia Rd Alafaya, FL | 1.0–3.0 | 1.0–2.0 | 979 | $2,104 | $2.15 | 0d | 12 | 1.10mi |
| 1928 Bonneville Dr Orlando, FL | 2.0 | 2.0 | 1000 | $1,590 | $1.59 | 9d | 1 | 1.15mi |
| 1820 Bonneville Dr Unit 1820 Orlando, FL | 3.0 | 2.5 | 850 | $1,595 | $1.88 | 25d | 1 | 1.16mi |
HOA detail condo
- Monthly dues
- $250 · $3,000/yr
- Assessments
- None detected in remarks — confirm with the listing agent.
Listing history 11 events
-
2026-04-21status Active
-
2026-04-20historical
-
2026-03-03price $150,000
-
2026-02-17price $155,000
-
2026-02-03$160,000 Active
-
2022-11-21historical
-
2022-08-04$199,000 Active
-
2009-04-22soldstatus $31,100 435-char remark
Show marketing remark (435 chars)
Priced to sell!!! Great for first time home buyers or investors. Wood flooring throught, close to UCF. Hurry before before its gone. * * PQ Letter or Proof of Funds & COPY of Deposit Check MUST Accompany Offers. Special Addenda Required. All Offers to be Su bmitted on an As-Is FAR/BAR. Buyer to verify all home square feet and lot sizes. If exact square footage is a concern, the property should be independently measured. * *
-
2009-03-12$23,900 435-char remark
Show marketing remark (435 chars)
Priced to sell!!! Great for first time home buyers or investors. Wood flooring throught, close to UCF. Hurry before before its gone. * * PQ Letter or Proof of Funds & COPY of Deposit Check MUST Accompany Offers. Special Addenda Required. All Offers to be Su bmitted on an As-Is FAR/BAR. Buyer to verify all home square feet and lot sizes. If exact square footage is a concern, the property should be independently measured. * *
-
2008-05-23historical
-
2008-03-19$164,600
ⓘ Source: listings_history table (triggers on properties + properties_extension) + one-shot
backfill from property_details.listing_events for pre-trigger history.
Tax reassessment forecast FL · Resets to sale price
- Current annual tax
- $1,642 · $137/mo
- Projected year-2 tax
- $1,642 · $137/mo
- Expected delta
- $0/yr ($0/mo · 0.0%)
ⓘ Screening estimate from a state-policy table — verify with the county assessor before closing.
Nearby sold comps map
Loading sold comps map…
Walkable amenities ~0.75 mi
Loading nearby amenities…
Taxation est. · year 1
- Rental income
- $18,692
- − Mortgage interest
- −$8,402
- − Property taxes
- −$1,642
- − Insurance
- −$750
- − Repairs & maintenance
- −$1,495
- − Management
- −$1,495
- − HOA
- −$3,000
- − Depreciation
- −$4,364
- Taxable loss
- −$2,456
- Est. tax savings @ 24.0%
- +$589
- After-tax cash flow
- $525/yr
For passive investors: Depreciation is non-cash, so a rental often shows a tax loss while cash-flowing — sheltering income. Rental losses are passive: they offset passive income freely, and up to $25,000/yr can offset ordinary (W-2) income if you actively participate and your MAGI is under $100k (phasing out to $0 by $150k); unused losses carry forward. On sale, claimed depreciation is recaptured at up to 25%, and gains may owe capital-gains tax (a 1031 exchange can defer both). Figures are a year-1 estimate at your 24.0% rate — not tax advice; consult a CPA.
Schools (NCES district)
- District
- Orange
- NCES district ID
- 1201440
- Math proficiency
- 46% ▼ -9.00%
- Reading proficiency
- 51% ▼ -2.00%
- Median HH income
- $49,350
- Composite
- 41.47/100
- National rank
- #3461
- State rank
- #43 of 73 in FL
Livability — University
- Score
- 85/100
- State rank
- #28
- US rank
- #603
Category grades
Schools grade is shown separately in the Schools card above.
Census & demographics
- Census place
- University, FL
- County
- Orange County · 1,471,359 people
- City population
- 41,570
- Metro
- Orlando-Kissimmee-Sanford, FL
- Population (ZIP)
- 29,006
- Household income
- $64,755
- Rent vs Own
- Severe rent burden
- 1705.0
Population outlook (Orange County) Hauer SSP2
- Today (2025)
- 1,618,226 people
- By 2030
- 1,787,404 · +10.5%
- By 2040
- 2,125,621 · +31.4%
- By 2050
- 2,454,016 · +51.6%
- By 2075
- 3,173,711 · +96.1%
- By 2100
- 3,607,781 · +122.9%
Race, ethnicity, and origin ACS 2023
- Neighborhood character
- Diverse neighborhood (Simpson 0.64)
- Race & ethnicity
- White 48% Hispanic / Latino 34% Two or more races 19% Black 9% Asian 4%
- Hispanic origin (detail)
- Mexican 3% Puerto Rican 16% Cuban 6% Dominican 1%
- Common ancestry
- Romanian 2% Slovak 1% Serbian 1%
- Foreign-born
- 15% · Canada
- Languages at home
- 70% English-only · Spanish 22% Other Indo-European 3% Other Asian/Pacific 1%
Political lean MEDSL · Orange
- 2024 margin
- D (+13.6) · D 56.1% · R 42.5% · Other 1.3%
- 2008→2024 swing
- -5.0pp toward R · 2008: 18.6pp · 2024: 13.6pp
- All cycles
- 2024: D+13.6 2020: D+23.1 2016: D+24.6 2012: D+18.2 2008: D+18.6
Not yet ingested
- Civics
- —
Market trends
- HPI YoY
- ▼ -65.30%
- Current HPI
- 318.563
- Rent YoY
- ▼ -4.05%
- Metro
- Orlando-Kissimmee-Sanford, FL
- State GDP YoY
- ▲ 3.28%
- F500 in state
- 36
Industry mix (Fortune 500 HQ in FL)
| Industry | F500 HQs | Revenue |
|---|---|---|
| Industrial Technology | 2 | $29B |
|
||
| Insurance | 2 | $17B |
|
||
| Retail | 1 | $60B |
|
||
| Technology Distribution | 1 | $58B |
|
||
| Homebuilding | 1 | $35B |
|
||
| Technology Manufacturing | 1 | $35B |
|
||
Price history
-8.9% since first listed11 events — show timeline
- 2026-04-21 Relisted — Stellar MLS as Distributed by MLS Grid
- 2026-04-20 Listing Removed — Stellar MLS as Distributed by MLS Grid
- 2026-03-03 Price Changed $150,000 Stellar MLS as Distributed by MLS Grid
- 2026-02-17 Price Changed $155,000 Stellar MLS as Distributed by MLS Grid
- 2026-02-03 Listed $160,000 Stellar MLS as Distributed by MLS Grid
- 2022-11-21 Rental Removed — STELLARMLS
- 2022-08-04 Listed $199,000 Stellar MLS as Distributed by MLS Grid
- 2009-04-22 Sold (MLS) $31,100 Stellar MLS as Distributed by MLS Grid
- 2009-03-12 Listed $23,900 Stellar MLS as Distributed by MLS Grid
- 2008-05-23 Listing Removed — Stellar MLS as Distributed by MLS Grid
- 2008-03-19 Listed $164,600 Stellar MLS as Distributed by MLS Grid
Property tax history
+11.6%/yrLatest (2025): $1,642 · +9.7% YoY. Source: county tax records.
Cash-flow waterfall
monthlySold comps — $/sqft
last 12 mo · ≤1 miLoading sold comps…