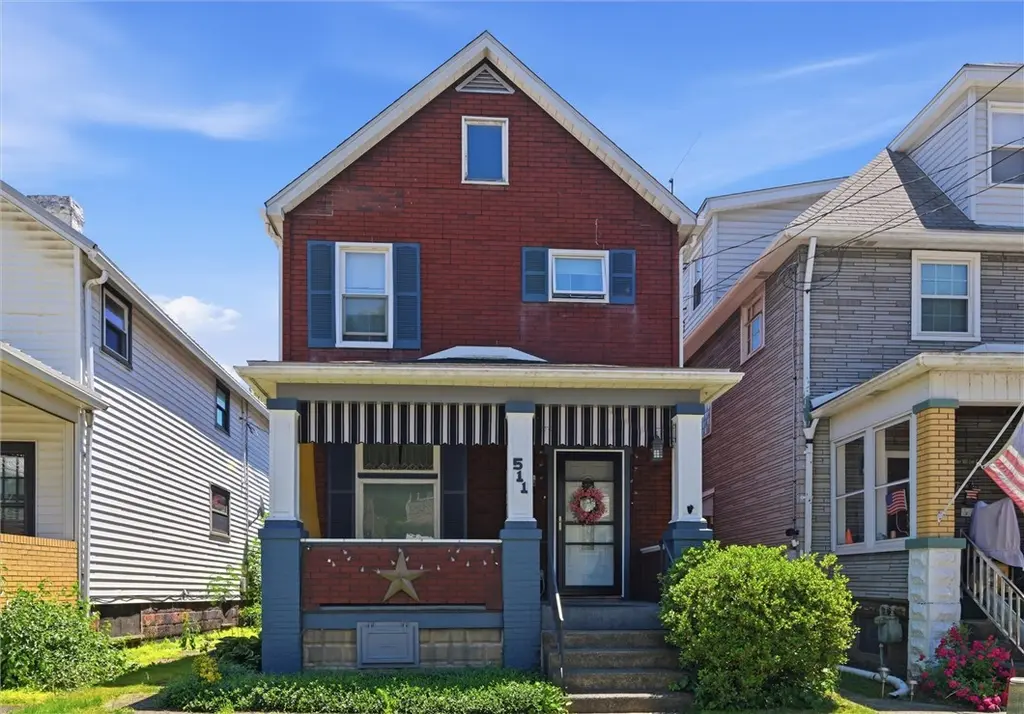
511 Mckinley Ave · East Vandergrift, PA
Flood risk 8/10 · Major
- FEMA flood zone
- X (unshaded)
- Chance of flooding over 30 yrs
- 0.99%
- Est. flood insurance / yr
- $507 – $1,088
Fire risk 1/10 · Minimal
- Est. fire insurance / yr
- $511 – $949
Heat risk 4/10 · Minor
- Hot days now (above 97°F)
- 8 days/yr
- Hot days in 30 yrs
- 19 days/yr
Wind risk 2/10 · Minimal
- Chance of severe wind over 30 yrs
- —
Air-quality risk 3/10 · Minor
- Unhealthy air days now
- 3 days/yr
- Unhealthy air days in 30 yrs
- 5 days/yr
Risk factors via First Street. Map © Google.
Why this score? — see what drove the C+ grade
The composite is a weighted blend of 9 inputs, each scored 0–100. Each bar is that input's sub-score; the figure is the points it added to the 100-point composite (weight × sub-score).
- Cash flow +22.6/30.0
- Appreciation +8.4/10.0
- ARV discount +7.5/15.0
- DSCR +7.3/10.0
- 1% rule +5.4/10.0
- Schools +4.0/10.0
- Livability +3.2/5.0
- Rent growth +2.5/5.0
- Condition / age +2.5/5.0
$98,000
🖨 Deal sheet 📄 Offer letter ✓ Due diligence
Listing remarks
Welcome to 511 McKinley Avenue in East Vandergrift! This charming 3-bedroom, 2-story home combines classic character with tasteful updates throughout. As you approach the home, you'll be greeted by a large covered front porch, the perfect place to relax and enjoy the neighborhood. Step inside to a beautiful stone-tiled entryway that creates a warm and inviting first impression. The spacious living room and dining room feature updated vinyl flooring, providing both style and durability for everyday living. The generously sized kitchen offers plenty of space for meal preparation and gathering with family and friends. Features include ceramic tile flooring, a stainless-steel refrigerator, gas
Key facts
- Stone tiled entryway
- Gas stove
- 2,626 sq ft lot
Tags
Property features AI
Exterior
- Parking: Off-street parking; 2 parking spaces
- Utilities: Public water; Public sewer
- Home design: 2-story residence; Resale property
- Construction: Shingle siding; Asphalt roof
- Exterior features: Small lot (approx. 0.06 acres)
Interior
- Kitchen: Dishwasher; Microwave; Refrigerator; Stove; Some gas appliances
- Bedrooms: Upper bedroom (9 x 8); Upper bedroom (12 x 9); Upper bedroom (15 x 11)
- Flooring: Ceramic tile; Vinyl
- Bathrooms: 1 full bathroom; 1 half bathroom
- Heating & cooling: Gas heating; Hot water heating; Wall/window air conditioning units
- Interior features: Kitchen island; Ceramic tile and vinyl flooring
- Laundry & utility: Washer; Dryer
Neighborhood map
What this means for you Summary
Snapshot
- This is a 3-bed/1.5-bath other listed at $98k.
Deal economics
- At list price, monthly cash flow is $101 ($1k/yr) — positive.
- The deal already cash-flows at list — no discount required.
- Meets the 1% rule at list price ($1k rent vs $98k).
Location & tenants
- Location reads 63/100 on livability (#1,272 in PA) — a middle-class / working-renter tenant base. Strengths: cost of living A+, housing A+; Watch: crime D+, amenities F, commute F.
- Kiski Area SD (suburban): math 33% / reading 60% proficiency, ranked #247 of 539 in PA (top 46%) — families likely to look elsewhere, expect single-tenant / working-renter base with shorter leases.
- Market conditions: 5 active listings in the ZIP; 4 comparable units currently listed for rent nearby; rentals at typical pace (median 17d on market — plan ~3-4 weeks tenant-placement turnaround); 415 units permitted in Westmoreland County in 2024 (10 in 5+ unit buildings).
Forward outlook
- In year one you build about $7k of equity ($678 loan paydown + $7k appreciation (6.9% local appreciation)).
- Westmoreland County population projected at -19% by 2050 — secular population decline; favor cash flow + early exit over multi-decade hold.
- At projected returns (6.9% appreciation + 3.0% rent growth), your $27k cash investment doubles in ~3 years — after that, you're playing with house money.
- By year 5, paydown + projected appreciation supports a ~$33k cash-out refi (75% LTV) — recoverable capital for the next deal without selling this one.
Negotiation context
- Only 5 days on market — expect competitive offers; lowballing is unlikely to land.
- Current owner paid $80k; 22% above their basis — modest negotiation headroom, anchor on the comps not their cost.
Risks & watch-outs
- Watch-outs: flood insurance adds $66/mo; built in 1915 — expect roof / HVAC / electrical / plumbing capex.
- Climate carrying-cost: severe flood risk — expect insurance premiums to compound above CPI over the hold.
Questions for the listing agent
- Built in 1915 — when were the roof, HVAC, electrical panel, plumbing, and water heater last replaced?
- What's the actual annual flood-insurance premium (NFIP or private), and is the property in a SFHA with mandatory coverage?
- Is there a deadline driving the sale (1031 exchange, divorce, estate, relocation)? That informs how much negotiation room exists.
- Crime grade is D in this area — have there been break-ins, vandalism, or insurance claims at this property in the last 3 years? What carrier currently insures it and at what premium?
- What's the average days-on-market for RENTAL listings here right now (not sales)? A rising rental-DOM trend means longer vacancies and softer asking-rent achievability than the comps imply.
- What's the recent tenant-quality profile in this submarket — average credit score on applications, eviction rate, late-payment / NSF rate, and stable-employment percentage? A property-management company in the area should have these aggregated.
- How much new for-sale + rental construction is in the pipeline within 1–3 miles? Heavy new supply typically softens prices + rents 12–24 months out; constrained supply supports both.
Investment metrics
- 1% rule
- 1.04% ✓
- Cap rate
- 8.34%
- Cash-on-cash
- 7.32%
- DSCR
- 1.33
- GRM
- 8.0
CMA / ARV
No comps found within radius.
Projected returns pro-forma
6.86% appreciation · 3.0% rent growth · sell at horizon
- IRR
- 20.9%
- Equity multiple
- 2.45×
- Total profit
- $39,867
- Equity at exit
- $67,038
- IRR
- 19.7%
- Equity multiple
- 5.05×
- Total profit
- $111,225
- Equity at exit
- $126,559
Cash invested: $27,440 (down + closing). Projections, not guarantees.
Landlord ↔ Tenant lean methodology
- Overall (STATE)
- 62 Landlord-Friendly
- State Pennsylvania
- 62 Landlord-Friendly · EVEN
- County
- — inherits STATE
- City
- — inherits STATE
ZIP-level market 15629
- Home prices YoY
- 7.0%
- Active inventory
- 5
- Price-to-rent
- 8.0×
Monthly cashflow live
- Estimated rent
- $1,024 medium interval (Pro) →
- Mortgage (P&I)
- −$514
- Tax from tax record
- −$87 /mo · $1,040/yr
- Insurance
- −$41
- Flood insurance flood zone
- −$66 /mo · $798/yr
- HOA
- −$0
- Vacancy / Maint / Mgmt
- −$215
- Net cashflow
- $101
Break-even live
UW: 25.0% down · 7.5% · 30yr · 1.5% tax · 5.0% vac · 8.0% maint · 8.0% mgmt
Financing live
Cash to close
- Down payment
- $24,500
- Closing costs
- $2,940
- Reserves months
- —
- Total cash needed
- —
Loan-product check · same deal, 3 products live
Conventional
25% down · 7.5% · 30yr
- Down + closing
- —
- Monthly P&I
- —
- Monthly cashflow
- —
- DSCR
- —
- Eligible?
- —
Personal DTI + credit; lowest rate.
DSCR
20% down · 8.5% · 30yr
- Down + closing
- —
- Monthly P&I
- —
- Monthly cashflow
- —
- DSCR
- —
- Eligible?
- —
No personal income docs; deal must DSCR.
Hard money
10% down · 12.0% · 12mo
- Down + closing
- —
- Monthly P&I
- —
- Monthly cashflow
- —
- DSCR
- —
- Eligible?
- —
Short-term bridge; refi at stabilization.
Rent comps 4 comps
| Address | Beds | Baths | Sqft | Rent | $/sqft | DOM | Units | Dist |
|---|---|---|---|---|---|---|---|---|
| 434 Mckinley Ave Vandergrift - WML, PA | 1.0–2.0 | 1.0 | 933 | $1,098 | $1.18 | 1d | 3 | 0.29mi |
| 121 McKinley Ave Vandergrift, PA | 2.0 | 1.0 | 1064 | $795 | $0.75 | 7d | 1 | 0.41mi |
| 121 McKinley Ave Unit 121-B Vandergrift, PA | 2.0 | 1.0 | 1064 | $850 | $0.80 | 43d | 1 | 0.41mi |
| 1005 Hancock Ave Vandergrift, PA | 3.0 | 2.0 | 1400 | $1,395 | $1.00 | 17d | 1 | 0.48mi |
Listing history 7 events
-
2026-06-18days on market $98,000 Active 5 DOM
-
2026-06-17status $98,000 Active 4 DOM
-
2026-06-13statusdays on market $98,000 Pending 4 DOM
-
2026-06-09days on market $98,000 Active 3 DOM
-
2026-06-08days on market $98,000 Active 2 DOM
-
2026-06-07remarks 699-char remark
-
2026-06-07$98,000 Active 1 DOM
ⓘ Source: listings_history table (triggers on properties + properties_extension) + one-shot
backfill from property_details.listing_events for pre-trigger history.
Tax reassessment forecast PA · Partial reset (capped growth)
- Current annual tax
- $1,040 · $87/mo
- Projected year-2 tax
- $1,294 · $108/mo
- Expected delta
- +$254/yr (+$21/mo · 24.5%)
ⓘ Screening estimate from a state-policy table — verify with the county assessor before closing.
Climate risk First Street
- Flood 8/10 Severe FEMA zone X (unshaded) · 99% chance over 30 yrs
- Wildfire 1/10 Low
- Heat 4/10 Moderate 8 d/yr ≥97°F today · 19 d/yr by 30 yrs out
- Wind 2/10 Low
- Air quality 3/10 Moderate 3 unhealthy d/yr today · 5 by 30 yrs out
Nearby sold comps map
Loading sold comps map…
Walkable amenities ~0.75 mi
Loading nearby amenities…
Taxation est. · year 1
- Rental income
- $12,286
- − Mortgage interest
- −$5,490
- − Property taxes
- −$1,040
- − Insurance
- −$1,288
- − Repairs & maintenance
- −$983
- − Management
- −$983
- − Depreciation
- −$2,851
- Taxable loss
- −$347
- Est. tax savings @ 24.0%
- +$83
- After-tax cash flow
- $1,295/yr
For passive investors: Depreciation is non-cash, so a rental often shows a tax loss while cash-flowing — sheltering income. Rental losses are passive: they offset passive income freely, and up to $25,000/yr can offset ordinary (W-2) income if you actively participate and your MAGI is under $100k (phasing out to $0 by $150k); unused losses carry forward. On sale, claimed depreciation is recaptured at up to 25%, and gains may owe capital-gains tax (a 1031 exchange can defer both). Figures are a year-1 estimate at your 24.0% rate — not tax advice; consult a CPA.
Schools (NCES district)
- District
- Kiski Area SD
- NCES district ID
- 4212840
- Math proficiency
- 33% ▼ -16.00%
- Reading proficiency
- 60% ▼ -10.00%
- Median HH income
- $49,407
- Composite
- 39.72/100
- National rank
- #3900
- State rank
- #247 of 539 in PA
Livability — East Vandergrift
- Score
- 63/100
- State rank
- #1272
- US rank
- #15717
Category grades
Schools grade is shown separately in the Schools card above.
Census & demographics
- Census place
- East Vandergrift, PA
- City population
- 650
- Population (ZIP)
- 650
Population outlook (Westmoreland County) Hauer SSP2
- Today (2025)
- 342,555 people
- By 2030
- 331,717 · -3.2%
- By 2040
- 304,976 · -11.0%
- By 2050
- 277,444 · -19.0%
- By 2075
- 224,607 · -34.4%
- By 2100
- 171,084 · -50.1%
Race, ethnicity, and origin ACS 2023
- Neighborhood character
- Predominantly White (97%)
- Race & ethnicity
- White 97% Two or more races 3%
- Common ancestry
- Romanian 12% Iranian 2% Scotch-Irish 1%
- Languages at home
- 99% English-only · Spanish 1% Other Indo-European 0%
Political lean MEDSL · Westmoreland
- 2024 margin
- Strong R (+28.4) · D 35.4% · R 63.9%
- 2008→2024 swing
- -11.7pp toward R · 2008: -16.7pp · 2024: -28.4pp
- All cycles
- 2024: R+28.4 2020: R+28.3 2016: R+31.3 2012: R+23.7 2008: R+16.7
Not yet ingested
- Civics
- —
Market trends
- HPI YoY
- ▲ 6.86%
- Current HPI
- 105.1557
- Rent YoY
- —
- Metro
- —
- State GDP YoY
- ▲ 1.68%
- F500 in state
- 34
Industry mix (Fortune 500 HQ in PA)
| Industry | F500 HQs | Revenue |
|---|---|---|
| Healthcare | 2 | $309B |
|
||
| Insurance | 2 | $27B |
|
||
| Telecommunications / Media | 1 | $124B |
|
||
| Industrial Distribution | 1 | $22B |
|
||
| Financial Services | 1 | $20B |
|
||
| Chemicals / Materials | 1 | $18B |
|
||
Price history
+176.1% since first listed3 events — show timeline
- 2026-05-16 Listed $98,000 West Penn MLS
- 2023-04-06 Sold (Public Records) $80,000 Public Records
- 2001-01-01 Sold (Public Records) $35,500 Public Records
Property tax history
+2.5%/yrLatest (2026): $1,040 · +0.0% YoY. Source: county tax records.
Cash-flow waterfall
monthlySold comps — $/sqft
last 12 mo · ≤1 miLoading sold comps…