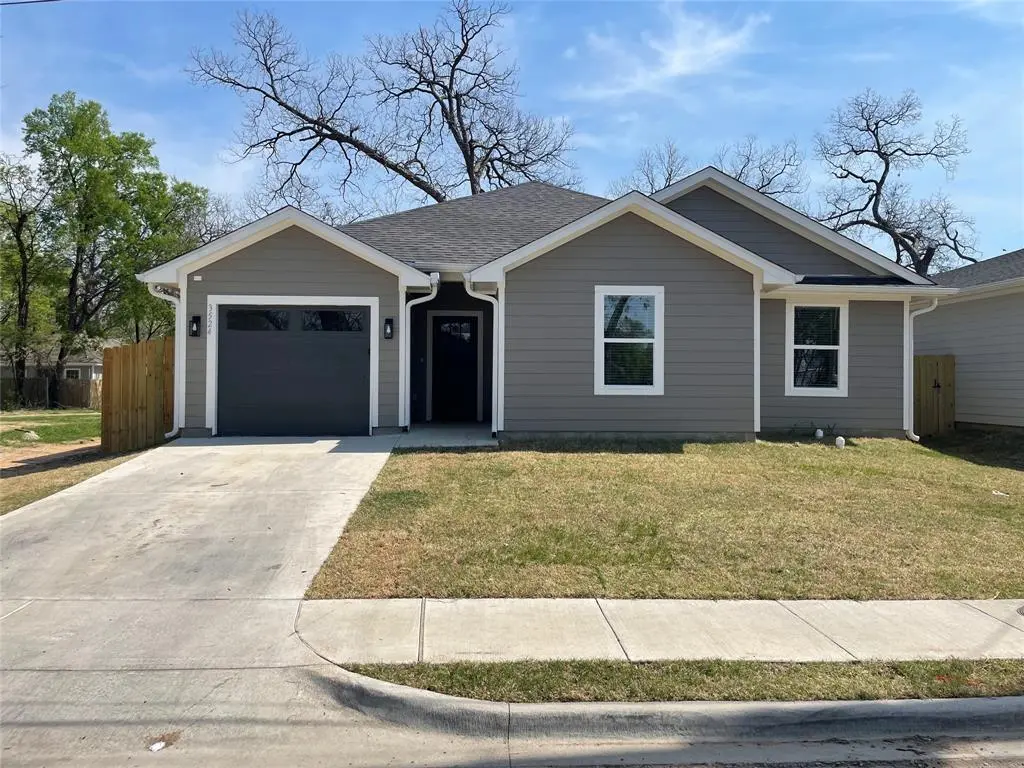
3524 Hamilton Ave · Dallas, TX
Flood risk 4/10 · Minor
- FEMA flood zone
- X (unshaded)
- Chance of flooding over 30 yrs
- 0.21%
- Est. flood insurance / yr
- $507 – $1,088
Fire risk 3/10 · Minor
- Est. fire insurance / yr
- $1,222 – $2,270
Heat risk 7/10 · Major
- Hot days now (above 110°F)
- 7 days/yr
- Hot days in 30 yrs
- 24 days/yr
Wind risk 6/10 · Moderate
- Chance of severe wind over 30 yrs
- 27.0%
Air-quality risk 3/10 · Minor
- Unhealthy air days now
- 2 days/yr
- Unhealthy air days in 30 yrs
- 3 days/yr
Risk factors via First Street. Map © Google.
Why this score? — see what drove the D grade
The composite is a weighted blend of 9 inputs, each scored 0–100. Each bar is that input's sub-score; the figure is the points it added to the 100-point composite (weight × sub-score).
- Cash flow +14.2/30.0
- Appreciation +5.5/10.0
- ARV discount +5.0/15.0
- DSCR +4.3/10.0
- Livability +4.0/5.0
- 1% rule +2.8/10.0
- Schools +2.8/10.0
- Rent growth +2.5/5.0
- Condition / age +2.5/5.0
$285,000
🖨 Deal sheet 📄 Offer letter ✓ Due diligence
Listing remarks MLS
Welcome to your future new build home! 4-bedroom, 2-bath home located in the historic Mill City neighborhood. Nestled in vibrant South Dallas, this property offers unmatched proximity, long-term equity, and tremendous opportunity. Just minutes from Fair Park—future site of the 2026 World Cup—and with quick access to I-45 and I-30, getting around the city is a breeze. While most comparable 3- and 4-bedroom homes in the area are priced above $300K, this home offers potential instant equity, making it an ideal choice for buyers who've found homeownership just out of reach. There are 3 other homes with this floor plan being framed in the same area. Inquire with Agent. House included refrigerator, stove, microwave and dishwasher. No downpayment with preferred lender Cornerstone Home Lending and no mortgage insurance for qualifying buyers. See additional documents for preferred lender information, warranty, DHAP program details, and other grant opportunities.
Key facts
- 4,008 sq ft lot
- Garage
- Built 2025
Neighborhood map
What this means for you Summary
Snapshot
- This is a 4-bed/2.0-bath land listed at $285k.
Deal economics
- At list price, monthly cash flow is $46 ($546/yr) — positive.
- The deal already cash-flows at list — no discount required.
- To meet the 1% rule (rent ≥ 1% of price), the offer needs to be $223k (21.9% below list).
- Recommended offer: $223k (21.9% below list) — sets the bar for 1% rule.
- Cap rate 6.5% vs local median 2.3% in Dallas — top-decile yield for the area; either an underpriced asset or a hidden risk that comps aren't pricing in. Stress-test before assuming the spread holds.
Location & tenants
- Location reads 81/100 on livability (#24 in TX, #1,380 nationally) — a professional / high-income tenant draw. Strengths: amenities A+, commute A+, housing A+; Watch: schools C-, crime F.
- Dallas ISD (urban): math 31% / reading 36% proficiency, ranked #559 of 826 in TX (top 68%) — families likely to look elsewhere, expect single-tenant / working-renter base with shorter leases; 83% free/reduced lunch — lower-income household profile, screen leases tightly.
- Market conditions: 80 active listings in the ZIP; 36 comparable units currently listed for rent nearby; rentals at typical pace (median 25d on market — plan ~3-4 weeks tenant-placement turnaround); 42% of comp listings sitting > 30 days — soft ceiling on asking rent; 12,577 units permitted in Dallas County in 2024 (6,829 in 5+ unit buildings).
Forward outlook
- In year one you build about $5k of equity ($2k loan paydown + $3k appreciation (1.1% local appreciation)).
- Dallas County population projected at +35% by 2050 — long-run rental-demand tailwind backs the buy-and-hold thesis.
- At projected returns (1.1% appreciation + 3.0% rent growth), your $80k cash investment doubles in ~10 years — after that, you're playing with house money.
- By year 7, paydown + projected appreciation supports a ~$34k cash-out refi (75% LTV) — recoverable capital for the next deal without selling this one.
Negotiation context
- It's been on market 77 days — a 6% lower offer ($268k) is reasonable based on typical stale-listing flexibility.
Risks & watch-outs
- Climate carrying-cost: major wind risk, 27% chance of damaging wind over 30y; extreme-heat days projected 7→24/yr by 2055 (HVAC capex compounding) — expect insurance premiums to compound above CPI over the hold.
Questions for the listing agent
- It's been on market 77 days. Have you received any prior offers? Is the seller open to a 22% concession, seller financing, or rate buy-down credit?
- Why hasn't it sold? Are there any deal-killer items the seller is aware of (foundation, flood, title, zoning, code violations)?
- Is there a deadline driving the sale (1031 exchange, divorce, estate, relocation)? That informs how much negotiation room exists.
- Crime grade is F in this area — have there been break-ins, vandalism, or insurance claims at this property in the last 3 years? What carrier currently insures it and at what premium?
- The area grade is low — what's the realistic commute time and amenity access for the typical tenant pool here? Any planned neighborhood developments (good or bad) we should know about?
- What's the average days-on-market for RENTAL listings here right now (not sales)? A rising rental-DOM trend means longer vacancies and softer asking-rent achievability than the comps imply.
- What's the recent tenant-quality profile in this submarket — average credit score on applications, eviction rate, late-payment / NSF rate, and stable-employment percentage? A property-management company in the area should have these aggregated.
- How much new for-sale + rental construction is in the pipeline within 1–3 miles? Heavy new supply typically softens prices + rents 12–24 months out; constrained supply supports both.
Investment metrics
- 1% rule
- 0.78% ✗
- Cap rate
- 6.48%
- Cash-on-cash
- 0.68%
- DSCR
- 1.03
- GRM
- 10.7
CMA / ARV
- ARV (median comp)
- $270,255
- List price
- $285,000
- Delta
- 5.46%
- Verdict
- FAIR
- Comps
- 20 within 1.0 mi
Projected returns pro-forma
1.07% appreciation · 3.0% rent growth · sell at horizon
- IRR
- 2.2%
- Equity multiple
- 1.11×
- Total profit
- $9,034
- Equity at exit
- $98,283
- IRR
- 6.7%
- Equity multiple
- 1.82×
- Total profit
- $65,765
- Equity at exit
- $131,378
Cash invested: $79,800 (down + closing). Projections, not guarantees.
Landlord ↔ Tenant lean methodology
- Overall (STATE)
- 87 Strongly Landlord-Friendly
- State Texas
- 87 Strongly Landlord-Friendly · R+5
- County
- — inherits STATE
- City
- — inherits STATE
ZIP-level market 75210
- Home prices YoY
- 0.6%
- Active inventory
- 80
- Price-to-rent
- 10.7×
Monthly cashflow live
- Estimated rent
- $2,227 high interval (Pro) →
- Mortgage (P&I)
- −$1,495
- Tax from tax record
- −$101 /mo · $1,208/yr
- Insurance
- −$119
- HOA
- −$0
- Vacancy / Maint / Mgmt
- −$468
- Net cashflow
- $46
Break-even live
UW: 25.0% down · 7.5% · 30yr · 1.5% tax · 5.0% vac · 8.0% maint · 8.0% mgmt
Financing live
Cash to close
- Down payment
- $71,250
- Closing costs
- $8,550
- Reserves months
- —
- Total cash needed
- —
Loan-product check · same deal, 3 products live
Conventional
25% down · 7.5% · 30yr
- Down + closing
- —
- Monthly P&I
- —
- Monthly cashflow
- —
- DSCR
- —
- Eligible?
- —
Personal DTI + credit; lowest rate.
DSCR
20% down · 8.5% · 30yr
- Down + closing
- —
- Monthly P&I
- —
- Monthly cashflow
- —
- DSCR
- —
- Eligible?
- —
No personal income docs; deal must DSCR.
Hard money
10% down · 12.0% · 12mo
- Down + closing
- —
- Monthly P&I
- —
- Monthly cashflow
- —
- DSCR
- —
- Eligible?
- —
Short-term bridge; refi at stabilization.
Rent comps 36 comps
| Address | Beds | Baths | Sqft | Rent | $/sqft | DOM | Units | Dist |
|---|---|---|---|---|---|---|---|---|
| 3523 Herrling St Dallas, TX | 3.0 | 2.0 | 1525 | $1,800 | $1.18 | 17d | 1 | 0.24mi |
| 2714 Hector St Dallas, TX | 3.0 | 2.0 | 1233 | $2,100 | $1.70 | 24d | 1 | 0.33mi |
| 3915 Coolidge St Dallas, TX | 4.0 | 2.0 | 1416 | $2,100 | $1.48 | 44d | 1 | 0.33mi |
| 3331 Spring Ave Dallas, TX | 3.0 | 2.0 | 1652 | $2,200 | $1.33 | 8d | 1 | 0.39mi |
| 3331 Spring Ave Dallas, TX | 3.0 | 2.0 | 1652 | $2,200 | $1.33 | 24d | 1 | 0.39mi |
| 4220 Hamilton Ave Dallas, TX | 4.0 | 2.0 | 1692 | $2,350 | $1.39 | 44d | 1 | 0.45mi |
| 3726 Copeland St Dallas, TX | 3.0 | 2.0 | 1298 | $1,690 | $1.30 | 6d | 1 | 0.51mi |
| 2847 Metropolitan Ave Dallas, TX | 3.0 | 1.0 | 1344 | $2,050 | $1.53 | 22d | 1 | 0.53mi |
| 2724 Swanson St Dallas, TX | 4.0 | 2.0 | 1368 | $2,350 | $1.72 | 44d | 1 | 0.54mi |
| 2720 Morning Ave Dallas, TX | 3.0 | 2.0 | 1332 | $2,350 | $1.76 | 44d | 1 | 0.57mi |
| 3801 Carpenter Ave Dallas, TX | 4.0 | 2.0 | 1454 | $2,400 | $1.65 | 44d | 1 | 0.59mi |
| 2811 Morning Ave Dallas, TX | 3.0 | 2.0 | 1634 | $2,200 | $1.35 | 15d | 1 | 0.59mi |
| 4014 Marshall Dr Dallas, TX | 4.0 | 2.0 | 1600 | $1,850 | $1.16 | 24d | 1 | 0.63mi |
| 3619 York St Dallas, TX | 3.0 | 2.0 | 1298 | $1,740 | $1.34 | 8d | 1 | 0.69mi |
| 4503 Bradshaw St Dallas, TX | 4.0 | 2.0 | 1263 | $1,600 | $1.27 | 8d | 1 | 0.71mi |
| 4621 Collins Ave Dallas, TX | 4.0 | 2.5 | 1700 | $2,350 | $1.38 | 44d | 1 | 0.82mi |
| 4706 Spring Ave Dallas, TX | 3.0 | 2.0 | 1287 | $3,900 | $3.03 | 44d | 1 | 0.89mi |
| 2507 Birmingham Ave Dallas, TX | 3.0 | 2.5 | 1516 | $2,500 | $1.65 | 24d | 1 | 0.95mi |
| 1333 S Fitzhugh Ave Dallas, TX | 4.0 | 2.0 | 1670 | $1,895 | $1.13 | 8d | 1 | 0.99mi |
| 3502 Edgewood St Dallas, TX | 4.0 | 2.0 | 1866 | $2,523 | $1.35 | 2d | 1 | 1.04mi |
| 2618 Carpenter Ave Dallas, TX | 4.0 | 3.0 | 2050 | $3,200 | $1.56 | 44d | 1 | 1.06mi |
| 2406 Merlin St Dallas, TX | 3.0 | 2.5 | 2004 | $2,500 | $1.25 | 8d | 1 | 1.17mi |
| 4934 Echo Ave Dallas, TX | 5.0 | 4.0 | 1815 | $2,900 | $1.60 | 44d | 1 | 1.22mi |
| 3521 S Harwood St Dallas, TX | 3.0 | 2.5 | 1750 | $2,700 | $1.54 | 3d | 1 | 1.22mi |
| 2840 Oakdale St Dallas, TX | 3.0 | 2.0 | 1379 | $1,900 | $1.38 | 44d | 1 | 1.24mi |
| 4807 Parry Ave Dallas, TX | 4.0 | 3.0 | 2024 | $2,800 | $1.38 | 44d | 1 | 1.25mi |
| 3413 Wendelkin St Dallas, TX | 3.0 | 2.5 | 1724 | $2,650 | $1.54 | 2d | 1 | 1.29mi |
| 2312 Stoneman St Dallas, TX | 4.0 | 3.0 | 2106 | $3,100 | $1.47 | 4d | 1 | 1.29mi |
| 5000 Linder Ave Dallas, TX | 3.0 | 2.0 | 1327 | $1,950 | $1.47 | 44d | 1 | 1.30mi |
| 4717 Garland Ave Dallas, TX | 3.0 | 2.5 | 2356 | $3,000 | $1.27 | 44d | 1 | 1.35mi |
| 5340 Dimple Jackson St Dallas, TX | 3.0 | 2.0 | 1298 | $1,864 | $1.44 | 6d | 1 | 1.39mi |
| 4024 Colonial Ave Dallas, TX | 4.0 | 2.0 | 1560 | $2,400 | $1.54 | 24d | 1 | 1.40mi |
| 4918 Garland Ave Dallas, TX | 3.0 | 2.5 | 1725 | $2,500 | $1.45 | 24d | 1 | 1.42mi |
| 4536 Birch St Dallas, TX | 4.0 | 2.0 | 1259 | $2,200 | $1.75 | 44d | 1 | 1.43mi |
| 4823 Ash Ln Dallas, TX | 4.0 | 2.0 | 1395 | $2,670 | $1.91 | 44d | 1 | 1.44mi |
| 709 S Munger Blvd Dallas, TX | 4.0 | 1.0 | 1610 | $2,100 | $1.30 | 8d | 1 | 1.45mi |
Listing history 14 events
-
2026-06-18days on market $285,000 Active 77 DOM
-
2026-06-17days on market $285,000 Active 76 DOM
-
2026-06-16days on market $285,000 Active 75 DOM
-
2026-06-15days on market $285,000 Active 74 DOM
-
2026-06-13days on market $285,000 Active 72 DOM
-
2026-06-09days on market $285,000 Active 68 DOM
-
2026-06-08days on market $285,000 Active 67 DOM
-
2026-06-07days on market $285,000 Active 66 DOM
-
2026-06-04days on market $285,000 Active 63 DOM
-
2026-06-03days on market $285,000 Active 62 DOM
-
2026-06-02days on market $285,000 Active 61 DOM
-
2026-06-01days on market $285,000 Active 60 DOM
-
2026-05-31days on market $285,000 Active 59 DOM
-
2026-04-02$285,000 Active 989-char remark
Show marketing remark (989 chars)
Welcome to your future new build home! 4-bedroom, 2-bath home located in the historic Mill City neighborhood. Nestled in vibrant South Dallas, this property offers unmatched proximity, long-term equity, and tremendous opportunity. Just minutes from Fair Park—future site of the 2026 World Cup—and with quick access to I-45 and I-30, getting around the city is a breeze. While most comparable 3- and 4-bedroom homes in the area are priced above $300K, this home offers potential instant equity, making it an ideal choice for buyers who've found homeownership just out of reach. There are 3 other homes with this floor plan being framed in the same area. Inquire with Agent. House included refrigerator, stove, microwave and dishwasher. No downpayment with preferred lender Cornerstone Home Lending and no mortgage insurance for qualifying buyers. See additional documents for preferred lender information, warranty, DHAP program details, and other grant opportunities.
ⓘ Source: listings_history table (triggers on properties + properties_extension) + one-shot
backfill from property_details.listing_events for pre-trigger history.
Tax reassessment forecast TX · Resets to sale price
- Current annual tax
- $1,208 · $101/mo
- Projected year-2 tax
- $5,216 · $435/mo
- Expected delta
- +$4,007/yr (+$334/mo · 331.7%)
ⓘ Screening estimate from a state-policy table — verify with the county assessor before closing.
Climate risk First Street
- Flood 4/10 Moderate FEMA zone X (unshaded) · 21% chance over 30 yrs
- Wildfire 3/10 Moderate
- Heat 7/10 Severe 7 d/yr ≥110°F today · 24 d/yr by 30 yrs out
- Wind 6/10 Major 27% chance of damaging wind over 30 yrs
- Air quality 3/10 Moderate 2 unhealthy d/yr today · 3 by 30 yrs out
Nearby sold comps map
Loading sold comps map…
Walkable amenities ~0.75 mi
Loading nearby amenities…
Taxation est. · year 1
- Rental income
- $26,727
- − Mortgage interest
- −$15,964
- − Property taxes
- −$1,208
- − Insurance
- −$1,425
- − Repairs & maintenance
- −$2,138
- − Management
- −$2,138
- − Depreciation
- −$8,291
- Taxable loss
- −$4,438
- Est. tax savings @ 24.0%
- +$1,065
- After-tax cash flow
- $1,611/yr
For passive investors: Depreciation is non-cash, so a rental often shows a tax loss while cash-flowing — sheltering income. Rental losses are passive: they offset passive income freely, and up to $25,000/yr can offset ordinary (W-2) income if you actively participate and your MAGI is under $100k (phasing out to $0 by $150k); unused losses carry forward. On sale, claimed depreciation is recaptured at up to 25%, and gains may owe capital-gains tax (a 1031 exchange can defer both). Figures are a year-1 estimate at your 24.0% rate — not tax advice; consult a CPA.
Schools (NCES district)
- District
- Dallas ISD
- NCES district ID
- 4816230
- Math proficiency
- 31% ▼ -16.00%
- Reading proficiency
- 36% ▼ -4.00%
- Median HH income
- $42,881
- Composite
- 28.41/100
- National rank
- #6763
- State rank
- #559 of 826 in TX
Livability — Dallas
- Score
- 81/100
- State rank
- #24
- US rank
- #1380
Category grades
Schools grade is shown separately in the Schools card above.
Census & demographics
- Census place
- Dallas, TX
- City population
- 1,168,437
- Population (ZIP)
- 7,458
Population outlook (Dallas County) Hauer SSP2
- Today (2025)
- 2,979,839 people
- By 2030
- 3,191,823 · +7.1%
- By 2040
- 3,619,611 · +21.5%
- By 2050
- 4,026,915 · +35.1%
- By 2075
- 4,957,073 · +66.4%
- By 2100
- 5,508,725 · +84.9%
Race, ethnicity, and origin ACS 2023
- Neighborhood character
- Majority Black (56%)
- Race & ethnicity
- Black 56% Hispanic / Latino 39% Two or more races 12% White 3% Asian 2%
- Hispanic origin (detail)
- Mexican 17%
- Foreign-born
- 23% · Canada, Vietnam
- Languages at home
- 66% English-only · Spanish 32% Vietnamese 2%
Political lean MEDSL · Dallas
- 2024 margin
- Strong D (+22.2) · D 60.2% · R 38.0% · Other 1.8%
- 2008→2024 swing
- +6.9pp toward D · 2008: 15.3pp · 2024: 22.2pp
- All cycles
- 2024: D+22.2 2020: D+31.6 2016: D+26.2 2012: D+15.4 2008: D+15.3
Not yet ingested
- Civics
- —
Market trends
- HPI YoY
- ▲ 1.07%
- Current HPI
- 177.2281
- Rent YoY
- —
- Metro
- —
- State GDP YoY
- ▲ 3.95%
- F500 in state
- 110
Industry mix (Fortune 500 HQ in TX)
| Industry | F500 HQs | Revenue |
|---|---|---|
| Energy | 16 | $1,198B |
|
||
| Technology | 5 | $198B |
|
||
| Engineering / Construction | 4 | $72B |
|
||
| Energy Services | 3 | $60B |
|
||
| Utilities | 3 | $41B |
|
||
| Healthcare | 2 | $330B |
|
||
Price history
1 event — show timeline
- 2026-04-02 Listed $285,000 NTREIS
Property tax history
+14.9%/yrLatest (2025): $1,208 · -0.4% YoY. Source: county tax records.
Cash-flow waterfall
monthlySold comps — $/sqft
last 12 mo · ≤1 miLoading sold comps…