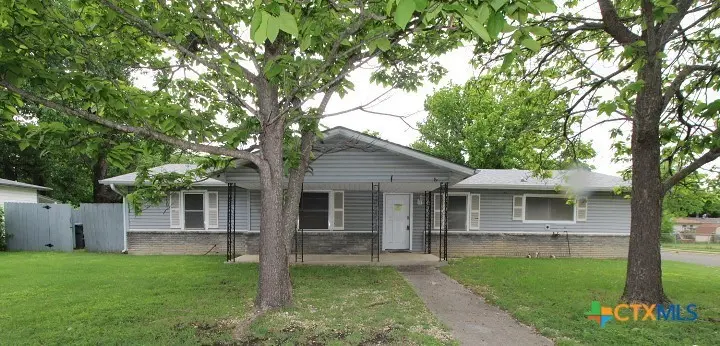
902 Mary St · Copperas Cove, TX
Flood risk 1/10 · Minimal
- FEMA flood zone
- X (unshaded)
- Chance of flooding over 30 yrs
- 0.0%
- Est. flood insurance / yr
- $507 – $1,088
Fire risk 6/10 · Moderate
- Est. fire insurance / yr
- $1,222 – $2,270
Heat risk 7/10 · Major
- Hot days now (above 106°F)
- 7 days/yr
- Hot days in 30 yrs
- 23 days/yr
Wind risk 6/10 · Moderate
- Chance of severe wind over 30 yrs
- 50.0%
Air-quality risk 1/10 · Minimal
- Unhealthy air days now
- 0 days/yr
- Unhealthy air days in 30 yrs
- 0 days/yr
Risk factors via First Street. Map © Google.
Why this score? — see what drove the C grade
The composite is a weighted blend of 9 inputs, each scored 0–100. Each bar is that input's sub-score; the figure is the points it added to the 100-point composite (weight × sub-score).
- Cash flow +17.6/30.0
- ARV discount +14.5/15.0
- 1% rule +5.6/10.0
- DSCR +5.5/10.0
- Schools +3.6/10.0
- Livability +3.2/5.0
- Condition / age +2.5/5.0
- Rent growth +2.4/5.0
- Appreciation +0.0/10.0
$115,000
🖨 Deal sheet (PDF) 📄 Offer letter ✓ Due diligence
Listing remarks MLS
Memories start here. Want peace of mind? Welcome to a great opportunity to achieve it! 3-bedroom, 1-bathroom home with a 1-oversized side entry carport. This traditional-style home is perfect for first-time homebuyers or savvy investors looking to expand their portfolio. Property is in a mature neighborhood and has a front stone finish that adds a unique and charming look to the home. It offers an eat-in kitchen large family room with fireplace and wood privacy fence around the backyard. Carpeting flooring. Come see for yourself and imagine the possibilities this home has to offer! You can't go wrong at this price!
Key facts
- Oversized yard
- 9,792 sq ft lot
- 2 parking spots
Tags
Neighborhood map
What this means for you Summary
Snapshot
- This is a 3-bed/1.0-bath single-family listed at $115k.
Deal economics
- At list price, monthly cash flow is $90 ($1k/yr) — positive.
- The deal already cash-flows at list — no discount required.
- Meets the 1% rule at list price ($1k rent vs $115k).
- Recommended offer: $108k (6.0% below list) — sets the bar for market timing.
- Cap rate 7.2% vs local median 3.4% in Copperas Cove — top-decile yield for the area; either an underpriced asset or a hidden risk that comps aren't pricing in. Stress-test before assuming the spread holds.
Location & tenants
- Location reads 65/100 on livability (#706 in TX) — a middle-class / working-renter tenant base. Strengths: cost of living A+, housing A+; Watch: schools C-, employment D+, amenities F.
- Copperas Cove ISD (suburban): math 41% / reading 42% proficiency, ranked #340 of 826 in TX (top 41%) — families likely to look elsewhere, expect single-tenant / working-renter base with shorter leases.
- Market conditions: Rents soft (-0.2%/yr); 608 active listings in the ZIP; 40 comparable units currently listed for rent nearby; rentals lingering (median 45d on market — plan ~5-8 weeks vacancy on turnover, expect pricing pressure); 68% of comp listings sitting > 30 days — soft ceiling on asking rent; 386 units permitted in Coryell County in 2024 (0 in 5+ unit buildings).
Forward outlook
- Local home prices are declining (-3.0%/yr); year-one equity from $795 of loan paydown is wiped out by about $3k of value loss. Plan a longer hold.
Negotiation context
- It's been on market 68 days — a 6% lower offer ($108k) is reasonable based on typical stale-listing flexibility.
- 6 sale attempts since 11y ago; this cycle's ask has dropped $20k (15%) from the opening price — seller is motivated, your offer sets the floor, not the list.
Risks & watch-outs
- Climate carrying-cost: major wind risk, 50% chance of damaging wind over 30y; major wildfire risk; extreme-heat days projected 7→23/yr by 2055 (HVAC capex compounding) — expect insurance premiums to compound above CPI over the hold.
Questions for the listing agent
- It's been on market 68 days. Have you received any prior offers? Is the seller open to a 6% concession, seller financing, or rate buy-down credit?
- Built in 1962 — when were the roof, HVAC, electrical panel, plumbing, and water heater last replaced?
- Why hasn't it sold? Are there any deal-killer items the seller is aware of (foundation, flood, title, zoning, code violations)?
- Is there a deadline driving the sale (1031 exchange, divorce, estate, relocation)? That informs how much negotiation room exists.
- What's the average days-on-market for RENTAL listings here right now (not sales)? A rising rental-DOM trend means longer vacancies and softer asking-rent achievability than the comps imply.
- What's the recent tenant-quality profile in this submarket — average credit score on applications, eviction rate, late-payment / NSF rate, and stable-employment percentage? A property-management company in the area should have these aggregated.
- How much new for-sale + rental construction is in the pipeline within 1–3 miles? Heavy new supply typically softens prices + rents 12–24 months out; constrained supply supports both.
Investment metrics
- 1% rule
- 1.06% ✓
- Cap rate
- 7.23%
- Cash-on-cash
- 3.36%
- DSCR
- 1.15
- GRM
- 7.8
CMA / ARV
- ARV (median comp)
- $136,354
- List price
- $115,000
- Delta
- -15.66%
- Verdict
- UNDERPRICED
- Comps
- 20 within 1.0 mi
Show comp detail 12 sales within ~0.75 mi
| Address | Dist | Beds/Ba | Sqft | Sold | Price | $/sf | Match |
|---|---|---|---|---|---|---|---|
| 609 S 11th St | 0.24mi | 2/1.0 (-1) | 1,464 (-0%) | 3mo | $83,000 | $57 | 80 |
| 802 S 23rd St | 0.49mi | 3/1.5 | 1,506 (+2%) | 1mo | $93,730 | $62 | 70 |
| 208 N 2nd St | 0.66mi | 3/2.0 | 1,476 (+0%) | 2mo | $160,000 | $108 | 63 |
| 1107 Deorsam Dr | 0.63mi | 3/2.0 | 1,485 (+1%) | 5mo | $172,200 | $116 | 61 |
| 1001 Gilmore St | 0.47mi | 3/2.0 | 1,575 (+7%) | 4mo | $167,000 | $106 | 59 |
| 2110 Terrace Dr | 0.74mi | 3/1.0 | 1,377 (-6%) | 4mo | $165,000 | $120 | 52 |
| 910 Leonhard St | 0.50mi | 4/1.0 (+1) | 1,287 (-12%) | 1mo | $125,000 | $97 | 50 |
| 902 Holly St | 0.63mi | 3/2.0 | 1,606 (+9%) | 4mo | $115,000 | $72 | 48 |
| 904 Randa St | 0.59mi | 4/2.0 (+1) | 1,638 (+11%) | 4mo | $234,000 | $143 | 41 |
| 1602 Phyllis Dr | 0.68mi | 4/2.0 (+1) | 1,623 (+10%) | 1mo | $135,000 | $83 | 41 |
| 2004 Veterans Ave | 0.62mi | 4/1.5 (+1) | 1,286 (-12%) | 3mo | $160,000 | $124 | 40 |
| 1303 Little St | 0.69mi | 3/2.0 | 1,258 (-14%) | 1mo | $175,000 | $139 | 39 |
Match score weights: distance 35% · size 25% · config 20% · recency 20%. Top-matched comps best support the ARV.
Projected returns pro-forma
-3.0% appreciation · 0.0% rent growth · sell at horizon
- IRR
- -14.7%
- Equity multiple
- 0.49×
- Total profit
- $-16,411
- Equity at exit
- $17,147
- IRR
- -12.7%
- Equity multiple
- 0.36×
- Total profit
- $-20,482
- Equity at exit
- $9,943
Cash invested: $32,200 (down + closing). Projections, not guarantees.
Landlord ↔ Tenant lean methodology
- Overall (STATE)
- 87 Strongly Landlord-Friendly
- State Texas
- 87 Strongly Landlord-Friendly · R+5
- County
- — inherits STATE
- City
- — inherits STATE
ZIP-level market 76522
- Home prices YoY
- -22.4%
- Rents YoY
- -0.2%
- Active inventory
- 608
- Price-to-rent
- 7.8×
Monthly cashflow live
- Estimated rent
- $1,225 high interval (Pro) →
- Mortgage (P&I)
- −$603
- Tax from tax record
- −$226 /mo · $2,714/yr
- Insurance
- −$48
- HOA
- −$0
- Vacancy / Maint / Mgmt
- −$257
- Net cashflow
- $90
Break-even live
Sensitivity live
| Price | -10% $155 | -5% $123 | +0% $90 | +5% $58 | +10% $25 |
|---|---|---|---|---|---|
| Rent | -10% $-7 | -5% $42 | +0% $90 | +5% $139 | +10% $187 |
| Rate | -1.0pp $148 | -0.5pp $119 | base $90 | +0.5pp $60 | +1.0pp $30 |
UW: 25.0% down · 7.5% · 30yr · 1.5% tax · 5.0% vac · 8.0% maint · 8.0% mgmt
Financing live
Cash to close
- Down payment
- $28,750
- Closing costs
- $3,450
- Reserves months
- —
- Total cash needed
- —
Loan-product check · same deal, 3 products live
Conventional
25% down · 7.5% · 30yr
- Down + closing
- —
- Monthly P&I
- —
- Monthly cashflow
- —
- DSCR
- —
- Eligible?
- —
Personal DTI + credit; lowest rate.
DSCR
20% down · 8.5% · 30yr
- Down + closing
- —
- Monthly P&I
- —
- Monthly cashflow
- —
- DSCR
- —
- Eligible?
- —
No personal income docs; deal must DSCR.
Hard money
10% down · 12.0% · 12mo
- Down + closing
- —
- Monthly P&I
- —
- Monthly cashflow
- —
- DSCR
- —
- Eligible?
- —
Short-term bridge; refi at stabilization.
Rent comps 40 comps
| Address | Beds | Baths | Sqft | Rent | $/sqft | DOM | Units | Dist |
|---|---|---|---|---|---|---|---|---|
| 904 Mary St Copperas Cove, TX | 3.0 | 2.0 | 1041 | $1,052 | $1.01 | 44d | 1 | 0.01mi |
| 808 Mary St Copperas Cove, TX | 3.0 | 1.0 | 1028 | $1,300 | $1.26 | 44d | 1 | 0.05mi |
| 1004 S 3rd St Copperas Cove, TX | 3.0 | 1.0 | 940 | $950 | $1.01 | 24d | 1 | 0.08mi |
| 1010 Georgetown Rd Copperas Cove, TX | 3.0 | 1.0 | 1018 | $995 | $0.98 | 44d | 1 | 0.10mi |
| 504 Highway Ave Unit B Copperas Cove, TX | 2.0 | 1.0 | 1500 | $700 | $0.47 | 44d | 1 | 0.14mi |
| 1005 S 11th St Copperas Cove, TX | 4.0 | 2.0 | 1236 | $1,090 | $0.88 | 44d | 1 | 0.21mi |
| 1202 S 3rd St Copperas Cove, TX | 3.0 | 2.0 | 1056 | $1,175 | $1.11 | 44d | 1 | 0.22mi |
| 1204 S 7th St Copperas Cove, TX | 3.0 | 2.0 | 1202 | $1,295 | $1.08 | 44d | 1 | 0.25mi |
| 1201 S 9th St Copperas Cove, TX | 3.0 | 2.0 | 1172 | $1,100 | $0.94 | 24d | 1 | 0.26mi |
| 915 S 15th St Copperas Cove, TX | 3.0 | 2.0 | 1008 | $850 | $0.84 | 14d | 1 | 0.29mi |
| 604 S 11th St Copperas Cove, TX | 3.0 | 2.0 | 1119 | $1,300 | $1.16 | 44d | 1 | 0.31mi |
| 607 Curry Ave Copperas Cove, TX | 3.0 | 1.5 | 1192 | $935 | $0.78 | 24d | 1 | 0.34mi |
| 403 S 7th St Copperas Cove, TX | 3.0 | 1.0 | 910 | $1,100 | $1.21 | 44d | 1 | 0.38mi |
| 903 Curry Ave Copperas Cove, TX | 3.0 | 2.5 | 1285 | $1,200 | $0.93 | 24d | 1 | 0.41mi |
| 1005 S 19th St Copperas Cove, TX | 3.0 | 1.5 | 1356 | $1,100 | $0.81 | 44d | 1 | 0.41mi |
| 204 West Avenue F Unit A Copperas Cove, TX | 2.0 | 1.0 | 895 | $725 | $0.81 | 44d | 1 | 0.42mi |
| 502 S 9th St Copperas Cove, TX | 3.0 | 1.5 | 1479 | $1,150 | $0.78 | 44d | 1 | 0.42mi |
| 603 Westview Cir Unit A Copperas Cove, TX | 2.0 | 1.0 | 1537 | $700 | $0.46 | 44d | 1 | 0.42mi |
| 204 West Avenue F Unit B Copperas Cove, TX | 2.0 | 1.0 | 895 | $705 | $0.79 | 44d | 1 | 0.42mi |
| 1006 S 21st St Copperas Cove, TX | 4.0 | 2.0 | 1445 | $1,100 | $0.76 | 44d | 1 | 0.49mi |
| 1202 S FM 116 Copperas Cove, TX | 1.0–3.0 | 1.0–2.0 | 922 | $1,560 | $1.69 | 14d | 12 | 0.50mi |
| 1208 S 19th St Copperas Cove, TX | 3.0 | 1.5 | 1010 | $1,525 | $1.51 | 24d | 1 | 0.50mi |
| 914 Chalk St Copperas Cove, TX | 3.0 | 2.0 | 1107 | $1,200 | $1.08 | 24d | 1 | 0.54mi |
| 806 S 25th St Copperas Cove, TX | 3.0 | 2.0 | 1400 | $1,400 | $1.00 | 44d | 1 | 0.55mi |
| 412 West Avenue C Unit C Copperas Cove, TX | 3.0 | 2.0 | 1343 | $1,600 | $1.19 | 22d | 1 | 0.60mi |
| 414 West Avenue C Unit C Copperas Cove, TX | 3.0 | 2.0 | 1343 | $1,600 | $1.19 | 44d | 1 | 0.60mi |
| 1302 S 23rd St Copperas Cove, TX | 4.0 | 1.5 | 1453 | $1,320 | $0.91 | 44d | 1 | 0.62mi |
| 509 West Avenue B Copperas Cove, TX | 3.0 | 2.0 | 1339 | $1,175 | $0.88 | 24d | 1 | 0.64mi |
| 2104 Brantley Ave Copperas Cove, TX | 3.0 | 1.0 | 1140 | $1,495 | $1.31 | 44d | 1 | 0.66mi |
| 1007 S 29th St Copperas Cove, TX | 3.0 | 2.0 | 1176 | $1,400 | $1.19 | 14d | 1 | 0.68mi |
| 1307 Sherry Ln Unit B Copperas Cove, TX | 2.0 | 1.0 | 1775 | $1,299 | $0.73 | 44d | 1 | 0.77mi |
| 1008 S 31st St Copperas Cove, TX | 3.0 | 2.0 | 1350 | $1,145 | $0.85 | 14d | 1 | 0.78mi |
| 902 Lynn Ln Copperas Cove, TX | 3.0 | 2.0 | 1661 | $1,600 | $0.96 | 14d | 1 | 0.81mi |
| 204 South Dr Unit A Copperas Cove, TX | 2.0 | 1.0 | 895 | $999 | $1.12 | 44d | 1 | 0.82mi |
| 309 Myra Lou Ave Copperas Cove, TX | 3.0 | 2.0 | 1269 | $1,125 | $0.89 | 44d | 1 | 0.83mi |
| 604 N Main St Apt C Copperas Cove, TX | 2.0 | 1.5 | 1000 | $750 | $0.75 | 44d | 1 | 0.89mi |
| 604 N Main St Apt D Copperas Cove, TX | 3.0 | 1.5 | 1100 | $900 | $0.82 | 44d | 1 | 0.89mi |
| 605 N 11th St Copperas Cove, TX | 3.0 | 2.0 | 1432 | $1,575 | $1.10 | 44d | 1 | 0.91mi |
| 204 W Truman Ave Unit D Copperas Cove, TX | 2.0 | 1.0 | 895 | $800 | $0.89 | 44d | 1 | 0.93mi |
| 105 E Reagan Ave Copperas Cove, TX | 2.0 | 1.0 | 1758 | $675 | $0.38 | 44d | 1 | 0.94mi |
Listing history 34 events
-
2026-06-21days on market $115,000 Active 68 DOM
-
2026-06-18days on market $115,000 Active 65 DOM
-
2026-06-17pricedays on market $115,000 Active 64 DOM
-
2026-06-16days on market $125,000 Active 63 DOM
-
2026-06-15days on market $125,000 Active 62 DOM
-
2026-06-14days on market $125,000 Active 60 DOM
-
2026-06-13days on market $125,000 Active 59 DOM
-
2026-06-10days on market $125,000 Active 57 DOM
-
2026-06-09days on market $125,000 Active 56 DOM
-
2026-06-08days on market $125,000 Active 55 DOM
-
2026-06-07days on market $125,000 Active 54 DOM
-
2026-06-05days on market $125,000 Active 51 DOM
-
2026-06-03days on market $125,000 Active 50 DOM
-
2026-06-02days on market $125,000 Active 49 DOM
-
2026-06-01days on market $125,000 Active 48 DOM
-
2026-05-31days on market $125,000 Active 47 DOM
-
2026-05-30days on market $125,000 Active 46 DOM
-
2026-05-16price $125,000 622-char remark
Show marketing remark (622 chars)
Memories start here. Want peace of mind? Welcome to a great opportunity to achieve it! 3-bedroom, 1-bathroom home with a 1-oversized side entry carport. This traditional-style home is perfect for first-time homebuyers or savvy investors looking to expand their portfolio. Property is in a mature neighborhood and has a front stone finish that adds a unique and charming look to the home. It offers an eat-in kitchen large family room with fireplace and wood privacy fence around the backyard. Carpeting flooring. Come see for yourself and imagine the possibilities this home has to offer! You can't go wrong at this price!
-
2026-04-14$135,000 Active 622-char remark
Show marketing remark (622 chars)
Memories start here. Want peace of mind? Welcome to a great opportunity to achieve it! 3-bedroom, 1-bathroom home with a 1-oversized side entry carport. This traditional-style home is perfect for first-time homebuyers or savvy investors looking to expand their portfolio. Property is in a mature neighborhood and has a front stone finish that adds a unique and charming look to the home. It offers an eat-in kitchen large family room with fireplace and wood privacy fence around the backyard. Carpeting flooring. Come see for yourself and imagine the possibilities this home has to offer! You can't go wrong at this price!
-
2022-10-11soldstatus
-
2022-09-16status Pending
-
2022-09-15status Active
-
2022-09-14status Pending
-
2022-09-12status Active
-
2022-09-08status Pending
-
2022-08-28status Active
-
2022-08-13status Pending
-
2022-08-04price $159,000
-
2022-07-22price $165,000
-
2022-07-08price $172,000
-
2022-06-21$175,000 Active
-
2022-06-08soldstatus
-
2015-05-28soldstatus
-
2015-03-23$79,900
ⓘ Source: listings_history table (triggers on properties + properties_extension) + one-shot
backfill from property_details.listing_events for pre-trigger history.
Tax reassessment forecast TX · Resets to sale price
- Current annual tax
- $2,714 · $226/mo
- Projected year-2 tax
- $2,714 · $226/mo
- Expected delta
- $0/yr ($0/mo · 0.0%)
ⓘ Screening estimate from a state-policy table — verify with the county assessor before closing.
Climate risk First Street
- Flood 1/10 Low FEMA zone X (unshaded) · 0% chance over 30 yrs
- Wildfire 6/10 Major
- Heat 7/10 Severe 7 d/yr ≥106°F today · 23 d/yr by 30 yrs out
- Wind 6/10 Major 50% chance of damaging wind over 30 yrs
- Air quality 1/10 Low 0 unhealthy d/yr today · 0 by 30 yrs out
Nearby sold comps map
Loading sold comps map…
Walkable amenities ~0.75 mi
Loading nearby amenities…
Taxation est. · year 1
- Rental income
- $14,694
- − Mortgage interest
- −$6,442
- − Property taxes
- −$2,714
- − Insurance
- −$575
- − Repairs & maintenance
- −$1,176
- − Management
- −$1,176
- − Depreciation
- −$3,345
- Taxable loss
- −$733
- Est. tax savings @ 24.0%
- +$176
- After-tax cash flow
- $1,258/yr
For passive investors: Depreciation is non-cash, so a rental often shows a tax loss while cash-flowing — sheltering income. Rental losses are passive: they offset passive income freely, and up to $25,000/yr can offset ordinary (W-2) income if you actively participate and your MAGI is under $100k (phasing out to $0 by $150k); unused losses carry forward. On sale, claimed depreciation is recaptured at up to 25%, and gains may owe capital-gains tax (a 1031 exchange can defer both). Figures are a year-1 estimate at your 24.0% rate — not tax advice; consult a CPA.
Schools (NCES district)
- District
- Copperas Cove ISD
- NCES district ID
- 4815240
- Math proficiency
- 41% ▼ -6.00%
- Reading proficiency
- 42% ▼ -2.00%
- Median HH income
- $51,072
- Composite
- 35.85/100
- National rank
- #4822
- State rank
- #340 of 826 in TX
Livability — Copperas Cove
- Score
- 65/100
- State rank
- #706
- US rank
- #13158
Category grades
Schools grade is shown separately in the Schools card above.
Census & demographics
- Census place
- Copperas Cove, TX
- County
- Coryell County · 61,053 people
- City population
- 42,118
- Metro
- Killeen-Temple, TX
- Population (ZIP)
- 42,118
- Household income
- $72,206
- Rent vs Own
- Severe rent burden
- 1019.0
Population outlook (Coryell County) Hauer SSP2
- Today (2025)
- 75,485 people
- By 2030
- 75,627 · +0.2%
- By 2040
- 74,898 · -0.8%
- By 2050
- 74,221 · -1.7%
- By 2075
- 72,688 · -3.7%
- By 2100
- 66,862 · -11.4%
Race, ethnicity, and origin ACS 2023
- Neighborhood character
- Diverse neighborhood (Simpson 0.66)
- Race & ethnicity
- White 53% Hispanic / Latino 21% Two or more races 20% Black 14% Asian 2%
- Hispanic origin (detail)
- Mexican 11% Puerto Rican 6%
- Common ancestry
- Romanian 2% Italian 2% Lithuanian 2%
- Foreign-born
- 7% · Canada, South Korea
- Languages at home
- 85% English-only · Spanish 10% German/W. Germanic 2% Other Asian/Pacific 1%
Political lean MEDSL · Coryell
- 2024 margin
- Solid R (+40.7) · D 29.1% · R 69.8% · Other 1.1%
- 2008→2024 swing
- -13.8pp toward R · 2008: -26.9pp · 2024: -40.7pp
- All cycles
- 2024: R+40.7 2020: R+33.5 2016: R+39.5 2012: R+36.6 2008: R+26.9
Not yet ingested
- Civics
- —
Market trends
- HPI YoY
- ▼ -53.11%
- Current HPI
- 183.9452
- Rent YoY
- ▼ -0.25%
- Metro
- Killeen-Temple, TX
- State GDP YoY
- ▲ 3.95%
- F500 in state
- 110
Industry mix (Fortune 500 HQ in TX)
| Industry | F500 HQs | Revenue |
|---|---|---|
| Energy | 16 | $1,198B |
|
||
| Technology | 5 | $198B |
|
||
| Engineering / Construction | 4 | $72B |
|
||
| Energy Services | 3 | $60B |
|
||
| Utilities | 3 | $41B |
|
||
| Healthcare | 2 | $330B |
|
||
Price history
+56.4% since first listed17 events — show timeline
- 2026-05-16 Price Changed $125,000 CTXMLS
- 2026-04-14 Listed $135,000 CTXMLS
- 2022-10-11 Sold (Public Records) — Public Records
- 2022-09-16 Pending — CTXMLS
- 2022-09-15 Relisted — CTXMLS
- 2022-09-14 Pending — CTXMLS
- 2022-09-12 Relisted — CTXMLS
- 2022-09-08 Pending — CTXMLS
- 2022-08-28 Relisted — CTXMLS
- 2022-08-13 Pending — CTXMLS
- 2022-08-04 Price Changed $159,000 CTXMLS
- 2022-07-22 Price Changed $165,000 CTXMLS
- 2022-07-08 Price Changed $172,000 CTXMLS
- 2022-06-21 Listed $175,000 CTXMLS
- 2022-06-08 Sold (Public Records) — Public Records
- 2015-05-28 Sold (Public Records) — Public Records
- 2015-03-23 Listed $79,900 CTXMLS
Property tax history
+5.1%/yrLatest (2025): $2,714 · +1.1% YoY. Source: county tax records.
Cash-flow waterfall
monthlySold comps — $/sqft
last 12 mo · ≤1 miLoading sold comps…