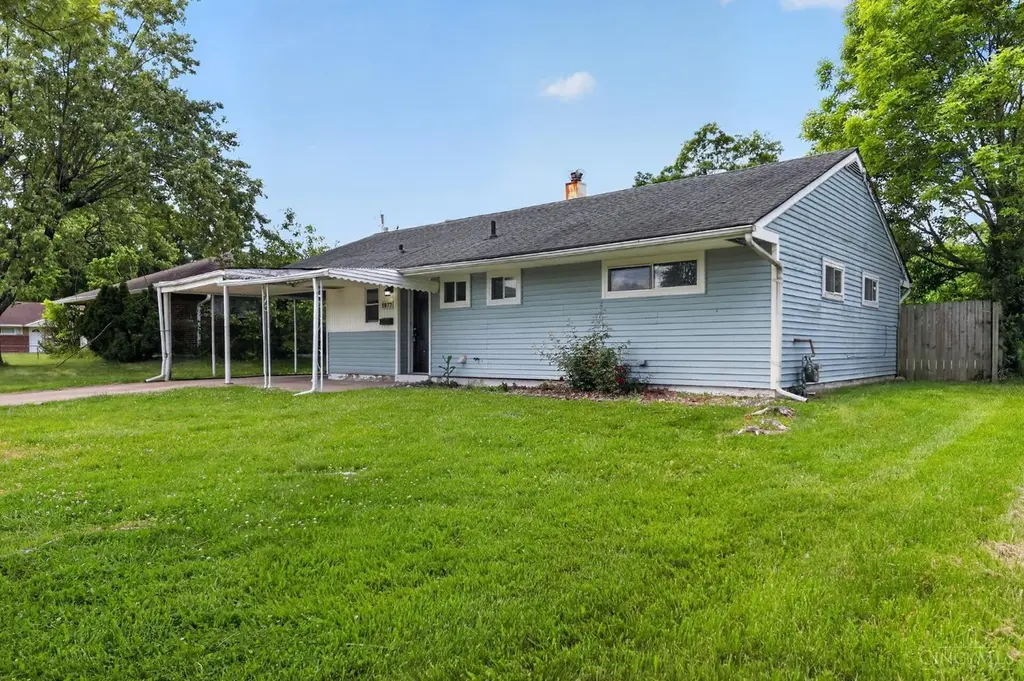
8877 Balboa Dr · Finneytown, OH
Flood risk 1/10 · Minimal
- FEMA flood zone
- X (unshaded)
- Chance of flooding over 30 yrs
- 0.0%
- Est. flood insurance / yr
- $507 – $1,088
Fire risk 1/10 · Minimal
- Est. fire insurance / yr
- $713 – $1,323
Heat risk 4/10 · Minor
- Hot days now (above 103°F)
- 7 days/yr
- Hot days in 30 yrs
- 19 days/yr
Wind risk 2/10 · Minimal
- Chance of severe wind over 30 yrs
- 1.0%
Air-quality risk 3/10 · Minor
- Unhealthy air days now
- 2 days/yr
- Unhealthy air days in 30 yrs
- 3 days/yr
Risk factors via First Street. Map © Google.
Why this score? — see what drove the C+ grade
The composite is a weighted blend of 9 inputs, each scored 0–100. Each bar is that input's sub-score; the figure is the points it added to the 100-point composite (weight × sub-score).
- Cash flow +21.5/30.0
- ARV discount +15.0/15.0
- DSCR +6.9/10.0
- 1% rule +5.4/10.0
- Rent growth +4.2/5.0
- Livability +4.1/5.0
- Condition / age +2.5/5.0
- Schools +1.6/10.0
- Appreciation +0.0/10.0
$164,900
🖨 Deal sheet 📄 Offer letter ✓ Due diligence
Listing remarks
Welcome to 8877 Balboa Dr, Springfield Township, OH 45231, a well-maintained 3-bedroom, 1-bath home located in a quiet residential neighborhood. This home offers a functional and inviting layout with comfortable living spaces designed for everyday convenience. The main level provides a spacious living area, a practical kitchen setup, and three well-sized bedrooms, making it suitable for families, first-time buyers, or investors. Situated in Springfield Township, the property benefits from a peaceful suburban setting while still offering easy access to nearby schools, parks, shopping, and major highways for a smooth commute throughout the Cincinnati area. With strong rental demand in the reg
Key facts
- Spacious living area
- Functional layout
- 7,057 sq ft lot
Tags
Property features AI
Finance
- Other: Residential zoning
- HOA & community: No HOA
Exterior
- Parking: Attached carport (1 carport space); Driveway parking; On-street parking
- Utilities: Public water; Public sewer; Natural gas; Electric service (standard)
- Home design: Traditional single-family home; One story
- Construction: Slab foundation
- Exterior features: Shingle roof; Aluminum windows; Aluminum siding and brick exterior; Property under 0.5 acre (approximately 0.162 acres)
Interior
- Kitchen: Laminate flooring in the kitchen; Oven/Range; Refrigerator
- Bedrooms: Three bedrooms, all on level 1; Primary bedroom about 13 x 12; Second bedroom about 12 x 10; Third bedroom about 10 x 8
- Flooring: Laminate floors in living room and kitchen
- Bathrooms: One full bathroom on level 1
- Heating & cooling: Forced air heating; Central air conditioning; Gas water heating; Natural gas service
- Interior features: Five total rooms; Attic storage; Recessed lights; Cable ready; Smoke alarm
- Laundry & utility: Slab foundation (utility access at slab)
Neighborhood map
What this means for you Summary
Snapshot
- This is a 3-bed/1.5-bath single-family listed at $165k.
Deal economics
- At list price, monthly cash flow is $247 ($3k/yr) — positive.
- The deal already cash-flows at list — no discount required.
- Meets the 1% rule at list price ($2k rent vs $165k).
- Recommended offer: $162k (1.5% below list) — sets the bar for market timing.
- Cap rate 8.1% vs local median 5.3% in Finneytown — top-decile yield for the area; either an underpriced asset or a hidden risk that comps aren't pricing in. Stress-test before assuming the spread holds.
Location & tenants
- Location reads 82/100 on livability (#70 in OH, #1,092 nationally) — a professional / high-income tenant draw. Strengths: commute A+, cost of living A+, housing A+; Watch: amenities C-.
- Mt Healthy City (suburban): math 12% / reading 24% proficiency, ranked #636 of 656 in OH (top 97%) — low school quality limits family demand, transient renter base, plan for 1-2y turnover; 75% free/reduced lunch — lower-income household profile, screen leases tightly.
- Market conditions: Rents rising fast (+6.9%/yr); 85 active listings in the ZIP; 13 comparable units currently listed for rent nearby; rentals at typical pace (median 22d on market — plan ~3-4 weeks tenant-placement turnaround); 801 units permitted in Hamilton County in 2024 (190 in 5+ unit buildings).
Forward outlook
- Local home prices are declining (-3.0%/yr); year-one equity from $1k of loan paydown is wiped out by about $5k of value loss. Plan a longer hold.
- At projected returns (-3.0% appreciation + 6.9% rent growth), your $46k cash investment doubles in ~9 years — after that, you're playing with house money.
Negotiation context
- It's been on market 29 days — a 2% lower offer ($162k) is reasonable based on typical stale-listing flexibility.
- 8 sale attempts since 30y ago with the ask held roughly flat each time — persistent listings suggest the price (not the market) is what's stuck; bring a comps-based counter.
Risks & watch-outs
- Watch-outs: built in 1954 — expect roof / HVAC / electrical / plumbing capex.
Questions for the listing agent
- Built in 1954 — when were the roof, HVAC, electrical panel, plumbing, and water heater last replaced?
- Is there a deadline driving the sale (1031 exchange, divorce, estate, relocation)? That informs how much negotiation room exists.
- Schools are A-rated — typically a magnet for longer-tenancy family renters. What's the average tenant stay here, and is there a school-zone premium baked into asking?
- What's the average days-on-market for RENTAL listings here right now (not sales)? A rising rental-DOM trend means longer vacancies and softer asking-rent achievability than the comps imply.
- What's the recent tenant-quality profile in this submarket — average credit score on applications, eviction rate, late-payment / NSF rate, and stable-employment percentage? A property-management company in the area should have these aggregated.
- How much new for-sale + rental construction is in the pipeline within 1–3 miles? Heavy new supply typically softens prices + rents 12–24 months out; constrained supply supports both.
Investment metrics
- 1% rule
- 1.04% ✓
- Cap rate
- 8.09%
- Cash-on-cash
- 6.41%
- DSCR
- 1.29
- GRM
- 8.0
CMA / ARV
- ARV (on-the-fly)
- $198,730
- Comps found
- 12
Show comp detail 12 sales within ~0.75 mi
| Address | Dist | Beds/Ba | Sqft | Sold | Price | $/sf | Match |
|---|---|---|---|---|---|---|---|
| 1309 Aldrich Ave | 0.25mi | 3/1.5 | 1,169 (0%) | 1mo | $195,000 | $167 | 88 |
| 8793 Balboa Dr | 0.14mi | 3/1.0 | 1,215 (+4%) | 0mo | $134,000 | $110 | 85 |
| 8997 Monsanto Dr | 0.21mi | 3/2.0 | 1,116 (-4%) | 1mo | $226,000 | $203 | 80 |
| 8791 Grenada Dr | 0.17mi | 3/1.5 | 1,080 (-8%) | 0mo | $125,000 | $116 | 79 |
| 1175 Madeleine Cir | 0.18mi | 4/1.5 (+1) | 1,258 (+8%) | 0mo | $235,000 | $187 | 74 |
| 1144 Hempstead Dr | 0.39mi | 3/1.0 | 1,110 (-5%) | 2mo | $200,000 | $180 | 70 |
| 9265 Rambler Pl | 0.61mi | 3/1.5 | 1,172 (+0%) | 2mo | $220,000 | $188 | 70 |
| 7352 Clovernook Ave | 0.29mi | 3/1.0 | 1,070 (-8%) | 2mo | $165,000 | $154 | 69 |
| 8609 Balboa Dr | 0.31mi | 3/1.0 | 1,080 (-8%) | 3mo | $184,000 | $170 | 68 |
| 1488 Hill Ave | 0.73mi | 3/1.0 | 1,199 (+3%) | 2mo | $131,000 | $109 | 58 |
| 1283 Bellune Dr | 0.64mi | 3/2.0 | 1,064 (-9%) | 3mo | $220,000 | $207 | 51 |
| 1458 Van Fleet Ave | 0.56mi | 4/1.0 (+1) | 1,295 (+11%) | 1mo | $192,000 | $148 | 48 |
Match score weights: distance 35% · size 25% · config 20% · recency 20%. Top-matched comps best support the ARV.
Projected returns pro-forma
-3.0% appreciation · 6.92% rent growth · sell at horizon
- IRR
- -2.2%
- Equity multiple
- 0.91×
- Total profit
- $-3,955
- Equity at exit
- $24,587
- IRR
- 11.3%
- Equity multiple
- 2.04×
- Total profit
- $48,170
- Equity at exit
- $14,258
Cash invested: $46,172 (down + closing). Projections, not guarantees.
Landlord ↔ Tenant lean methodology
- Overall (STATE)
- 73 Landlord-Friendly
- State Ohio
- 73 Landlord-Friendly · R+6
- County
- — inherits STATE
- City
- — inherits STATE
ZIP-level market 45231
- Rents YoY
- 6.9%
- Active inventory
- 85
- Price-to-rent
- 8.0×
Monthly cashflow live
- Estimated rent
- $1,719 high interval (Pro) →
- Mortgage (P&I)
- −$865
- Tax from tax record
- −$178 /mo · $2,133/yr
- Insurance
- −$69
- HOA
- −$0
- Vacancy / Maint / Mgmt
- −$361
- Net cashflow
- $247
Break-even live
UW: 25.0% down · 7.5% · 30yr · 1.5% tax · 5.0% vac · 8.0% maint · 8.0% mgmt
Financing live
Cash to close
- Down payment
- $41,225
- Closing costs
- $4,947
- Reserves months
- —
- Total cash needed
- —
Loan-product check · same deal, 3 products live
Conventional
25% down · 7.5% · 30yr
- Down + closing
- —
- Monthly P&I
- —
- Monthly cashflow
- —
- DSCR
- —
- Eligible?
- —
Personal DTI + credit; lowest rate.
DSCR
20% down · 8.5% · 30yr
- Down + closing
- —
- Monthly P&I
- —
- Monthly cashflow
- —
- DSCR
- —
- Eligible?
- —
No personal income docs; deal must DSCR.
Hard money
10% down · 12.0% · 12mo
- Down + closing
- —
- Monthly P&I
- —
- Monthly cashflow
- —
- DSCR
- —
- Eligible?
- —
Short-term bridge; refi at stabilization.
Rent comps 13 comps
| Address | Beds | Baths | Sqft | Rent | $/sqft | DOM | Units | Dist |
|---|---|---|---|---|---|---|---|---|
| 9029 Daly Rd Unit 8963 Cincinnati, OH | 3.0 | 2.5 | 1315 | $1,771 | $1.35 | 21d | 1 | 0.14mi |
| 8565 Daly Rd Unit 8565 5 Cincinnati, OH | 2.0 | 1.0 | 1100 | $1,299 | $1.18 | 23d | 1 | 0.42mi |
| 7701 Clovernook Ave Cincinnati, OH | 1.0–2.0 | 1.0–1.5 | 787 | $1,365 | $1.73 | 23d | 1 | 0.43mi |
| 1015 Thunderbird Ave Cincinnati, OH | 3.0 | 1.5 | 1494 | $2,146 | $1.44 | 43d | 1 | 0.74mi |
| 1522 Kinney Ave Cincinnati, OH | 3.0 | 1.0 | 1282 | $1,695 | $1.32 | 17d | 1 | 0.74mi |
| 1522 Kinney Ave Cincinnati, OH | 3.0 | 1.0 | 1282 | $1,095 | $0.85 | 23d | 1 | 0.74mi |
| 7601 Hamilton Ave Unit 2-3 Cincinnati, OH | 2.0 | 1.0 | 1250 | $2,000 | $1.60 | 23d | 1 | 0.96mi |
| 1667 Lakenoll Dr Mt Healthy, OH | 1.0–2.0 | 1.0–1.5 | 817 | $1,385 | $1.69 | 3d | 7 | 1.02mi |
| 8240 Galbraith Point Ln Cincinnati, OH | 2.0–3.0 | 1.5–2.5 | 1241 | $2,249 | $1.81 | 1d | 7 | 1.21mi |
| 1740 Bising Ave North College Hill, OH | 3.0 | 2.0 | 1235 | $1,697 | $1.37 | 1d | 6 | 1.22mi |
| 1604 W Galbraith Rd Unit F North College Hill, OH | 2.0 | 1.0 | 1250 | $1,150 | $0.92 | 14d | 1 | 1.27mi |
| 7032 La Boiteaux Ave Cincinnati, OH | 4.0 | 1.0 | 1200 | $1,800 | $1.50 | 23d | 1 | 1.39mi |
| 777 W Galbraith Rd Cincinnati, OH | 3.0 | 1.0 | 961 | $1,700 | $1.77 | 16d | 1 | 1.40mi |
Listing history 33 events
-
2026-06-18days on market $164,900 Active 29 DOM
-
2026-06-17days on market $164,900 Active 28 DOM
-
2026-06-16days on market $164,900 Active 27 DOM
-
2026-06-15days on market $164,900 Active 26 DOM
-
2026-06-13days on market $164,900 Active 24 DOM
-
2026-06-13days on market $164,900 Active 23 DOM
-
2026-06-09days on market $164,900 Active 20 DOM
-
2026-06-08days on market $164,900 Active 19 DOM
-
2026-06-07days on market $164,900 Active 18 DOM
-
2026-06-05days on market $164,900 Active 15 DOM
-
2026-06-03days on market $164,900 Active 14 DOM
-
2026-06-02days on market $164,900 Active 13 DOM
-
2026-06-01days on market $164,900 Active 12 DOM
-
2026-05-31days on market $164,900 Active 11 DOM
-
2026-05-20$164,900 Active
-
2024-11-22soldstatus $11,775,000
-
2013-12-12historical
-
2013-08-09$62,500
-
2012-07-20historical
-
2012-07-16$72,000
-
2008-08-21historical
-
2008-07-12$84,900
-
2008-03-14historical
-
2007-08-24$46,900
-
2007-07-05historical
-
2007-05-03$49,900
-
1998-09-03soldstatus $58,500
-
1998-09-03soldstatus $58,500
-
1998-08-07soldstatus $58,500
-
1998-03-23$61,700
-
1996-06-27soldstatus $60,000
-
1996-06-18soldstatus $60,000
-
1996-03-13$62,900
ⓘ Source: listings_history table (triggers on properties + properties_extension) + one-shot
backfill from property_details.listing_events for pre-trigger history.
Tax reassessment forecast OH · Partial reset (capped growth)
- Current annual tax
- $2,133 · $178/mo
- Projected year-2 tax
- $2,353 · $196/mo
- Expected delta
- +$220/yr (+$18/mo · 10.3%)
ⓘ Screening estimate from a state-policy table — verify with the county assessor before closing.
Climate risk First Street
- Flood 1/10 Low FEMA zone X (unshaded) · 0% chance over 30 yrs
- Wildfire 1/10 Low
- Heat 4/10 Moderate 7 d/yr ≥103°F today · 19 d/yr by 30 yrs out
- Wind 2/10 Low 100% chance of damaging wind over 30 yrs
- Air quality 3/10 Moderate 2 unhealthy d/yr today · 3 by 30 yrs out
Nearby sold comps map
Loading sold comps map…
Walkable amenities ~0.75 mi
Loading nearby amenities…
Taxation est. · year 1
- Rental income
- $20,626
- − Mortgage interest
- −$9,237
- − Property taxes
- −$2,133
- − Insurance
- −$824
- − Repairs & maintenance
- −$1,650
- − Management
- −$1,650
- − Depreciation
- −$4,797
- Taxable income
- $334
- Est. tax owed @ 24.0%
- −$80
- After-tax cash flow
- $2,880/yr
For passive investors: Depreciation is non-cash, so a rental often shows a tax loss while cash-flowing — sheltering income. Rental losses are passive: they offset passive income freely, and up to $25,000/yr can offset ordinary (W-2) income if you actively participate and your MAGI is under $100k (phasing out to $0 by $150k); unused losses carry forward. On sale, claimed depreciation is recaptured at up to 25%, and gains may owe capital-gains tax (a 1031 exchange can defer both). Figures are a year-1 estimate at your 24.0% rate — not tax advice; consult a CPA.
Schools (NCES district)
- District
- Mt Healthy City
- NCES district ID
- 3904441
- Math proficiency
- 12% ▼ -21.00%
- Reading proficiency
- 24% ▼ -9.00%
- Median HH income
- $42,699
- Composite
- 15.51/100
- National rank
- #9303
- State rank
- #636 of 656 in OH
Livability — Finneytown
- Score
- 82/100
- State rank
- #70
- US rank
- #1092
Category grades
Schools grade is shown separately in the Schools card above.
Census & demographics
- Census place
- Finneytown, OH
- County
- Hamilton County · 701,295 people
- City population
- 22,186
- Metro
- Cincinnati, OH-KY-IN
- Population (ZIP)
- 40,463
- Household income
- $71,353
- Rent vs Own
- Severe rent burden
- 846.0
Population outlook (Hamilton County) Hauer SSP2
- Today (2025)
- 826,054 people
- By 2030
- 830,947 · +0.6%
- By 2040
- 832,319 · +0.8%
- By 2050
- 822,428 · -0.4%
- By 2075
- 788,688 · -4.5%
- By 2100
- 710,674 · -14.0%
Race, ethnicity, and origin ACS 2023
- Neighborhood character
- Diverse neighborhood (Simpson 0.61)
- Race & ethnicity
- White 47% Black 40% Two or more races 8% Hispanic / Latino 3% Asian 2%
- Common ancestry
- Lithuanian 1% Slovak 1% Iranian 1%
- Foreign-born
- 5% · Canada, India
- Languages at home
- 94% English-only · Spanish 2% Other Indo-European 1% French/Haitian/Cajun 1%
Political lean MEDSL · Hamilton
- 2024 margin
- D (+14.9) · D 57.0% · R 42.1%
- 2008→2024 swing
- +7.9pp toward D · 2008: 7.0pp · 2024: 14.9pp
- All cycles
- 2024: D+14.9 2020: D+15.9 2016: D+9.5 2012: D+4.9 2008: D+7.0
Not yet ingested
- Civics
- —
Market trends
- HPI YoY
- ▼ -181.25%
- Current HPI
- 228.2912
- Rent YoY
- ▲ 6.92%
- Metro
- Cincinnati, OH-KY-IN
- State GDP YoY
- ▲ 1.98%
- F500 in state
- 48
Industry mix (Fortune 500 HQ in OH)
| Industry | F500 HQs | Revenue |
|---|---|---|
| Insurance | 3 | $145B |
|
||
| Industrial Machinery | 3 | $49B |
|
||
| Financial Services | 3 | $24B |
|
||
| Consumer Goods | 2 | $93B |
|
||
| Aerospace / Defense | 2 | $47B |
|
||
| Utilities | 2 | $33B |
|
||
Price history
+162.2% since first listed19 events — show timeline
- 2026-05-20 Listed $164,900 Cincy MLS
- 2024-11-22 Sold (Public Records) $11,775,000 Public Records
- 2013-12-12 Listing Removed — Cincy MLS
- 2013-08-09 Listed $62,500 Cincy MLS
- 2012-07-20 Listing Removed — Cincy MLS
- 2012-07-16 Listed $72,000 Cincy MLS
- 2008-08-21 Listing Removed — Cincy MLS
- 2008-07-12 Listed $84,900 Cincy MLS
- 2008-03-14 Listing Removed — Cincy MLS
- 2007-08-24 Listed $46,900 Cincy MLS
- 2007-07-05 Listing Removed — Cincy MLS
- 2007-05-03 Listed $49,900 Cincy MLS
- 1998-09-03 Sold (Public Records) $58,500 Public Records
- 1998-09-03 Sold (Public Records) $58,500 Public Records
- 1998-08-07 Sold (MLS) $58,500 Cincy MLS
- 1998-03-23 Listed $61,700 Cincy MLS
- 1996-06-27 Sold (Public Records) $60,000 Public Records
- 1996-06-18 Sold (MLS) $60,000 Cincy MLS
- 1996-03-13 Listed $62,900 Cincy MLS
Property tax history
+1.7%/yrLatest (2025): $2,133 · -1.9% YoY. Source: county tax records.
Cash-flow waterfall
monthlySold comps — $/sqft
last 12 mo · ≤1 miLoading sold comps…