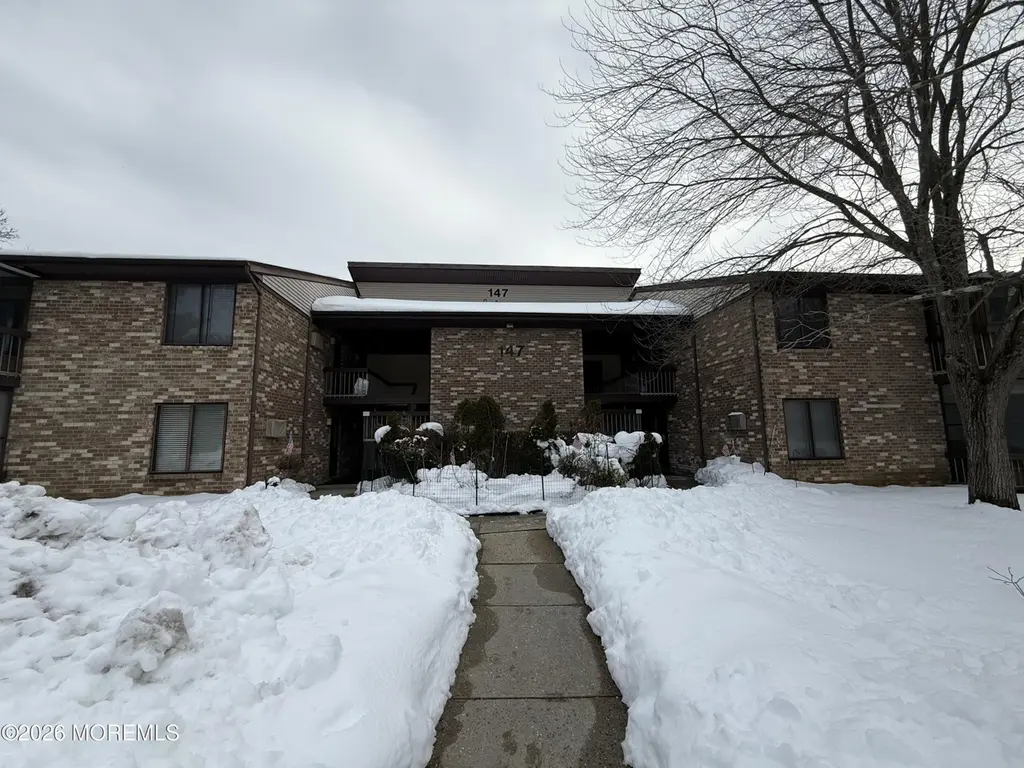
147 Amberly Dr Unit C · Robertsville, NJ
Flood risk 1/10 · Minimal
- FEMA flood zone
- X (unshaded)
- Chance of flooding over 30 yrs
- 0.0%
- Est. flood insurance / yr
- $507 – $1,088
Fire risk 1/10 · Minimal
- Est. fire insurance / yr
- $526 – $976
Heat risk 7/10 · Major
- Hot days now (above 100°F)
- 7 days/yr
- Hot days in 30 yrs
- 15 days/yr
Wind risk 6/10 · Moderate
- Chance of severe wind over 30 yrs
- 27.0%
Air-quality risk 3/10 · Minor
- Unhealthy air days now
- 3 days/yr
- Unhealthy air days in 30 yrs
- 5 days/yr
Risk factors via First Street. Map © Google.
Why this score? — see what drove the C grade
The composite is a weighted blend of 9 inputs, each scored 0–100. Each bar is that input's sub-score; the figure is the points it added to the 100-point composite (weight × sub-score).
- Cash flow +16.4/30.0
- ARV discount +15.0/15.0
- 1% rule +5.3/10.0
- Schools +5.2/10.0
- DSCR +5.1/10.0
- Rent growth +3.5/5.0
- Livability +3.5/5.0
- Condition / age +2.5/5.0
- Appreciation +0.0/10.0
$215,000
🖨 Deal sheet (PDF) 📄 Offer letter ✓ Due diligence
Listing remarks
Ground floor, 1st level, Covered Bridge 55+ community with community amenities & services galore - to include transportation, activities, clubhouse, pool, tennis and pickleball courts.
Key facts
- Clubhouse
- Pickleball courts
- Community amenities
Tags
Neighborhood map
What this means for you Summary
Snapshot
- This is a 1-bed/1.0-bath single-family listed at $215k.
Deal economics
- At list price, monthly cash flow is $123 ($1k/yr) — positive.
- The deal already cash-flows at list — no discount required.
- Meets the 1% rule at list price ($2k rent vs $215k).
- Recommended offer: $212k (1.5% below list) — sets the bar for market timing.
- Cap rate 7.0% vs local median 2.9% in Robertsville — top-decile yield for the area; either an underpriced asset or a hidden risk that comps aren't pricing in. Stress-test before assuming the spread holds.
Location & tenants
- Location reads 70/100 on livability (#258 in NJ) — a middle-class / working-renter tenant base. Strengths: crime A+, employment A+, housing A+; Watch: amenities F, commute F, cost of living F.
- Manalapan-Englishtown Regional Schools School District (suburban): math 48% / reading 62% proficiency, ranked #70 of 472 in NJ (top 15%) — acceptable for families but not a draw, mixed tenant base, ~2y average lease; only 6% free/reduced lunch — higher-income household profile.
- Zoned schools: Milford Brook School (math 51% / reading 48%, grade D, #256 of 1,303 statewide, top 22%, 515 students, 11% FRL); Manalapan-Englishtown Middle School (math 38% / reading 67%, grade C+, #83 of 431 statewide, top 19%, 1,174 students, 9% FRL) — zoned schools at 10% FRL track the district average.
- Market conditions: Rents rising (+3.9%/yr); 356 active listings in the ZIP; 9 comparable units currently listed for rent nearby; rentals leasing fast (median 0d on market — plan ~1-2 weeks tenant-placement turnaround); high-income renter base; 2,840 units permitted in Monmouth County in 2024 (484 in 5+ unit buildings).
- This rent is only 18% of the median local income ($149k/yr) — well below the 30% rent-burden line; pricing power to push rent on renewal without tenant pushback.
Forward outlook
- Local home prices are declining (-3.0%/yr); year-one equity from $1k of loan paydown is wiped out by about $6k of value loss. Plan a longer hold.
- Monmouth County population projected at -11% by 2050 — secular population decline; favor cash flow + early exit over multi-decade hold.
Negotiation context
- It's been on market 29 days — a 2% lower offer ($212k) is reasonable based on typical stale-listing flexibility.
- Current owner paid $135k; list at $215k implies a 59% gain — meaningful room to come down on a strong offer.
Risks & watch-outs
- Climate carrying-cost: major wind risk, 27% chance of damaging wind over 30y; extreme-heat days projected 7→15/yr by 2055 (HVAC capex compounding) — expect insurance premiums to compound above CPI over the hold.
Questions for the listing agent
- Built in 1976 — when were the roof, HVAC, electrical panel, plumbing, and water heater last replaced?
- What does the HOA fee cover, when was the last increase, and are there any pending special assessments or reserve-fund shortfalls?
- Is there a deadline driving the sale (1031 exchange, divorce, estate, relocation)? That informs how much negotiation room exists.
- Schools are A-rated — typically a magnet for longer-tenancy family renters. What's the average tenant stay here, and is there a school-zone premium baked into asking?
- What's the average days-on-market for RENTAL listings here right now (not sales)? A rising rental-DOM trend means longer vacancies and softer asking-rent achievability than the comps imply.
- What's the recent tenant-quality profile in this submarket — average credit score on applications, eviction rate, late-payment / NSF rate, and stable-employment percentage? A property-management company in the area should have these aggregated.
- How much new for-sale + rental construction is in the pipeline within 1–3 miles? Heavy new supply typically softens prices + rents 12–24 months out; constrained supply supports both.
Investment metrics
- 1% rule
- 1.03% ✓
- Cap rate
- 6.98%
- Cash-on-cash
- 2.45%
- DSCR
- 1.11
- GRM
- 8.1
CMA / ARV
- ARV (on-the-fly)
- $264,960
- Comps found
- 12
Show comp detail 12 sales within ~0.75 mi
| Address | Dist | Beds/Ba | Sqft | Sold | Price | $/sf | Match |
|---|---|---|---|---|---|---|---|
| 166 Cross Slope Ct Unit H | 0.11mi | 1/1.0 | 920 (0%) | 4mo | $197,000 | $214 | 91 |
| 159 Cross Slope Ct Unit C | 0.18mi | 1/1.0 | 920 (0%) | 1mo | $257,000 | $279 | 90 |
| 167 Amberly Dr Unit C | 0.14mi | 1/1.0 | 920 (0%) | 4mo | $245,000 | $266 | 90 |
| 167 Amberly Dr Unit H | 0.14mi | 1/1.0 | 920 (0%) | 4mo | $269,000 | $292 | 90 |
| 18 Pine Cluster Cir Unit H | 0.55mi | 1/1.0 | 920 (0%) | 0mo | $265,000 | $288 | 74 |
| 131 Amberly Dr Unit J | 0.21mi | 2/1.0 (+1) | 1,000 (+9%) | 2mo | $267,500 | $268 | 69 |
| 154 Cross Slope Ct Unit J | 0.19mi | 2/2.0 (+1) | 978 (+6%) | 10mo | $312,000 | $319 | 63 |
| 92 Arrowood Rd Unit E | 0.38mi | 2/2.0 (+1) | 978 (+6%) | 1mo | $300,000 | $307 | 62 |
| 113 Amberly Dr Unit F | 0.37mi | 2/1.0 (+1) | 1,014 (+10%) | 1mo | $250,000 | $247 | 60 |
| 86 Arrowwood Ct Unit B | 0.40mi | 2/2.0 (+1) | 978 (+6%) | 5mo | $310,000 | $317 | 58 |
| 86 Arrowood Rd | 0.40mi | 2/2.0 (+1) | 978 (+6%) | 5mo | $310,000 | $317 | 58 |
| 91 Arrowood Rd Unit D | 0.40mi | 1/1.0 | 784 (-15%) | 0mo | $200,000 | $255 | 56 |
Match score weights: distance 35% · size 25% · config 20% · recency 20%. Top-matched comps best support the ARV.
Projected returns pro-forma
-3.0% appreciation · 3.91% rent growth · sell at horizon
- IRR
- -11.3%
- Equity multiple
- 0.59×
- Total profit
- $-24,845
- Equity at exit
- $32,057
- IRR
- -0.6%
- Equity multiple
- 0.96×
- Total profit
- $-2,508
- Equity at exit
- $18,589
Cash invested: $60,200 (down + closing). Projections, not guarantees.
Landlord ↔ Tenant lean methodology
- Overall (STATE)
- 21 Tenant-Leaning
- State New Jersey
- 21 Tenant-Leaning · D+6
- County
- — inherits STATE
- City
- — inherits STATE
ZIP-level market 07726
- Rents YoY
- 3.9%
- Active inventory
- 356
- Price-to-rent
- 8.1×
Monthly cashflow live
- Estimated rent
- $2,216 high interval (Pro) →
- Mortgage (P&I)
- −$1,127
- Tax from tax record
- −$314 /mo · $3,767/yr
- Insurance
- −$90
- HOA
- −$97
- Vacancy / Maint / Mgmt
- −$465
- Net cashflow
- $123
Break-even live
Sensitivity live
| Price | -10% $245 | -5% $184 | +0% $123 | +5% $62 | +10% $1 |
|---|---|---|---|---|---|
| Rent | -10% $-52 | -5% $35 | +0% $123 | +5% $210 | +10% $298 |
| Rate | -1.0pp $231 | -0.5pp $178 | base $123 | +0.5pp $67 | +1.0pp $10 |
UW: 25.0% down · 7.5% · 30yr · 1.5% tax · 5.0% vac · 8.0% maint · 8.0% mgmt
Financing live
Cash to close
- Down payment
- $53,750
- Closing costs
- $6,450
- Reserves months
- —
- Total cash needed
- —
Loan-product check · same deal, 3 products live
Conventional
25% down · 7.5% · 30yr
- Down + closing
- —
- Monthly P&I
- —
- Monthly cashflow
- —
- DSCR
- —
- Eligible?
- —
Personal DTI + credit; lowest rate.
DSCR
20% down · 8.5% · 30yr
- Down + closing
- —
- Monthly P&I
- —
- Monthly cashflow
- —
- DSCR
- —
- Eligible?
- —
No personal income docs; deal must DSCR.
Hard money
10% down · 12.0% · 12mo
- Down + closing
- —
- Monthly P&I
- —
- Monthly cashflow
- —
- DSCR
- —
- Eligible?
- —
Short-term bridge; refi at stabilization.
Rent comps 9 comps
| Address | Beds | Baths | Sqft | Rent | $/sqft | DOM | Units | Dist |
|---|---|---|---|---|---|---|---|---|
| 166 Cross Slope Ct Unit H Manalapan, NJ | 1.0 | 1.0 | 920 | $2,200 | $2.39 | 0d | 1 | 0.11mi |
| 131 Amberly Dr Unit J Manalapan, NJ | 2.0 | 1.0 | 1000 | $2,300 | $2.30 | 0d | 1 | 0.21mi |
| 134 Amberly Dr Unit F Manalapan, NJ | 2.0 | 1.0 | 1025 | $2,200 | $2.15 | 0d | 1 | 0.25mi |
| 105 Amberly Dr Unit D Manalapan, NJ | 2.0 | 1.0 | 1014 | $2,200 | $2.17 | 4d | 1 | 0.31mi |
| 115 Amberly Dr Unit H Manalapan, NJ | 2.0 | 1.0 | 1014 | $2,050 | $2.02 | 12d | 1 | 0.34mi |
| 113 Amberly Dr Unit F Manalapan, NJ | 2.0 | 1.0 | 1014 | $2,200 | $2.17 | 0d | 1 | 0.38mi |
| 362 US Highway 9 Englishtown, NJ | 2.0 | 2.0 | 1100 | $2,700 | $2.45 | 0d | 1 | 0.59mi |
| 131 Wellington Ct Unit 4-1 Manalapan, NJ | 2.0 | 2.0 | 1051 | $2,600 | $2.47 | 0d | 1 | 1.19mi |
| 20 Franklin Ln Manalapan Township, NJ | 1.0–2.0 | 1.0–2.0 | 955 | $2,465 | $2.58 | 0d | 18 | 1.37mi |
HOA detail
- Monthly dues
- $97 · $1,164/yr
- Likely covers
- pool
Listing history 5 events
-
2026-04-22status Pending
-
2026-03-22$215,000 Active
-
2007-05-15soldstatus $135,000
-
2004-11-04soldstatus $122,000
-
1999-01-15soldstatus $65,000
ⓘ Source: listings_history table (triggers on properties + properties_extension) + one-shot
backfill from property_details.listing_events for pre-trigger history.
Tax reassessment forecast NJ · Partial reset (capped growth)
- Current annual tax
- $3,767 · $314/mo
- Projected year-2 tax
- $4,560 · $380/mo
- Expected delta
- +$793/yr (+$66/mo · 21.1%)
ⓘ Screening estimate from a state-policy table — verify with the county assessor before closing.
Climate risk First Street
- Flood 1/10 Low FEMA zone X (unshaded) · 0% chance over 30 yrs
- Wildfire 1/10 Low
- Heat 7/10 Severe 7 d/yr ≥100°F today · 15 d/yr by 30 yrs out
- Wind 6/10 Major 27% chance of damaging wind over 30 yrs
- Air quality 3/10 Moderate 3 unhealthy d/yr today · 5 by 30 yrs out
Nearby sold comps map
Loading sold comps map…
Walkable amenities ~0.75 mi
Loading nearby amenities…
Taxation est. · year 1
- Rental income
- $26,595
- − Mortgage interest
- −$12,043
- − Property taxes
- −$3,767
- − Insurance
- −$1,075
- − Repairs & maintenance
- −$2,128
- − Management
- −$2,128
- − HOA
- −$1,164
- − Depreciation
- −$6,255
- Taxable loss
- −$1,964
- Est. tax savings @ 24.0%
- +$471
- After-tax cash flow
- $1,946/yr
For passive investors: Depreciation is non-cash, so a rental often shows a tax loss while cash-flowing — sheltering income. Rental losses are passive: they offset passive income freely, and up to $25,000/yr can offset ordinary (W-2) income if you actively participate and your MAGI is under $100k (phasing out to $0 by $150k); unused losses carry forward. On sale, claimed depreciation is recaptured at up to 25%, and gains may owe capital-gains tax (a 1031 exchange can defer both). Figures are a year-1 estimate at your 24.0% rate — not tax advice; consult a CPA.
Schools (NCES district)
- District
- Manalapan-Englishtown Regional Schools School District
- NCES district ID
- 3409390
- Math proficiency
- 48% ▼ -25.00%
- Reading proficiency
- 62% ▼ -16.00%
- Median HH income
- $104,596
- Composite
- 52.1/100
- National rank
- #1623
- State rank
- #70 of 472 in NJ
Livability — Robertsville
- Score
- 70/100
- State rank
- #258
- US rank
- #7369
Category grades
Schools grade is shown separately in the Schools card above.
Census & demographics
- County
- Monmouth County · 505,557 people
- Metro
- New York-Newark-Jersey City, NY-NJ-PA
- Population (ZIP)
- 44,764
- Household income
- $149,197
- Rent vs Own
- Severe rent burden
- 620.0
Population outlook (Monmouth County) Hauer SSP2
- Today (2025)
- 620,308 people
- By 2030
- 612,309 · -1.3%
- By 2040
- 587,297 · -5.3%
- By 2050
- 551,342 · -11.1%
- By 2075
- 472,934 · -23.8%
- By 2100
- 381,534 · -38.5%
Race, ethnicity, and origin ACS 2023
- Neighborhood character
- Predominantly White (78%)
- Race & ethnicity
- White 78% Hispanic / Latino 9% Asian 8% Two or more races 6% Black 3%
- Hispanic origin (detail)
- Puerto Rican 3% Cuban 2%
- Common ancestry
- Romanian 8% Scotch-Irish 6% Subsaharan African 3%
- Foreign-born
- 16% · China, Canada
- Languages at home
- 79% English-only · Russian/Polish/Slavic 6% Other Indo-European 6% Spanish 3%
Political lean MEDSL · Monmouth
- 2024 margin
- R (+11.4) · D 43.4% · R 54.8% · Other 1.8%
- 2008→2024 swing
- -7.7pp toward R · 2008: -3.7pp · 2024: -11.4pp
- All cycles
- 2024: R+11.4 2020: R+2.8 2016: R+9.5 2012: R+5.5 2008: R+3.7
Not yet ingested
- Civics
- —
Market trends
- HPI YoY
- ▼ -383.81%
- Current HPI
- 311.4961
- Rent YoY
- ▲ 3.91%
- Metro
- New York-Newark-Jersey City, NY-NJ-PA
- State GDP YoY
- ▲ 2.05%
- F500 in state
- 34
Industry mix (Fortune 500 HQ in NJ)
| Industry | F500 HQs | Revenue |
|---|---|---|
| Consumer Goods | 3 | $31B |
|
||
| Pharmaceuticals | 2 | $153B |
|
||
| Technology | 2 | $21B |
|
||
| Insurance | 2 | $20B |
|
||
| Healthcare | 2 | $19B |
|
||
| Financial Services | 1 | $70B |
|
||
Price history
+230.8% since first listed5 events — show timeline
- 2026-04-22 Pending — MOMLS
- 2026-03-22 Listed $215,000 MOMLS
- 2007-05-15 Sold (Public Records) $135,000 Public Records
- 2004-11-04 Sold (Public Records) $122,000 Public Records
- 1999-01-15 Sold (Public Records) $65,000 Public Records
Property tax history
+5.0%/yrLatest (2025): $3,767 · +15.4% YoY. Source: county tax records.
Cash-flow waterfall
monthlySold comps — $/sqft
last 12 mo · ≤1 miLoading sold comps…