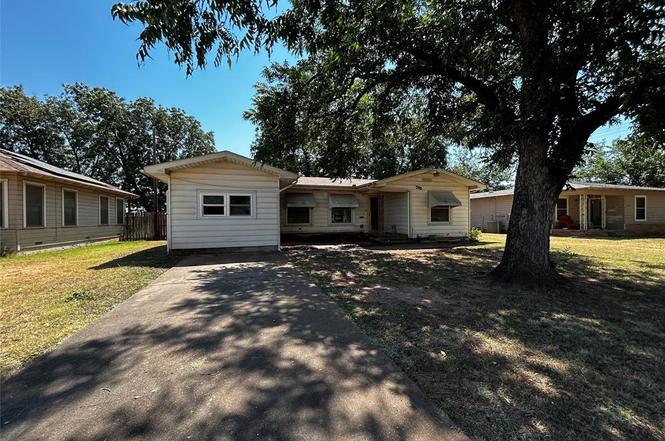
309 Woodlawn Dr · Abilene, TX
Flood risk 3/10 · Minor
- FEMA flood zone
- X (unshaded)
- Chance of flooding over 30 yrs
- 0.12%
- Est. flood insurance / yr
- $507 – $1,088
Fire risk 2/10 · Minimal
- Est. fire insurance / yr
- $1,222 – $2,270
Heat risk 7/10 · Major
- Hot days now (above 104°F)
- 7 days/yr
- Hot days in 30 yrs
- 23 days/yr
Wind risk 4/10 · Minor
- Chance of severe wind over 30 yrs
- 11.0%
Air-quality risk 1/10 · Minimal
- Unhealthy air days now
- 0 days/yr
- Unhealthy air days in 30 yrs
- 0 days/yr
Risk factors via First Street. Map © Google.
Why this score? — see what drove the B+ grade
The composite is a weighted blend of 9 inputs, each scored 0–100. Each bar is that input's sub-score; the figure is the points it added to the 100-point composite (weight × sub-score).
- Cash flow +30.0/30.0
- ARV discount +15.0/15.0
- 1% rule +10.0/10.0
- DSCR +10.0/10.0
- Rent growth +5.0/5.0
- Livability +3.8/5.0
- Schools +2.8/10.0
- Condition / age +2.5/5.0
- Appreciation +0.0/10.0
$114,900
🖨 Deal sheet 📄 Offer letter ✓ Due diligence
Listing remarks
This charming home features a brand-new kitchen with granite countertops, new cabinets, and black appliances. You'll love the recently updated electrical and plumbing systems, providing peace of mind. The home has a solid foundation and a durable roof. The interior boasts a mix of hardwood and tile flooring, ready for your personal touch. One bathroom includes an accessible shower.
Key facts
- Black appliances
- Updated electrical
- New kitchen
Tags
Neighborhood map
What this means for you Summary
Snapshot
- This is a 2-bed/2.0-bath single-family listed at $115k.
Deal economics
- At list price, monthly cash flow is $801 ($10k/yr) — positive.
- The deal already cash-flows at list — no discount required.
- Meets the 1% rule at list price ($2k rent vs $115k).
- Recommended offer: $108k (6.0% below list) — sets the bar for market timing.
- Cap rate 14.7% vs local median 6.7% in Abilene — top-decile yield for the area; either an underpriced asset or a hidden risk that comps aren't pricing in. Stress-test before assuming the spread holds.
Location & tenants
- Location reads 75/100 on livability (#142 in TX, #4,037 nationally) — a middle-class / working-renter tenant base. Strengths: cost of living A+, housing A+, health & safety A+; Watch: schools D+, crime D, commute F.
- Abilene ISD (urban): math 32% / reading 34% proficiency, ranked #575 of 826 in TX (top 70%) — families likely to look elsewhere, expect single-tenant / working-renter base with shorter leases.
- Market conditions: Rents rising fast (+40.2%/yr); 86 active listings in the ZIP; 12 comparable units currently listed for rent nearby; rentals at typical pace (median 21d on market — plan ~3-4 weeks tenant-placement turnaround); 508 units permitted in Taylor County in 2024 (0 in 5+ unit buildings).
- At $2,237/mo this rent would consume 50% of the median local household income ($54k/yr) (locally 662% of renters already pay >50% of income on rent) — very limited rent-growth headroom before tenants either downsize or default.
Forward outlook
- Local home prices are declining (-3.0%/yr); year-one equity from $794 of loan paydown is wiped out by about $3k of value loss. Plan a longer hold.
- Taylor County population projected at +16% by 2050 — long-run rental-demand tailwind backs the buy-and-hold thesis.
- At projected returns (-3.0% appreciation + 8.0% rent growth), your $32k cash investment doubles in ~4 years — after that, you're playing with house money.
Negotiation context
- It's been on market 73 days — a 6% lower offer ($108k) is reasonable based on typical stale-listing flexibility.
Risks & watch-outs
- Watch-outs: property tax is 3.3% of price; built in 1955 — expect roof / HVAC / electrical / plumbing capex.
- Climate carrying-cost: extreme-heat days projected 7→23/yr by 2055 (HVAC capex compounding) — expect insurance premiums to compound above CPI over the hold.
Questions for the listing agent
- It's been on market 73 days. Have you received any prior offers? Is the seller open to a 6% concession, seller financing, or rate buy-down credit?
- Built in 1955 — when were the roof, HVAC, electrical panel, plumbing, and water heater last replaced?
- Property tax is high relative to price — has the assessment been appealed recently, and will the sale trigger a re-assessment?
- Why hasn't it sold? Are there any deal-killer items the seller is aware of (foundation, flood, title, zoning, code violations)?
- Is there a deadline driving the sale (1031 exchange, divorce, estate, relocation)? That informs how much negotiation room exists.
- Schools are D-rated, which usually means shorter tenancies and higher turnover. Who's the typical renter profile here, and what's been the actual vacancy rate?
- Crime grade is D in this area — have there been break-ins, vandalism, or insurance claims at this property in the last 3 years? What carrier currently insures it and at what premium?
- What's the average days-on-market for RENTAL listings here right now (not sales)? A rising rental-DOM trend means longer vacancies and softer asking-rent achievability than the comps imply.
- What's the recent tenant-quality profile in this submarket — average credit score on applications, eviction rate, late-payment / NSF rate, and stable-employment percentage? A property-management company in the area should have these aggregated.
- How much new for-sale + rental construction is in the pipeline within 1–3 miles? Heavy new supply typically softens prices + rents 12–24 months out; constrained supply supports both.
Investment metrics
- 1% rule
- 1.95% ✓
- Cap rate
- 14.65%
- Cash-on-cash
- 29.86%
- DSCR
- 2.33
- GRM
- 4.3
CMA / ARV
- ARV (on-the-fly)
- $175,336
- Comps found
- 12
Show comp detail 12 sales within ~0.75 mi
| Address | Dist | Beds/Ba | Sqft | Sold | Price | $/sf | Match |
|---|---|---|---|---|---|---|---|
| 617 Briarwood St | 0.18mi | 3/1.5 (+1) | 1,246 (-12%) | 0mo | $170,000 | $136 | 65 |
| 301 Westview Dr | 0.13mi | 3/1.5 (+1) | 1,604 (+13%) | 1mo | $220,000 | $137 | 64 |
| 2134 S 2nd St | 0.67mi | 3/2.0 (+1) | 1,424 (+1%) | 0mo | $145,000 | $102 | 62 |
| 3218 S 5th St | 0.58mi | 3/1.5 (+1) | 1,452 (+3%) | 2mo | $114,900 | $79 | 60 |
| 1010 Fannin St | 0.55mi | 3/1.0 (+1) | 1,344 (-5%) | 0mo | $166,500 | $124 | 57 |
| 3041 Russell Ave | 0.36mi | 3/2.0 (+1) | 1,587 (+12%) | 1mo | $224,500 | $141 | 57 |
| 290 Clyde St | 0.56mi | 3/1.0 (+1) | 1,342 (-5%) | 3mo | $159,500 | $119 | 54 |
| 3302 S 5th St | 0.60mi | 3/1.0 (+1) | 1,479 (+5%) | 2mo | $189,900 | $128 | 54 |
| 2116 Parramore St | 0.70mi | 3/1.0 (+1) | 1,384 (-2%) | 1mo | $145,000 | $105 | 54 |
| 441 Sunset Dr | 0.54mi | 3/2.0 (+1) | 1,280 (-10%) | 4mo | $159,000 | $124 | 50 |
| 755 Crestwood Dr | 0.60mi | 3/2.0 (+1) | 1,586 (+12%) | 2mo | $259,900 | $164 | 45 |
| 3689 N 9th St | 0.75mi | 2/1.5 | 1,264 (-11%) | 3mo | $156,000 | $123 | 43 |
Match score weights: distance 35% · size 25% · config 20% · recency 20%. Top-matched comps best support the ARV.
Projected returns pro-forma
-3.0% appreciation · 8.0% rent growth · sell at horizon
- IRR
- 30.6%
- Equity multiple
- 2.38×
- Total profit
- $44,332
- Equity at exit
- $17,132
- IRR
- 40.8%
- Equity multiple
- 5.93×
- Total profit
- $158,644
- Equity at exit
- $9,934
Cash invested: $32,172 (down + closing). Projections, not guarantees.
Landlord ↔ Tenant lean methodology
- Overall (STATE)
- 87 Strongly Landlord-Friendly
- State Texas
- 87 Strongly Landlord-Friendly · R+5
- County
- — inherits STATE
- City
- — inherits STATE
ZIP-level market 79603
- Home prices YoY
- -32.5%
- Rents YoY
- 40.2%
- Active inventory
- 86
- Price-to-rent
- 4.3×
Monthly cashflow live
- Estimated rent
- $2,237 high interval (Pro) →
- Mortgage (P&I)
- −$603
- Tax from tax record
- −$317 /mo · $3,800/yr
- Insurance
- −$48
- HOA
- −$0
- Vacancy / Maint / Mgmt
- −$470
- Net cashflow
- $801
Break-even live
UW: 25.0% down · 7.5% · 30yr · 1.5% tax · 5.0% vac · 8.0% maint · 8.0% mgmt
Financing live
Cash to close
- Down payment
- $28,725
- Closing costs
- $3,447
- Reserves months
- —
- Total cash needed
- —
Loan-product check · same deal, 3 products live
Conventional
25% down · 7.5% · 30yr
- Down + closing
- —
- Monthly P&I
- —
- Monthly cashflow
- —
- DSCR
- —
- Eligible?
- —
Personal DTI + credit; lowest rate.
DSCR
20% down · 8.5% · 30yr
- Down + closing
- —
- Monthly P&I
- —
- Monthly cashflow
- —
- DSCR
- —
- Eligible?
- —
No personal income docs; deal must DSCR.
Hard money
10% down · 12.0% · 12mo
- Down + closing
- —
- Monthly P&I
- —
- Monthly cashflow
- —
- DSCR
- —
- Eligible?
- —
Short-term bridge; refi at stabilization.
Rent comps 12 comps
| Address | Beds | Baths | Sqft | Rent | $/sqft | DOM | Units | Dist |
|---|---|---|---|---|---|---|---|---|
| 234 Clyde St Abilene, TX | 3.0 | 1.0 | 998 | $1,995 | $2.00 | 13d | 1 | 0.50mi |
| 735 Victoria St Abilene, TX | 1.0 | 1.0 | 1368 | $1,000 | $0.73 | 13d | 1 | 0.84mi |
| 1209 Kirkwood St Abilene, TX | 3.0 | 2.0 | 1674 | $2,500 | $1.49 | 21d | 1 | 0.93mi |
| 1481 Burger St Abilene, TX | 3.0 | 2.0 | 1330 | $2,400 | $1.80 | 21d | 1 | 0.99mi |
| 889 Ross Ave Abilene, TX | 2.0 | 1.0 | 1223 | $1,700 | $1.39 | 21d | 1 | 1.00mi |
| 1470 Beechwood Ln Abilene, TX | 3.0 | 2.0 | 1799 | $4,500 | $2.50 | 43d | 1 | 1.08mi |
| 1350 Lillius St Abilene, TX | 1.0 | 1.0 | 1076 | $2,000 | $1.86 | 13d | 1 | 1.09mi |
| 1685 N Willis St Abilene, TX | 3.0 | 2.0 | 1349 | $1,800 | $1.33 | 21d | 1 | 1.19mi |
| 725 Peach St Abilene, TX | 3.0 | 2.0 | 1618 | $3,500 | $2.16 | 21d | 1 | 1.26mi |
| 619 Poplar St Abilene, TX | 2.0 | 1.0 | 884 | $1,695 | $1.92 | 13d | 1 | 1.35mi |
| 3250 College St Abilene, TX | 2.0 | 1.0 | 1148 | $1,595 | $1.39 | 21d | 1 | 1.37mi |
| 1638 Merchant St Abilene, TX | 3.0 | 2.0 | 1328 | $2,895 | $2.18 | 13d | 1 | 1.46mi |
Listing history 4 events
-
2025-10-31status Pending
-
2025-09-05price $114,900
-
2025-08-19$124,900 Active
-
2003-11-04soldstatus
ⓘ Source: listings_history table (triggers on properties + properties_extension) + one-shot
backfill from property_details.listing_events for pre-trigger history.
Tax reassessment forecast TX · Resets to sale price
- Current annual tax
- $3,800 · $317/mo
- Projected year-2 tax
- $3,800 · $317/mo
- Expected delta
- $0/yr ($0/mo · 0.0%)
ⓘ Screening estimate from a state-policy table — verify with the county assessor before closing.
Climate risk First Street
- Flood 3/10 Moderate FEMA zone X (unshaded) · 12% chance over 30 yrs
- Wildfire 2/10 Low
- Heat 7/10 Severe 7 d/yr ≥104°F today · 23 d/yr by 30 yrs out
- Wind 4/10 Moderate 11% chance of damaging wind over 30 yrs
- Air quality 1/10 Low 0 unhealthy d/yr today · 0 by 30 yrs out
Nearby sold comps map
Loading sold comps map…
Walkable amenities ~0.75 mi
Loading nearby amenities…
Taxation est. · year 1
- Rental income
- $26,850
- − Mortgage interest
- −$6,436
- − Property taxes
- −$3,800
- − Insurance
- −$574
- − Repairs & maintenance
- −$2,148
- − Management
- −$2,148
- − Depreciation
- −$3,343
- Taxable income
- $8,401
- Est. tax owed @ 24.0%
- −$2,016
- After-tax cash flow
- $7,590/yr
For passive investors: Depreciation is non-cash, so a rental often shows a tax loss while cash-flowing — sheltering income. Rental losses are passive: they offset passive income freely, and up to $25,000/yr can offset ordinary (W-2) income if you actively participate and your MAGI is under $100k (phasing out to $0 by $150k); unused losses carry forward. On sale, claimed depreciation is recaptured at up to 25%, and gains may owe capital-gains tax (a 1031 exchange can defer both). Figures are a year-1 estimate at your 24.0% rate — not tax advice; consult a CPA.
Schools (NCES district)
- District
- Abilene ISD
- NCES district ID
- 4807440
- Math proficiency
- 32% ▼ -11.00%
- Reading proficiency
- 34% ▼ -5.00%
- Median HH income
- $39,782
- Composite
- 27.71/100
- National rank
- #6909
- State rank
- #575 of 826 in TX
Livability — Abilene
- Score
- 75/100
- State rank
- #142
- US rank
- #4037
Category grades
Schools grade is shown separately in the Schools card above.
Census & demographics
- Census place
- Abilene, TX
- County
- Taylor County · 136,672 people
- City population
- 136,672
- Metro
- Abilene, TX
- Population (ZIP)
- 23,548
- Household income
- $53,513
- Rent vs Own
- Severe rent burden
- 662.0
Population outlook (Taylor County) Hauer SSP2
- Today (2025)
- 145,270 people
- By 2030
- 150,050 · +3.3%
- By 2040
- 159,417 · +9.7%
- By 2050
- 168,883 · +16.3%
- By 2075
- 194,436 · +33.8%
- By 2100
- 203,163 · +39.9%
Race, ethnicity, and origin ACS 2023
- Neighborhood character
- Diverse neighborhood (Simpson 0.60)
- Race & ethnicity
- Hispanic / Latino 48% White 40% Two or more races 24% Black 8%
- Hispanic origin (detail)
- Mexican 44%
- Common ancestry
- Italian 2% Slovak 2% Portuguese 1%
- Foreign-born
- 9% · Canada
- Languages at home
- 73% English-only · Spanish 25%
Political lean MEDSL · Taylor
- 2024 margin
- Solid R (+49.8) · D 24.6% · R 74.4% · Other 1.0%
- 2008→2024 swing
- -4.2pp toward R · 2008: -45.6pp · 2024: -49.8pp
- All cycles
- 2024: R+49.8 2020: R+45.3 2016: R+51.1 2012: R+53.6 2008: R+45.6
Not yet ingested
- Civics
- —
Market trends
- HPI YoY
- ▼ -88.84%
- Current HPI
- 184.8875
- Rent YoY
- ▲ 40.19%
- Metro
- Abilene, TX
- State GDP YoY
- ▲ 3.95%
- F500 in state
- 110
Industry mix (Fortune 500 HQ in TX)
| Industry | F500 HQs | Revenue |
|---|---|---|
| Energy | 16 | $1,198B |
|
||
| Technology | 5 | $198B |
|
||
| Engineering / Construction | 4 | $72B |
|
||
| Energy Services | 3 | $60B |
|
||
| Utilities | 3 | $41B |
|
||
| Healthcare | 2 | $330B |
|
||
Price history
-8.0% since first listed4 events — show timeline
- 2025-10-31 Pending — NTREIS
- 2025-09-05 Price Changed $114,900 NTREIS
- 2025-08-19 Listed $124,900 NTREIS
- 2003-11-04 Sold (Public Records) — Public Records
Property tax history
+6.1%/yrLatest (2025): $3,800 · +8.3% YoY. Source: county tax records.
Cash-flow waterfall
monthlySold comps — $/sqft
last 12 mo · ≤1 miLoading sold comps…