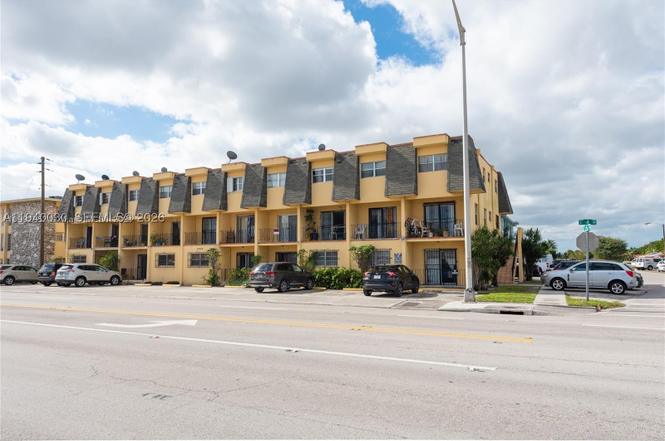
3494 E 4th Ave #1207 · Hialeah, FL
Flood risk 1/10 · Minimal
- FEMA flood zone
- AH
- Chance of flooding over 30 yrs
- 0.0%
- Est. flood insurance / yr
- $1,142 – $2,507
Fire risk 1/10 · Minimal
- Est. fire insurance / yr
- $947 – $1,759
Heat risk 10/10 · Severe
- Hot days now (above 105°F)
- 6 days/yr
- Hot days in 30 yrs
- 22 days/yr
Wind risk 10/10 · Severe
- Chance of severe wind over 30 yrs
- 99.0%
Air-quality risk 2/10 · Minimal
- Unhealthy air days now
- 1 days/yr
- Unhealthy air days in 30 yrs
- 2 days/yr
Risk factors via First Street. Map © Google.
Why this score? — see what drove the B grade
The composite is a weighted blend of 9 inputs, each scored 0–100. Each bar is that input's sub-score; the figure is the points it added to the 100-point composite (weight × sub-score).
- Cash flow +30.0/30.0
- 1% rule +10.0/10.0
- DSCR +10.0/10.0
- ARV discount +7.5/15.0
- Schools +4.2/10.0
- Livability +3.7/5.0
- Rent growth +2.5/5.0
- Condition / age +2.5/5.0
- Appreciation +0.0/10.0
$199,900
🖨 Deal sheet 📄 Offer letter ✓ Due diligence
Listing remarks
SHORT SALE OPPORTUNITY / CASH ONLY * * * OCCUPY OR RENT RIGHT AWAY!!! * * * TWO STORY GEM IN THE HEART OF HIALEAH NEAR SHOPPING, HIALEAH CASINO, AIRPORT AND TRAIN STATIONS. KITCHEN, LIVING ROOM DOWNSTAIRS AND BEDROOMS & BATH UPSTAIRS; 2 BALCONIES, 1-ASSIGNED PARKING (fits 2 cars) + STORAGE UNDER STAIRS; COMMUNITY POOL AND LAUNDRY. LOW MAINTENANCE OF $189/MTH THAT INCLUDES WATER, SEWER, TRASH AND COMMON AREAS. LOW ASSESMENT OF $148/MTH (BUILDING REPAIRS AND PAINTING). ALL INFORMATION PROVIDED SHOULD BE ACCURATE, BUT MUST BE VERIFIED BY BUYER AND / OR BUYERS AGENT. * * * * OWNER/AGENT - SELLER RELATED TO BROKER * * * * DUE TO SHORT SALE, TITLE / SALE MUST CLOSE WITH LAW OFF
Key facts
- Two balconies
- Community pool
- Two story gem
Tags
Property features AI
Finance
- Other: Association-managed pool
- Financial info: Annual taxes (reported): $200; Pets allowed with restrictions or conditions
- HOA & community: Monthly association fee of $189; HOA covers common areas, laundry, structure maintenance, parking, pool(s) and trash; Community amenities include laundry and a pool
Exterior
- Parking: Assigned parking; Guest parking; One-space assigned
- Utilities: Central water heater (electric); Public utilities (assumed)
- Home design: Attached property; 2 stories; Entry on level 2
- Construction: Block construction; Effective year built
- Exterior features: Balcony; Open balcony/patio
Interior
- Kitchen: Electric range; Refrigerator
- Flooring: Tile
- Bathrooms: 1 full bathroom
- Heating & cooling: Central heating; Central air conditioning
- Interior features: First floor entry; Upper-level primary; Tile flooring
- Laundry & utility: Common area laundry; Electric water heater
Neighborhood map
What this means for you Summary
Snapshot
- This is a 2-bed/1.0-bath condo listed at $200k.
Deal economics
- At list price, monthly cash flow is $839 ($10k/yr) — positive.
- The deal already cash-flows at list — no discount required.
- Meets the 1% rule at list price ($3k rent vs $200k).
- Recommended offer: $176k (12.0% below list) — sets the bar for market timing.
- Cap rate 12.2% vs local median 3.5% in Hialeah — top-decile yield for the area; either an underpriced asset or a hidden risk that comps aren't pricing in. Stress-test before assuming the spread holds.
Location & tenants
- Location reads 74/100 on livability (#288 in FL, #4,774 nationally) — a middle-class / working-renter tenant base. Strengths: commute A+, health & safety A+; Watch: amenities F, employment D-.
- Miami-Dade (suburban): math 45% / reading 54% proficiency, ranked #40 of 73 in FL (top 55%) — families likely to look elsewhere, expect single-tenant / working-renter base with shorter leases; 64% free/reduced lunch — lower-income household profile, screen leases tightly.
- Market conditions: Rents soft (-0.1%/yr); 111 active listings in the ZIP; 10,051 units permitted in Miami-Dade County in 2024 (7,758 in 5+ unit buildings).
- At $3,243/mo this rent would consume 64% of the median local household income ($61k/yr) (locally 1352% of renters already pay >50% of income on rent) — very limited rent-growth headroom before tenants either downsize or default.
Forward outlook
- Local home prices are declining (-3.0%/yr); year-one equity from $1k of loan paydown is wiped out by about $6k of value loss. Plan a longer hold.
- Miami-Dade County population projected at +28% by 2050 — long-run rental-demand tailwind backs the buy-and-hold thesis.
- At projected returns (-3.0% appreciation + 0.0% rent growth), your $56k cash investment doubles in ~10 years — after that, you're playing with house money.
Negotiation context
- It's been on market 163 days — a 12% lower offer ($176k) is reasonable based on typical stale-listing flexibility.
- 2 sale attempts; this cycle's ask has dropped $20k (9%) from the opening price — seller is motivated, your offer sets the floor, not the list.
Risks & watch-outs
- Watch-outs: flood insurance adds $152/mo.
- Climate carrying-cost: in FEMA flood zone AH (mandatory federal flood insurance); severe wind risk, 99% chance of damaging wind over 30y; extreme-heat days projected 6→22/yr by 2055 (HVAC capex compounding) — expect insurance premiums to compound above CPI over the hold.
Questions for the listing agent
- It's been on market 163 days. Have you received any prior offers? Is the seller open to a 12% concession, seller financing, or rate buy-down credit?
- Built in 1971 — when were the roof, HVAC, electrical panel, plumbing, and water heater last replaced?
- What's the actual annual flood-insurance premium (NFIP or private), and is the property in a SFHA with mandatory coverage?
- What does the HOA fee cover, when was the last increase, and are there any pending special assessments or reserve-fund shortfalls?
- Any open or pending special assessments — roof, HVAC, plumbing, elevator, façade? What's the per-unit balance and payoff schedule, and is the seller paying it off at close or rolling it to the buyer?
- Why hasn't it sold? Are there any deal-killer items the seller is aware of (foundation, flood, title, zoning, code violations)?
- Is there a deadline driving the sale (1031 exchange, divorce, estate, relocation)? That informs how much negotiation room exists.
- What's the average days-on-market for RENTAL listings here right now (not sales)? A rising rental-DOM trend means longer vacancies and softer asking-rent achievability than the comps imply.
- What's the recent tenant-quality profile in this submarket — average credit score on applications, eviction rate, late-payment / NSF rate, and stable-employment percentage? A property-management company in the area should have these aggregated.
- How much new apartment / multifamily construction is in the pipeline within 1–3 miles? Heavy new supply (>2% of stock underway) typically softens rents 12–24 months out; light construction supports rent growth.
Investment metrics
- 1% rule
- 1.62% ✓
- Cap rate
- 12.24%
- Cash-on-cash
- 21.25%
- DSCR
- 1.95
- GRM
- 5.1
CMA / ARV
No comps found within radius.
Projected returns pro-forma
-3.0% appreciation · 0.0% rent growth · sell at horizon
- IRR
- 5.7%
- Equity multiple
- 1.21×
- Total profit
- $11,820
- Equity at exit
- $29,806
- IRR
- 11.7%
- Equity multiple
- 1.78×
- Total profit
- $43,450
- Equity at exit
- $17,284
Cash invested: $55,972 (down + closing). Projections, not guarantees.
Landlord ↔ Tenant lean methodology
- Overall (STATE)
- 87 Strongly Landlord-Friendly
- State Florida
- 87 Strongly Landlord-Friendly · R+3
- County
- — inherits STATE
- City
- — inherits STATE
ZIP-level market 33013
- Rents YoY
- -0.1%
- Active inventory
- 111
- Price-to-rent
- 5.1×
Monthly cashflow live
- Estimated rent
- $3,243 medium interval (Pro) →
- Mortgage (P&I)
- −$1,048
- Tax est. 1.5%
- −$250 /mo · $2,998/yr
- Insurance
- −$83
- Flood insurance flood zone
- −$152 /mo · $1,824/yr
- HOA
- −$189
- Vacancy / Maint / Mgmt
- −$681
- Net cashflow
- $839
Break-even live
UW: 25.0% down · 7.5% · 30yr · 1.5% tax · 5.0% vac · 8.0% maint · 8.0% mgmt
Financing live
Cash to close
- Down payment
- $49,975
- Closing costs
- $5,997
- Reserves months
- —
- Total cash needed
- —
Loan-product check · same deal, 3 products live
Conventional
25% down · 7.5% · 30yr
- Down + closing
- —
- Monthly P&I
- —
- Monthly cashflow
- —
- DSCR
- —
- Eligible?
- —
Personal DTI + credit; lowest rate.
DSCR
20% down · 8.5% · 30yr
- Down + closing
- —
- Monthly P&I
- —
- Monthly cashflow
- —
- DSCR
- —
- Eligible?
- —
No personal income docs; deal must DSCR.
Hard money
10% down · 12.0% · 12mo
- Down + closing
- —
- Monthly P&I
- —
- Monthly cashflow
- —
- DSCR
- —
- Eligible?
- —
Short-term bridge; refi at stabilization.
HOA detail condo
- Monthly dues
- $189 · $2,268/yr
- Likely covers
- watersewertrashpoolparking
- Assessments
- None detected in remarks — confirm with the listing agent.
Listing history 26 events
-
2026-06-18days on market $199,900 Active 163 DOM
-
2026-06-17days on market $199,900 Active 162 DOM
-
2026-06-16days on market $199,900 Active 161 DOM
-
2026-06-15days on market $199,900 Active 160 DOM
-
2026-06-13days on market $199,900 Active 158 DOM
-
2026-06-09days on market $199,900 Active 154 DOM
-
2026-06-08days on market $199,900 Active 153 DOM
-
2026-06-07days on market $199,900 Active 152 DOM
-
2026-06-04days on market $199,900 Active 149 DOM
-
2026-06-03days on market $199,900 Active 148 DOM
-
2026-06-02days on market $199,900 Active 147 DOM
-
2026-06-01days on market $199,900 Active 146 DOM
-
2026-06-01status $199,900 Active 145 DOM
-
2026-05-31days on market $199,900 Active Under Contract 145 DOM
-
2026-05-06historical Active Under Contract
-
2026-04-01price $199,900
-
2026-03-20price $209,000
-
2026-01-06$220,000 Active
-
2025-12-31historical
-
2025-12-03price $210,000
-
2025-11-21price $213,000
-
2025-10-24price $214,000
-
2025-08-07price $219,000
-
2025-07-19price $229,000
-
2025-07-14price $239,000
-
2025-07-04$259,000 Active
ⓘ Source: listings_history table (triggers on properties + properties_extension) + one-shot
backfill from property_details.listing_events for pre-trigger history.
Climate risk First Street
- Flood 1/10 Low FEMA zone AH · 0% chance over 30 yrs
- Wildfire 1/10 Low
- Heat 10/10 Extreme 6 d/yr ≥105°F today · 22 d/yr by 30 yrs out
- Wind 10/10 Extreme 99% chance of damaging wind over 30 yrs
- Air quality 2/10 Low 1 unhealthy d/yr today · 2 by 30 yrs out
Nearby sold comps map
Loading sold comps map…
Walkable amenities ~0.75 mi
Loading nearby amenities…
Taxation est. · year 1
- Rental income
- $38,914
- − Mortgage interest
- −$11,198
- − Property taxes
- −$2,998
- − Insurance
- −$2,824
- − Repairs & maintenance
- −$3,113
- − Management
- −$3,113
- − HOA
- −$2,268
- − Depreciation
- −$5,815
- Taxable income
- $7,584
- Est. tax owed @ 24.0%
- −$1,820
- After-tax cash flow
- $8,252/yr
For passive investors: Depreciation is non-cash, so a rental often shows a tax loss while cash-flowing — sheltering income. Rental losses are passive: they offset passive income freely, and up to $25,000/yr can offset ordinary (W-2) income if you actively participate and your MAGI is under $100k (phasing out to $0 by $150k); unused losses carry forward. On sale, claimed depreciation is recaptured at up to 25%, and gains may owe capital-gains tax (a 1031 exchange can defer both). Figures are a year-1 estimate at your 24.0% rate — not tax advice; consult a CPA.
Schools (NCES district)
- District
- Miami-Dade
- NCES district ID
- 1200390
- Math proficiency
- 45% ▼ -16.00%
- Reading proficiency
- 54% ▼ -5.00%
- Median HH income
- $43,928
- Composite
- 41.76/100
- National rank
- #3397
- State rank
- #40 of 73 in FL
Livability — Hialeah
- Score
- 74/100
- State rank
- #288
- US rank
- #4774
Category grades
Schools grade is shown separately in the Schools card above.
Census & demographics
- Census place
- Hialeah, FL
- County
- Miami-Dade County · 2,697,751 people
- City population
- 315,776
- Metro
- Miami-Fort Lauderdale-Pompano Beach, FL
- Population (ZIP)
- 30,695
- Household income
- $60,658
- Rent vs Own
- Severe rent burden
- 1352.0
Population outlook (Miami-Dade County) Hauer SSP2
- Today (2025)
- 3,126,439 people
- By 2030
- 3,325,765 · +6.4%
- By 2040
- 3,697,561 · +18.3%
- By 2050
- 4,012,134 · +28.3%
- By 2075
- 4,605,612 · +47.3%
- By 2100
- 4,866,598 · +55.7%
Race, ethnicity, and origin ACS 2023
- Neighborhood character
- Predominantly Hispanic (94%)
- Race & ethnicity
- Hispanic / Latino 94% Two or more races 56% White 5%
- Hispanic origin (detail)
- Puerto Rican 1% Cuban 82%
- Foreign-born
- 74% · Canada, Jamaica
- Languages at home
- 9% English-only · Spanish 90%
Political lean MEDSL · Miami-Dade
- 2024 margin
- R (+11.4) · D 43.9% · R 55.4%
- 2008→2024 swing
- -27.6pp toward R · 2008: 16.1pp · 2024: -11.4pp
- All cycles
- 2024: R+11.4 2020: D+7.3 2016: D+29.6 2012: D+23.7 2008: D+16.1
Not yet ingested
- Civics
- —
Market trends
- HPI YoY
- ▼ -664.57%
- Current HPI
- 429.3973
- Rent YoY
- ▼ -0.13%
- Metro
- Miami-Fort Lauderdale-Pompano Beach, FL
- State GDP YoY
- ▲ 3.28%
- F500 in state
- 36
Industry mix (Fortune 500 HQ in FL)
| Industry | F500 HQs | Revenue |
|---|---|---|
| Industrial Technology | 2 | $29B |
|
||
| Insurance | 2 | $17B |
|
||
| Retail | 1 | $60B |
|
||
| Technology Distribution | 1 | $58B |
|
||
| Homebuilding | 1 | $35B |
|
||
| Technology Manufacturing | 1 | $35B |
|
||
Price history
-22.8% since first listed12 events — show timeline
- 2026-05-06 Contingent — MARMLS
- 2026-04-01 Price Changed $199,900 MARMLS
- 2026-03-20 Price Changed $209,000 MARMLS
- 2026-01-06 Listed $220,000 MARMLS
- 2025-12-31 Listing Removed — MARMLS
- 2025-12-03 Price Changed $210,000 MARMLS
- 2025-11-21 Price Changed $213,000 MARMLS
- 2025-10-24 Price Changed $214,000 MARMLS
- 2025-08-07 Price Changed $219,000 MARMLS
- 2025-07-19 Price Changed $229,000 MARMLS
- 2025-07-14 Price Changed $239,000 MARMLS
- 2025-07-04 Listed $259,000 MARMLS
Property tax history
-0.7%/yrLatest (2025): $173 · -13.4% YoY. Source: county tax records.
Cash-flow waterfall
monthlySold comps — $/sqft
last 12 mo · ≤1 miLoading sold comps…