1203 Highway J · Troy, MO
Flood risk 1/10 · Minimal
- FEMA flood zone
- X (unshaded)
- Chance of flooding over 30 yrs
- 0.0%
- Est. flood insurance / yr
- $507 – $1,088
Fire risk 3/10 · Minor
- Est. fire insurance / yr
- $1,054 – $1,958
Heat risk 4/10 · Minor
- Hot days now (above 107°F)
- 7 days/yr
- Hot days in 30 yrs
- 19 days/yr
Wind risk 2/10 · Minimal
- Chance of severe wind over 30 yrs
- 1.0%
Air-quality risk 1/10 · Minimal
- Unhealthy air days now
- 0 days/yr
- Unhealthy air days in 30 yrs
- 0 days/yr
Risk factors via First Street. Map © Google.
Why this score? — see what drove the D- grade
The composite is a weighted blend of 9 inputs, each scored 0–100. Each bar is that input's sub-score; the figure is the points it added to the 100-point composite (weight × sub-score).
- Cash flow +10.6/30.0
- ARV discount +7.5/15.0
- Schools +3.8/10.0
- Livability +3.5/5.0
- DSCR +3.1/10.0
- Rent growth +2.5/5.0
- Condition / age +2.5/5.0
- 1% rule +1.8/10.0
- Appreciation +0.0/10.0
$210,000
🖨 Deal sheet (PDF) 📄 Offer letter ✓ Due diligence
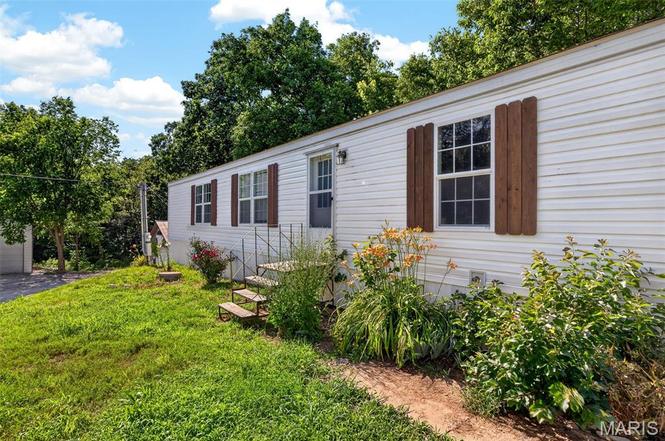
Listing remarks
Welcome to your own peaceful slice of Lincoln County at 1203 Highway J. This home offers the perfect blend of country privacy and everyday convenience, situated on a private 1-acre lot with NO RESTRICTIONS! Built in 2005, the property features a comfortable layout with 3 bedrooms and 2 full bathrooms. Outside, the standout feature is a massive 2-car detached garage, providing ample space for a workshop, vehicle parking, or extra storage. Enjoy the freedom of a massive yard with plenty of room to grow, park your outdoor toys, or simply unwind in a quiet retreat, all while staying just minutes away from local Troy amenities. Whether you are looking for a peaceful country starter home or a qu
Key facts
- Private 1 acre lot
- Massive yard
- 1 acre lot
Tags
Property features AI
Finance
- Financial info: Lease not considered
Exterior
- Parking: Off-street parking; Attached garage with four spaces (about 576 sq ft); Garage(s) on the property
- Utilities: Shared well water; Septic tank sewer; 220V electric service; Cable, electricity, sewer and water available
- Home design: Residential mobile home; One level
- Construction: Construction materials: other
- Exterior features: Private lot with a few trees; Other lot features
Interior
- Bedrooms: Four bedrooms on the main level
- Bathrooms: Two full bathrooms on the main level
- Heating & cooling: Forced air heating; Central air conditioning
- Interior features: Basement: none; Six total rooms
Neighborhood map
What this means for you Summary
Snapshot
- This is a 3-bed/2.0-bath manufactured listed at $210k.
Deal economics
- At list price, monthly cash flow is $-104 ($-1k/yr) — negative.
- To cash-flow at today's rent, offer at most $192k (8.8% below list).
- To meet the 1% rule (rent ≥ 1% of price), the offer needs to be $144k (31.5% below list).
- Recommended offer: $144k (31.5% below list) — sets the bar for 1% rule.
- Cap rate 5.7% vs local median 2.8% in Troy — top-decile yield for the area; either an underpriced asset or a hidden risk that comps aren't pricing in. Stress-test before assuming the spread holds.
Location & tenants
- Location reads 69/100 on livability (#146 in MO) — a middle-class / working-renter tenant base. Strengths: cost of living A+, housing A+, crime A; Watch: amenities F, commute F.
- Troy R-III (town): math 40% / reading 47% proficiency, ranked #97 of 324 in MO (top 30%) — families likely to look elsewhere, expect single-tenant / working-renter base with shorter leases.
- Zoned schools: Lincoln Elem. (math 50% / reading 56%, grade C, #221 of 1,115 statewide, top 20%, 427 students, 30% FRL); Troy Middle (math 40% / reading 45%, grade D-, #140 of 391 statewide, top 38%, 761 students, 39% FRL); Troy Buchanan High (math 40% / reading 58%, grade D, #145 of 521 statewide, top 28%, 2,188 students, 26% FRL) — zoned schools at 31% FRL track the district average.
- Market conditions: 157 active listings in the ZIP; solid renter incomes; 149 units permitted in Lincoln County in 2024 (0 in 5+ unit buildings).
Forward outlook
- Local home prices are declining (-3.0%/yr); year-one equity from $1k of loan paydown is wiped out by about $6k of value loss. Plan a longer hold.
- Lincoln County population projected at +6% by 2050 — modest demand growth; plan on rents tracking national, not racing it.
Negotiation context
- Only 11 days on market — expect competitive offers; lowballing is unlikely to land.
- Current owner paid $18k; list at $210k implies a 1035% gain — meaningful room to come down on a strong offer.
Questions for the listing agent
- What do current leases actually rent for vs. the listed asking? Can we see a recent rent roll and the last 12 months of T-12 income?
- Is there a deadline driving the sale (1031 exchange, divorce, estate, relocation)? That informs how much negotiation room exists.
- The area grade is low — what's the realistic commute time and amenity access for the typical tenant pool here? Any planned neighborhood developments (good or bad) we should know about?
- What's the average days-on-market for RENTAL listings here right now (not sales)? A rising rental-DOM trend means longer vacancies and softer asking-rent achievability than the comps imply.
- What's the recent tenant-quality profile in this submarket — average credit score on applications, eviction rate, late-payment / NSF rate, and stable-employment percentage? A property-management company in the area should have these aggregated.
- How much new for-sale + rental construction is in the pipeline within 1–3 miles? Heavy new supply typically softens prices + rents 12–24 months out; constrained supply supports both.
Investment metrics
- 1% rule
- 0.68% ✗
- Cap rate
- 5.70%
- Cash-on-cash
- -2.12%
- DSCR
- 0.91
- GRM
- 12.2
CMA / ARV
No comps found within radius.
Projected returns pro-forma
-3.0% appreciation · 3.0% rent growth · sell at horizon
- IRR
- -19.9%
- Equity multiple
- 0.31×
- Total profit
- $-40,765
- Equity at exit
- $31,312
- IRR
- -12.9%
- Equity multiple
- 0.24×
- Total profit
- $-44,472
- Equity at exit
- $18,157
Cash invested: $58,800 (down + closing). Projections, not guarantees.
Landlord ↔ Tenant lean methodology
- Overall (STATE)
- 81 Strongly Landlord-Friendly
- State Missouri
- 81 Strongly Landlord-Friendly · R+10
- County
- — inherits STATE
- City
- — inherits STATE
ZIP-level market 63379
- Home prices YoY
- -27.3%
- Active inventory
- 157
- Price-to-rent
- 12.2×
Monthly cashflow live
- Estimated rent
- $1,438 medium interval (Pro) →
- Mortgage (P&I)
- −$1,101
- Tax from tax record
- −$52 /mo · $618/yr
- Insurance
- −$88
- HOA
- −$0
- Vacancy / Maint / Mgmt
- −$302
- Net cashflow
- $-104
Break-even live
Sensitivity live
| Price | -10% $15 | -5% $-45 | +0% $-104 | +5% $-164 | +10% $-223 |
|---|---|---|---|---|---|
| Rent | -10% $-218 | -5% $-161 | +0% $-104 | +5% $-47 | +10% $10 |
| Rate | -1.0pp $2 | -0.5pp $-51 | base $-104 | +0.5pp $-158 | +1.0pp $-214 |
UW: 25.0% down · 7.5% · 30yr · 1.5% tax · 5.0% vac · 8.0% maint · 8.0% mgmt
Financing live
Cash to close
- Down payment
- $52,500
- Closing costs
- $6,300
- Reserves months
- —
- Total cash needed
- —
Loan-product check · same deal, 3 products live
Conventional
25% down · 7.5% · 30yr
- Down + closing
- —
- Monthly P&I
- —
- Monthly cashflow
- —
- DSCR
- —
- Eligible?
- —
Personal DTI + credit; lowest rate.
DSCR
20% down · 8.5% · 30yr
- Down + closing
- —
- Monthly P&I
- —
- Monthly cashflow
- —
- DSCR
- —
- Eligible?
- —
No personal income docs; deal must DSCR.
Hard money
10% down · 12.0% · 12mo
- Down + closing
- —
- Monthly P&I
- —
- Monthly cashflow
- —
- DSCR
- —
- Eligible?
- —
Short-term bridge; refi at stabilization.
Listing history 7 events
-
2026-06-21days on market $210,000 Active 11 DOM
-
2026-06-18days on market $210,000 Active 8 DOM
-
2026-06-17days on market $210,000 Active 7 DOM
-
2026-06-16days on market $210,000 Active 6 DOM
-
2026-06-15days on market $210,000 Active 5 DOM
-
2026-06-13remarks 699-char remark
-
2026-06-13$210,000 Active 3 DOM
ⓘ Source: listings_history table (triggers on properties + properties_extension) + one-shot
backfill from property_details.listing_events for pre-trigger history.
Tax reassessment forecast MO · Resets to sale price
- Current annual tax
- $618 · $52/mo
- Projected year-2 tax
- $2,037 · $170/mo
- Expected delta
- +$1,419/yr (+$118/mo · 229.4%)
ⓘ Screening estimate from a state-policy table — verify with the county assessor before closing.
Climate risk First Street
- Flood 1/10 Low FEMA zone X (unshaded) · 0% chance over 30 yrs
- Wildfire 3/10 Moderate
- Heat 4/10 Moderate 7 d/yr ≥107°F today · 19 d/yr by 30 yrs out
- Wind 2/10 Low 100% chance of damaging wind over 30 yrs
- Air quality 1/10 Low 0 unhealthy d/yr today · 0 by 30 yrs out
Nearby sold comps map
Loading sold comps map…
Walkable amenities ~0.75 mi
Loading nearby amenities…
Taxation est. · year 1
- Rental income
- $17,259
- − Mortgage interest
- −$11,763
- − Property taxes
- −$618
- − Insurance
- −$1,050
- − Repairs & maintenance
- −$1,381
- − Management
- −$1,381
- − Depreciation
- −$6,109
- Taxable loss
- −$5,043
- Est. tax savings @ 24.0%
- +$1,210
- After-tax cash flow
- $-39/yr
For passive investors: Depreciation is non-cash, so a rental often shows a tax loss while cash-flowing — sheltering income. Rental losses are passive: they offset passive income freely, and up to $25,000/yr can offset ordinary (W-2) income if you actively participate and your MAGI is under $100k (phasing out to $0 by $150k); unused losses carry forward. On sale, claimed depreciation is recaptured at up to 25%, and gains may owe capital-gains tax (a 1031 exchange can defer both). Figures are a year-1 estimate at your 24.0% rate — not tax advice; consult a CPA.
Schools (NCES district)
- District
- Troy R-III
- NCES district ID
- 2930450
- Math proficiency
- 40% ▼ -4.00%
- Reading proficiency
- 47% ▼ -1.00%
- Median HH income
- $56,629
- Composite
- 38.01/100
- National rank
- #4288
- State rank
- #97 of 324 in MO
Livability — Troy
- Score
- 69/100
- State rank
- #146
- US rank
- #8339
Category grades
Schools grade is shown separately in the Schools card above.
Census & demographics
- County
- Lincoln County · 27,731 people
- City population
- 27,731
- Metro
- St. Louis, MO-IL
- Population (ZIP)
- 27,731
- Household income
- $91,194
- Rent vs Own
- Severe rent burden
- 485.0
Population outlook (Lincoln County) Hauer SSP2
- Today (2025)
- 58,571 people
- By 2030
- 60,050 · +2.5%
- By 2040
- 61,982 · +5.8%
- By 2050
- 61,790 · +5.5%
- By 2075
- 58,249 · -0.5%
- By 2100
- 48,815 · -16.7%
Race, ethnicity, and origin ACS 2023
- Neighborhood character
- Predominantly White (92%)
- Race & ethnicity
- White 92% Two or more races 5% Hispanic / Latino 3%
- Common ancestry
- Lithuanian 4% Romanian 3% Italian 2%
- Foreign-born
- 1% · Canada
- Languages at home
- 97% English-only · Spanish 1% German/W. Germanic 1%
Political lean MEDSL · Lincoln
- 2024 margin
- Solid R (+55.9) · D 21.5% · R 77.4% · Other 1.1%
- 2008→2024 swing
- -44.5pp toward R · 2008: -11.4pp · 2024: -55.9pp
- All cycles
- 2024: R+55.9 2020: R+52.5 2016: R+50.5 2012: R+29.1 2008: R+11.4
Not yet ingested
- Civics
- —
Market trends
- HPI YoY
- ▼ -78.19%
- Current HPI
- 208.4941
- Rent YoY
- —
- Metro
- St. Louis, MO-IL
- State GDP YoY
- ▲ 1.84%
- F500 in state
- 20
Industry mix (Fortune 500 HQ in MO)
| Industry | F500 HQs | Revenue |
|---|---|---|
| Healthcare | 1 | $163B |
|
||
| Insurance | 1 | $21B |
|
||
| Industrial Technology | 1 | $17B |
|
||
| Retail | 1 | $16B |
|
||
| Industrial Distribution | 1 | $10B |
|
||
| Utilities | 1 | $9B |
|
||
Price history
+955.3% since first listed5 events — show timeline
- 2026-06-10 Listed $210,000 MARIS as Distributed by MLS Grid
- 2026-06-10 Coming Soon $210,000 MARIS as Distributed by MLS Grid
- 2017-10-30 Sold (Public Records) $18,500 Public Records
- 1988-08-23 Sold (Public Records) $27,500 Public Records
- 1980-11-28 Sold (Public Records) $19,900 Public Records
Property tax history
+2.1%/yrLatest (2025): $618 · +9.1% YoY. Source: county tax records.
Cash-flow waterfall
monthlySold comps — $/sqft
last 12 mo · ≤1 miLoading sold comps…