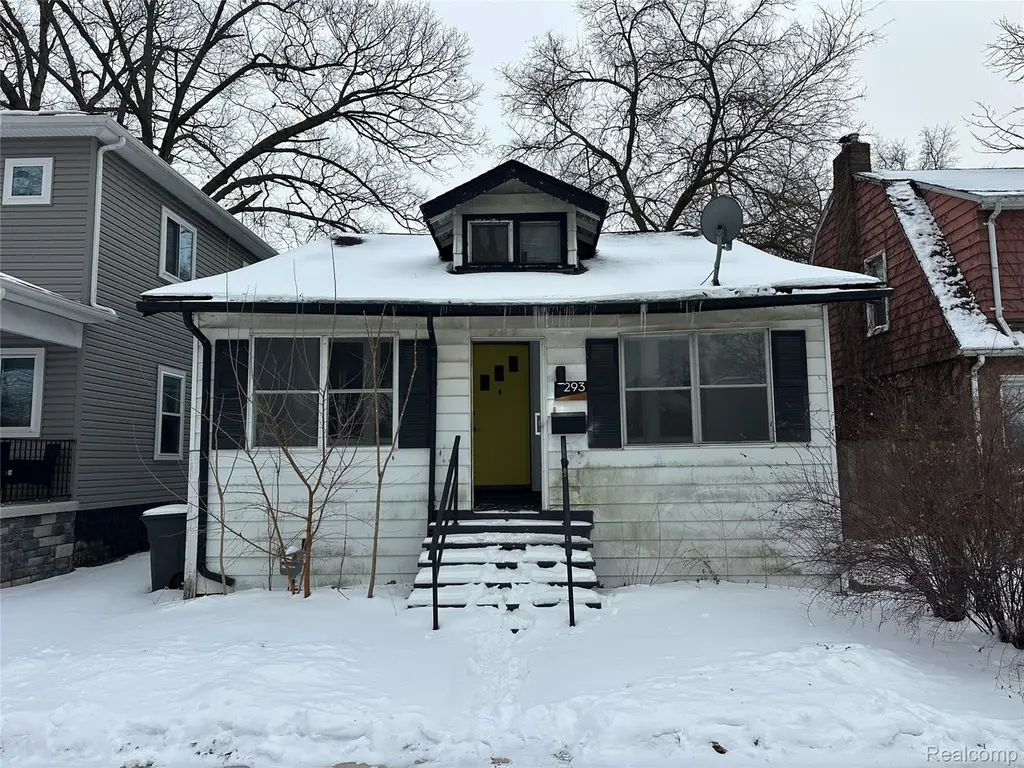
293 Fielding St · Ferndale, MI
Flood risk 1/10 · Minimal
- FEMA flood zone
- X (unshaded)
- Chance of flooding over 30 yrs
- 0.0%
- Est. flood insurance / yr
- $507 – $1,088
Fire risk 1/10 · Minimal
- Est. fire insurance / yr
- $784 – $1,456
Heat risk 3/10 · Minor
- Hot days now (above 97°F)
- 7 days/yr
- Hot days in 30 yrs
- 15 days/yr
Wind risk 2/10 · Minimal
- Chance of severe wind over 30 yrs
- —
Air-quality risk 4/10 · Minor
- Unhealthy air days now
- 4 days/yr
- Unhealthy air days in 30 yrs
- 6 days/yr
Risk factors via First Street. Map © Google.
Why this score? — see what drove the C grade
The composite is a weighted blend of 9 inputs, each scored 0–100. Each bar is that input's sub-score; the figure is the points it added to the 100-point composite (weight × sub-score).
- Cash flow +18.6/30.0
- ARV discount +15.0/15.0
- 1% rule +6.5/10.0
- DSCR +5.8/10.0
- Livability +4.5/5.0
- Rent growth +4.1/5.0
- Schools +2.5/10.0
- Condition / age +2.5/5.0
- Appreciation +0.0/10.0
$199,900
🖨 Deal sheet (PDF) 📄 Offer letter ✓ Due diligence
Listing remarks MLS
Great price and huge potential on this 3 bedroom 2 full bath bungalow on a basement. Originally set up as a duplex, would be an ideal mother-in-law upper suite with its own potential kitchen (plumbing in place), bedroom, siting room and bath. Lower level has 2 bedrooms, another bath, dining room and kitchen. Hardwood floors throughout. Some recent partial remodeling done in kitchen (whte Shaker style cabinets & granite counters & designer faucet), bathrooms and some newer paint & fixtures. Newer furnace. Price reflects further possible needed updates/repairs. No FHA or VA offers please. Being sold strictly as-is. .. seller will do no cleanout or repairs. Fenced yard has a garage (2 car with 1 car door). Enclosed front porch/3 season room. Room sizes are estimates. Information in this listing is deemed reliable but not guaranteed. Taxes are non-homestead so will be rated at a lower millage for an owner occupant buyer. Owner is a licensed broker in the state of Michigan.
Key facts
- Designer faucet
- Fenced yard
- Granite counters
Tags
Property features AI
Finance
- Other: Lot dimensions approximately 35 x 122 (0.1 acre)
- Financial info: No investor or income/expense details provided
- HOA & community: No HOA information provided
Exterior
- Parking: Detached 2-car garage; Paved road access
- Security: No security features provided
- Utilities: Public water; Public sewer
- Home design: Single-family residence; One and one-half stories; Ground-level entry with steps; Aluminum siding
- Construction: Block foundation
- Exterior features: Enclosed porch; Porch; Fenced backyard
Interior
- Kitchen: No kitchen appliance list provided
- Bedrooms: Total of 8 rooms (bedroom count not specified)
- Flooring: No flooring details provided
- Bathrooms: 2 full bathrooms
- Heating & cooling: Forced air heating; Natural gas heating; No cooling
- Interior features: Gas water heater; Unfinished basement
- Laundry & utility: No laundry details provided
Neighborhood map
What this means for you Summary
Snapshot
- This is a 3-bed/2.0-bath single-family listed at $200k.
Deal economics
- At list price, monthly cash flow is $192 ($2k/yr) — positive.
- The deal already cash-flows at list — no discount required.
- Meets the 1% rule at list price ($2k rent vs $200k).
- Recommended offer: $197k (1.5% below list) — sets the bar for market timing.
- Cap rate 7.4% vs local median 4.5% in Ferndale — top-decile yield for the area; either an underpriced asset or a hidden risk that comps aren't pricing in. Stress-test before assuming the spread holds.
Location & tenants
- Location reads 90/100 on livability (#8 in MI, #103 nationally) — a professional / high-income tenant draw. Strengths: amenities A+, commute A+, employment A+.
- Ferndale Public Schools (suburban): math 18% / reading 39% proficiency, ranked #366 of 540 in MI (top 68%) — low school quality limits family demand, transient renter base, plan for 1-2y turnover.
- Zoned schools: Ferndale Lower Elementary Campus (476 students, 53% FRL); Ferndale Middle School (math 13% / reading 35%, grade F, #396 of 493 statewide, top 81%, 540 students, 62% FRL); Ferndale High School (math 32% / reading 57%, grade F, #214 of 713 statewide, top 36%, 712 students, 58% FRL).
- Market conditions: Rents rising fast (+6.2%/yr); 179 active listings in the ZIP; 11 comparable units currently listed for rent nearby; rentals at typical pace (median 14d on market — plan ~3-4 weeks tenant-placement turnaround); solid renter incomes; 2,614 units permitted in Oakland County in 2024 (721 in 5+ unit buildings).
- This rent runs 31% of the median local income ($90k/yr) — at the standard rent-burdened threshold; future hikes will face affordability resistance.
Forward outlook
- Local home prices are declining (-3.0%/yr); year-one equity from $1k of loan paydown is wiped out by about $6k of value loss. Plan a longer hold.
- Oakland County population projected at +10% by 2050 — modest demand growth; plan on rents tracking national, not racing it.
Negotiation context
- It's been on market 21 days — a 2% lower offer ($197k) is reasonable based on typical stale-listing flexibility.
- 19 sale attempts since 15y ago with the ask held roughly flat each time — persistent listings suggest the price (not the market) is what's stuck; bring a comps-based counter.
Risks & watch-outs
- Watch-outs: property tax is 3.0% of price; built in 1923 — expect roof / HVAC / electrical / plumbing capex.
Questions for the listing agent
- Built in 1923 — when were the roof, HVAC, electrical panel, plumbing, and water heater last replaced?
- Property tax is high relative to price — has the assessment been appealed recently, and will the sale trigger a re-assessment?
- Is there a deadline driving the sale (1031 exchange, divorce, estate, relocation)? That informs how much negotiation room exists.
- Schools are D-rated, which usually means shorter tenancies and higher turnover. Who's the typical renter profile here, and what's been the actual vacancy rate?
- What's the average days-on-market for RENTAL listings here right now (not sales)? A rising rental-DOM trend means longer vacancies and softer asking-rent achievability than the comps imply.
- What's the recent tenant-quality profile in this submarket — average credit score on applications, eviction rate, late-payment / NSF rate, and stable-employment percentage? A property-management company in the area should have these aggregated.
- How much new for-sale + rental construction is in the pipeline within 1–3 miles? Heavy new supply typically softens prices + rents 12–24 months out; constrained supply supports both.
Investment metrics
- 1% rule
- 1.15% ✓
- Cap rate
- 7.45%
- Cash-on-cash
- 4.12%
- DSCR
- 1.18
- GRM
- 7.2
CMA / ARV
- ARV (median comp)
- $246,171
- List price
- $199,900
- Delta
- -18.80%
- Verdict
- UNDERPRICED
- Comps
- 20 within 1.0 mi
Show comp detail 12 sales within ~0.75 mi
| Address | Dist | Beds/Ba | Sqft | Sold | Price | $/sf | Match |
|---|---|---|---|---|---|---|---|
| 233 Silman St | 0.24mi | 3/2.0 | 1,970 (-0%) | 1mo | $382,000 | $194 | 88 |
| 287 Fielding. St | 0.01mi | 3/2.5 | 1,762 (-11%) | 3mo | $331,000 | $188 | 77 |
| 2548 Woodstock Dr | 0.28mi | 4/2.5 (+1) | 1,997 (+1%) | 4mo | $237,000 | $119 | 75 |
| 923 Gardendale St | 0.61mi | 3/2.0 | 1,992 (+1%) | 0mo | $375,000 | $188 | 70 |
| 370 Channing St | 0.34mi | 3/1.0 | 1,821 (-8%) | 2mo | $295,000 | $162 | 65 |
| 211 Silman St | 0.23mi | 4/2.5 (+1) | 2,187 (+11%) | 2mo | $285,000 | $130 | 62 |
| 298 W Saratoga St | 0.75mi | 3/2.0 | 1,972 (-0%) | 4mo | $408,000 | $207 | 62 |
| 770 Meadowdale St | 0.49mi | 3/1.0 | 1,779 (-10%) | 0mo | $260,000 | $146 | 56 |
| 398 W Hazelhurst St | 0.53mi | 3/1.5 | 1,784 (-10%) | 4mo | $317,500 | $178 | 54 |
| 408 College St | 0.52mi | 3/2.5 | 2,197 (+11%) | 2mo | $585,000 | $266 | 53 |
| 860 Gardendale St | 0.57mi | 4/2.0 (+1) | 2,216 (+12%) | 4mo | $399,900 | $180 | 44 |
| 621 W Hazelhurst St | 0.64mi | 4/2.5 (+1) | 1,758 (-11%) | 0mo | $475,000 | $270 | 44 |
Match score weights: distance 35% · size 25% · config 20% · recency 20%. Top-matched comps best support the ARV.
Projected returns pro-forma
-3.0% appreciation · 6.24% rent growth · sell at horizon
- IRR
- -5.6%
- Equity multiple
- 0.78×
- Total profit
- $-12,210
- Equity at exit
- $29,806
- IRR
- 8.0%
- Equity multiple
- 1.71×
- Total profit
- $39,898
- Equity at exit
- $17,284
Cash invested: $55,972 (down + closing). Projections, not guarantees.
Landlord ↔ Tenant lean methodology
- Overall (STATE)
- 62 Landlord-Friendly
- State Michigan
- 62 Landlord-Friendly · EVEN
- County
- — inherits STATE
- City
- — inherits STATE
ZIP-level market 48220
- Rents YoY
- 6.2%
- Active inventory
- 179
- Price-to-rent
- 7.2×
Monthly cashflow live
- Estimated rent
- $2,304 high interval (Pro) →
- Mortgage (P&I)
- −$1,048
- Tax from tax record
- −$496 /mo · $5,953/yr
- Insurance
- −$83
- HOA
- −$0
- Vacancy / Maint / Mgmt
- −$484
- Net cashflow
- $192
Break-even live
Sensitivity live
| Price | -10% $305 | -5% $249 | +0% $192 | +5% $136 | +10% $79 |
|---|---|---|---|---|---|
| Rent | -10% $10 | -5% $101 | +0% $192 | +5% $283 | +10% $374 |
| Rate | -1.0pp $293 | -0.5pp $243 | base $192 | +0.5pp $140 | +1.0pp $88 |
UW: 25.0% down · 7.5% · 30yr · 1.5% tax · 5.0% vac · 8.0% maint · 8.0% mgmt
Financing live
Cash to close
- Down payment
- $49,975
- Closing costs
- $5,997
- Reserves months
- —
- Total cash needed
- —
Loan-product check · same deal, 3 products live
Conventional
25% down · 7.5% · 30yr
- Down + closing
- —
- Monthly P&I
- —
- Monthly cashflow
- —
- DSCR
- —
- Eligible?
- —
Personal DTI + credit; lowest rate.
DSCR
20% down · 8.5% · 30yr
- Down + closing
- —
- Monthly P&I
- —
- Monthly cashflow
- —
- DSCR
- —
- Eligible?
- —
No personal income docs; deal must DSCR.
Hard money
10% down · 12.0% · 12mo
- Down + closing
- —
- Monthly P&I
- —
- Monthly cashflow
- —
- DSCR
- —
- Eligible?
- —
Short-term bridge; refi at stabilization.
Rent comps 11 comps
| Address | Beds | Baths | Sqft | Rent | $/sqft | DOM | Units | Dist |
|---|---|---|---|---|---|---|---|---|
| 351 Edgewood Pl Unit 2 Ferndale, MI | 3.0 | 2.0 | 1600 | $2,200 | $1.38 | 19d | 1 | 0.11mi |
| 2554 Woodstock Dr Highland Park, MI | 3.0 | 1.5 | 1929 | $2,250 | $1.17 | 16d | 1 | 0.24mi |
| 394 Hilton Rd #101 Ferndale, MI | 2.0 | 2.0 | 1506 | $2,500 | $1.66 | 4d | 1 | 0.39mi |
| 695 Livernois St Unit 1 Ferndale, MI | 2.0 | 2.0 | 1500 | $2,750 | $1.83 | 14d | 1 | 0.69mi |
| 320 E Troy St Ferndale, MI | 4.0 | 2.0 | 1627 | $2,200 | $1.35 | 45d | 1 | 0.74mi |
| 631 Shasta Pl Ferndale, MI | 3.0 | 2.0 | 1317 | $2,100 | $1.59 | 45d | 1 | 0.85mi |
| 1330 E Chesterfield St Ferndale, MI | 4.0 | 2.0 | 1795 | $2,800 | $1.56 | 0d | 1 | 0.93mi |
| 329 W Muir Ave Hazel Park, MI | 4.0 | 2.0 | 1606 | $2,000 | $1.25 | 12d | 1 | 1.18mi |
| 1557 Leroy St Ferndale, MI | 3.0 | 2.0 | 1380 | $2,523 | $1.83 | 6d | 1 | 1.31mi |
| 2705 Inman St Ferndale, MI | 3.0 | 2.5 | 1429 | $3,195 | $2.24 | 0d | 1 | 1.37mi |
| 2803 Grayson St Ferndale, MI | 3.0 | 2.0 | 1274 | $2,000 | $1.57 | 45d | 1 | 1.42mi |
Listing history 50 events
-
2026-06-21days on market $199,900 Active 21 DOM
-
2026-06-18days on market $199,900 Active 18 DOM
-
2026-06-17days on market $199,900 Active 17 DOM
-
2026-06-16days on market $199,900 Active 16 DOM
-
2026-06-15days on market $199,900 Active 15 DOM
-
2026-06-13days on market $199,900 Active 13 DOM
-
2026-06-13days on market $199,900 Active 12 DOM
-
2026-06-09days on market $199,900 Active 9 DOM
-
2026-06-08days on market $199,900 Active 8 DOM
-
2026-06-07days on market $199,900 Active 7 DOM
-
2026-06-04days on market $199,900 Active 4 DOM
-
2026-06-03days on market $199,900 Active 3 DOM
-
2026-06-02days on market $199,900 Active 2 DOM
-
2026-06-01days on market $199,900 Active 1 DOM
-
2026-02-18$199,900 Active 1001-char remark
-
2026-02-17$199,900 Active 1001-char remark
-
2026-02-17historical
-
2026-02-17historical
-
2026-01-26$224,900 Active
-
2026-01-25$224,900 Active
-
2025-12-18historical
-
2025-12-17$240,000 Active
-
2025-12-17$240,000 Active
-
2024-09-20soldstatus $200,000 Sold
-
2024-09-20soldstatus $200,000 Sold
-
2024-09-20soldstatus $200,000 Closed
-
2024-09-20soldstatus $200,000 Closed
-
2024-08-21status Pending
-
2024-08-21status Pending
-
2024-08-21status Pending
-
2024-08-21status Pending
-
2024-07-04$199,900 Active
-
2024-07-04$199,900 Active
-
2024-07-04$199,900 Active
-
2024-07-04$199,900 Active
-
2024-06-30status Pending
-
2024-06-30status Pending
-
2024-06-28status Pending
-
2024-06-28status Pending
-
2024-06-28historical
-
2024-06-28historical
-
2024-06-28historical
-
2024-06-28historical
-
2024-06-22$199,900 Active
-
2024-06-22$199,900 Active
-
2024-06-22$199,900 Active
-
2024-06-22$199,900 Active
-
2012-08-08historical
-
2012-04-09soldstatus $27,900
-
2012-04-09soldstatus $27,900
ⓘ Source: listings_history table (triggers on properties + properties_extension) + one-shot
backfill from property_details.listing_events for pre-trigger history.
Tax reassessment forecast MI · Partial reset (capped growth)
- Current annual tax
- $5,953 · $496/mo
- Projected year-2 tax
- $5,953 · $496/mo
- Expected delta
- $0/yr ($0/mo · 0.0%)
ⓘ Screening estimate from a state-policy table — verify with the county assessor before closing.
Climate risk First Street
- Flood 1/10 Low FEMA zone X (unshaded) · 0% chance over 30 yrs
- Wildfire 1/10 Low
- Heat 3/10 Moderate 7 d/yr ≥97°F today · 15 d/yr by 30 yrs out
- Wind 2/10 Low
- Air quality 4/10 Moderate 4 unhealthy d/yr today · 6 by 30 yrs out
Nearby sold comps map
Loading sold comps map…
Walkable amenities ~0.75 mi
Loading nearby amenities…
Taxation est. · year 1
- Rental income
- $27,644
- − Mortgage interest
- −$11,198
- − Property taxes
- −$5,953
- − Insurance
- −$1,000
- − Repairs & maintenance
- −$2,212
- − Management
- −$2,212
- − Depreciation
- −$5,815
- Taxable loss
- −$744
- Est. tax savings @ 24.0%
- +$179
- After-tax cash flow
- $2,485/yr
For passive investors: Depreciation is non-cash, so a rental often shows a tax loss while cash-flowing — sheltering income. Rental losses are passive: they offset passive income freely, and up to $25,000/yr can offset ordinary (W-2) income if you actively participate and your MAGI is under $100k (phasing out to $0 by $150k); unused losses carry forward. On sale, claimed depreciation is recaptured at up to 25%, and gains may owe capital-gains tax (a 1031 exchange can defer both). Figures are a year-1 estimate at your 24.0% rate — not tax advice; consult a CPA.
Schools (NCES district)
- District
- Ferndale Public Schools
- NCES district ID
- 2614280
- Math proficiency
- 18% ▼ -3.00%
- Reading proficiency
- 39% ▲ 5.00%
- Median HH income
- $56,069
- Composite
- 25.46/100
- National rank
- #7449
- State rank
- #366 of 540 in MI
Livability — Ferndale
- Score
- 90/100
- State rank
- #8
- US rank
- #103
Category grades
Schools grade is shown separately in the Schools card above.
Census & demographics
- Census place
- Ferndale, MI
- County
- Oakland County · 1,009,092 people
- City population
- 21,527
- Metro
- Detroit-Warren-Dearborn, MI
- Population (ZIP)
- 21,527
- Household income
- $89,881
- Rent vs Own
- Severe rent burden
- 670.0
Population outlook (Oakland County) Hauer SSP2
- Today (2025)
- 1,335,747 people
- By 2030
- 1,375,100 · +2.9%
- By 2040
- 1,435,385 · +7.5%
- By 2050
- 1,469,250 · +10.0%
- By 2075
- 1,531,946 · +14.7%
- By 2100
- 1,450,485 · +8.6%
Race, ethnicity, and origin ACS 2023
- Neighborhood character
- Predominantly White (72%)
- Race & ethnicity
- White 72% Black 15% Two or more races 6% Hispanic / Latino 5% Asian 3%
- Common ancestry
- Romanian 11% Lithuanian 6% Slovak 3%
- Foreign-born
- 4% · Canada, South Korea
- Languages at home
- 95% English-only · Spanish 2% Other Indo-European 1% German/W. Germanic 1%
Political lean MEDSL · Oakland
- 2024 margin
- D (+10.6) · D 54.4% · R 43.8% · Other 1.9%
- 2008→2024 swing
- -3.9pp toward R · 2008: 14.5pp · 2024: 10.6pp
- All cycles
- 2024: D+10.6 2020: D+14.1 2016: D+8.1 2012: D+8.1 2008: D+14.5
Not yet ingested
- Civics
- —
Market trends
- HPI YoY
- ▼ -394.92%
- Current HPI
- 273.0986
- Rent YoY
- ▲ 6.24%
- Metro
- Detroit-Warren-Dearborn, MI
- State GDP YoY
- ▲ 1.37%
- F500 in state
- 28
Industry mix (Fortune 500 HQ in MI)
| Industry | F500 HQs | Revenue |
|---|---|---|
| Automotive Parts | 3 | $48B |
|
||
| Automotive | 2 | $372B |
|
||
| Chemicals | 1 | $45B |
|
||
| Automotive Retail | 1 | $29B |
|
||
| Healthcare / Medical Devices | 1 | $23B |
|
||
| Automotive Technology | 1 | $20B |
|
||
Price history
+1010.6% since first listed48 events — show timeline
- 2026-05-31 Listed $199,900 REALCOMP
- 2026-05-31 Listing Removed — MiRealSource-MiMLS
- 2026-05-31 Listed $199,900 MiRealSource-MiMLS
- 2026-05-31 Listing Removed — REALCOMP
- 2026-02-18 Listed $199,900 REALCOMP
- 2026-02-17 Listing Removed — MiRealSource-MiMLS
- 2026-02-17 Listing Removed — REALCOMP
- 2026-02-17 Listed $199,900 MiRealSource-MiMLS
- 2026-01-26 Listed $224,900 REALCOMP
- 2026-01-25 Listed $224,900 MiRealSource-MiMLS
- 2025-12-18 Listing Removed — MiRealSource-MiMLS
- 2025-12-17 Listed $240,000 MiRealSource-MiMLS
- 2025-12-17 Listed $240,000 REALCOMP
- 2024-09-20 Sold (MLS) $200,000 MiRealSource-MiMLS
- 2024-09-20 Sold (MLS) $200,000 MiRealSource-MiMLS
- 2024-09-20 Sold (MLS) $200,000 REALCOMP
- 2024-09-20 Sold (MLS) $200,000 REALCOMP
- 2024-08-21 Pending — MiRealSource-MiMLS
- 2024-08-21 Pending — REALCOMP
- 2024-08-21 Pending — MiRealSource-MiMLS
- 2024-08-21 Pending — REALCOMP
- 2024-07-04 Listed $199,900 MiRealSource-MiMLS
- 2024-07-04 Listed $199,900 MiRealSource-MiMLS
- 2024-07-04 Listed $199,900 REALCOMP
- 2024-07-04 Listed $199,900 REALCOMP
- 2024-06-30 Pending — MiRealSource-MiMLS
- 2024-06-30 Pending — REALCOMP
- 2024-06-28 Pending — MiRealSource-MiMLS
- 2024-06-28 Pending — REALCOMP
- 2024-06-28 Listing Removed — MiRealSource-MiMLS
- 2024-06-28 Listing Removed — MiRealSource-MiMLS
- 2024-06-28 Listing Removed — REALCOMP
- 2024-06-28 Listing Removed — REALCOMP
- 2024-06-22 Listed $199,900 MiRealSource-MiMLS
- 2024-06-22 Listed $199,900 MiRealSource-MiMLS
- 2024-06-22 Listed $199,900 REALCOMP
- 2024-06-22 Listed $199,900 REALCOMP
- 2012-08-08 Listing Removed — MiRealSource-MiMLS
- 2012-04-09 Sold (MLS) $27,900 REALCOMP
- 2012-04-09 Sold (MLS) $27,900 MiRealSource-MiMLS
- 2012-03-20 Listing Removed — REALCOMP
- 2012-03-20 Listing Removed — MiRealSource-MiMLS
- 2011-09-20 Listed $29,900 REALCOMP
- 2011-09-20 Listed $29,900 MiRealSource-MiMLS
- 2011-08-08 Listed $595 MiRealSource-MiMLS
- 1990-10-10 Sold (Public Records) $33,000 Public Records
- 1990-10-10 Sold (Public Records) $18,000 Public Records
- 1973-03-01 Sold (Public Records) $18,000 Public Records
Property tax history
+7.2%/yrLatest (2025): $5,953 · +79.2% YoY. Source: county tax records.
Cash-flow waterfall
monthlySold comps — $/sqft
last 12 mo · ≤1 miLoading sold comps…