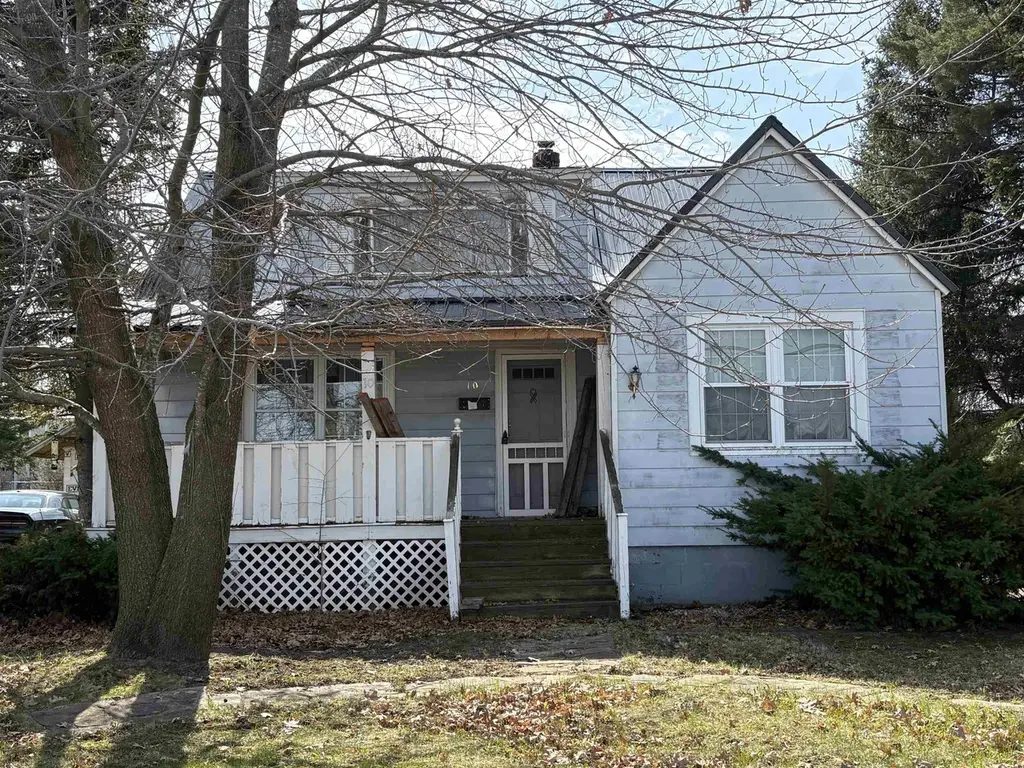
10 Burney Ave · Massena, NY
Flood risk 6/10 · Moderate
- FEMA flood zone
- —
- Chance of flooding over 30 yrs
- 0.69%
- Est. flood insurance / yr
- —
Fire risk 3/10 · Minor
- Est. fire insurance / yr
- $691 – $1,283
Heat risk 2/10 · Minimal
- Hot days now (above 93°F)
- 7 days/yr
- Hot days in 30 yrs
- 15 days/yr
Wind risk 1/10 · Minimal
- Chance of severe wind over 30 yrs
- —
Air-quality risk 2/10 · Minimal
- Unhealthy air days now
- 1 days/yr
- Unhealthy air days in 30 yrs
- 1 days/yr
Risk factors via First Street. Map © Google.
Why this score? — see what drove the B grade
The composite is a weighted blend of 9 inputs, each scored 0–100. Each bar is that input's sub-score; the figure is the points it added to the 100-point composite (weight × sub-score).
- Cash flow +30.0/30.0
- 1% rule +10.0/10.0
- DSCR +10.0/10.0
- ARV discount +7.5/15.0
- Schools +3.9/10.0
- Livability +3.7/5.0
- Rent growth +2.5/5.0
- Condition / age +2.5/5.0
- Appreciation +0.0/10.0
$29,000
🖨 Deal sheet (PDF) 📄 Offer letter ✓ Due diligence
Listing remarks MLS
This handyman special has great bones, and with some TLC could be restored to the cute 4 bedroom 1.5 bathroom it once was. It’s located on a quiet street with great neighbors, a level backyard, a large paved driveway big enough for 3-4 vehicles, and an oversized storage shed. All windows are vinyl replacements. Living room floor is newer hardwood. Dining room floor is newer tile laminate. Appliances convey. Furnace was new in Feb 2007.
Key facts
- Bright kitchen
- Newer metal roof
- Classic wood floors
Tags
Property features AI
Exterior
- Utilities: Public water; Public sewer; Cable available; Natural gas available
- Home design: Residential property; 2-story
- Construction: Aluminum siding
- Exterior features: Covered patio/porch; Level lot; Publicly maintained road access
Interior
- Bedrooms: Total of 7 rooms (bedrooms count not specified)
- Flooring: Carpet; Hardwood; Laminate; Vinyl; Wood
- Bathrooms: 1 full bathroom; 1 half bathroom
- Heating & cooling: Forced air heating; Natural gas available
- Interior features: Insulated windows; Basement present
- Laundry & utility: Laundry in basement
Neighborhood map
What this means for you Summary
Snapshot
- This is a 4-bed/1.5-bath single-family listed at $29k.
Deal economics
- At list price, monthly cash flow is $728 ($9k/yr) — positive.
- The deal already cash-flows at list — no discount required.
- Meets the 1% rule at list price ($1k rent vs $29k).
- Recommended offer: $29k (1.5% below list) — sets the bar for market timing.
- Cap rate 36.4% vs local median 5.2% in Massena — top-decile yield for the area; either an underpriced asset or a hidden risk that comps aren't pricing in. Stress-test before assuming the spread holds.
Location & tenants
- Location reads 73/100 on livability (#330 in NY) — a middle-class / working-renter tenant base. Strengths: cost of living A+, housing A+, health & safety A+; Watch: amenities D, crime D-, commute F.
- Massena Central School District (town): math 43% / reading 49% proficiency, ranked #456 of 590 in NY (top 77%) — families likely to look elsewhere, expect single-tenant / working-renter base with shorter leases.
- Zoned schools: J William Leary Junior High School (math 29% / reading 36%, grade F, #504 of 729 statewide, top 70%, 368 students, 61% FRL); Massena Senior High School (math 87% / reading 75%, grade A, #485 of 1,100 statewide, top 45%, 826 students, 61% FRL).
- Market conditions: 175 active listings in the ZIP; 215 units permitted in St. Lawrence County in 2024 (0 in 5+ unit buildings).
Forward outlook
- Local home prices are declining (-3.0%/yr); year-one equity from $200 of loan paydown is wiped out by about $870 of value loss. Plan a longer hold.
- St. Lawrence County population projected at -14% by 2050 — secular population decline; favor cash flow + early exit over multi-decade hold.
- At projected returns (-3.0% appreciation + 3.0% rent growth), your $8k cash investment doubles in ~2 years — after that, you're playing with house money.
Negotiation context
- It's been on market 19 days — a 2% lower offer ($29k) is reasonable based on typical stale-listing flexibility.
- 2 sale attempts since 4y ago with the ask held roughly flat each time — persistent listings suggest the price (not the market) is what's stuck; bring a comps-based counter.
- Current owner paid $16k; list at $29k implies a 81% gain — meaningful room to come down on a strong offer.
Risks & watch-outs
- Watch-outs: built in 1940 — expect roof / HVAC / electrical / plumbing capex.
- Climate carrying-cost: major flood risk — expect insurance premiums to compound above CPI over the hold.
Questions for the listing agent
- Built in 1940 — when were the roof, HVAC, electrical panel, plumbing, and water heater last replaced?
- Is there a deadline driving the sale (1031 exchange, divorce, estate, relocation)? That informs how much negotiation room exists.
- Crime grade is D in this area — have there been break-ins, vandalism, or insurance claims at this property in the last 3 years? What carrier currently insures it and at what premium?
- What's the average days-on-market for RENTAL listings here right now (not sales)? A rising rental-DOM trend means longer vacancies and softer asking-rent achievability than the comps imply.
- What's the recent tenant-quality profile in this submarket — average credit score on applications, eviction rate, late-payment / NSF rate, and stable-employment percentage? A property-management company in the area should have these aggregated.
- How much new for-sale + rental construction is in the pipeline within 1–3 miles? Heavy new supply typically softens prices + rents 12–24 months out; constrained supply supports both.
Investment metrics
- 1% rule
- 4.05% ✓
- Cap rate
- 36.40%
- Cash-on-cash
- 107.52%
- DSCR
- 5.78
- GRM
- 2.1
CMA / ARV
- ARV (median comp)
- $99,001
- List price
- $29,000
- Delta
- -70.71%
- Verdict
- UNDERPRICED
- Comps
- 20 within 1.0 mi
Show comp detail 12 sales within ~0.75 mi
| Address | Dist | Beds/Ba | Sqft | Sold | Price | $/sf | Match |
|---|---|---|---|---|---|---|---|
| 3 Brighton St | 0.23mi | 3/1.0 (-1) | 1,300 (+2%) | 11mo | $153,700 | $118 | 69 |
| 29 Malby Ave | 0.24mi | 4/2.0 | 1,400 (+10%) | 6mo | $97,000 | $69 | 65 |
| 29 Talcott St | 0.16mi | 3/2.0 (-1) | 1,125 (-12%) | 6mo | $101,000 | $90 | 62 |
| 7 Alden St | 0.16mi | 3/1.0 (-1) | 1,100 (-14%) | 2mo | $54,000 | $49 | 61 |
| 37 Bishop Ave | 0.46mi | 3/1.0 (-1) | 1,248 (-2%) | 12mo | $103,000 | $83 | 58 |
| 13 Ridgewood Ave | 0.52mi | 3/1.0 (-1) | 1,196 (-6%) | 6mo | $91,500 | $77 | 54 |
| 60 Cornell Ave | 0.54mi | 3/1.5 (-1) | 1,232 (-3%) | 14mo | $125,000 | $101 | 53 |
| 11 Liberty Ave | 0.44mi | 4/1.5 | 1,100 (-14%) | 14mo | $87,980 | $80 | 46 |
| 30 Urban Dr | 0.58mi | 3/2.0 (-1) | 1,400 (+10%) | 5mo | $231,000 | $165 | 45 |
| 12 Randall Dr | 0.51mi | 3/2.0 (-1) | 1,144 (-10%) | 9mo | $155,000 | $135 | 45 |
| 49 Grove St | 0.58mi | 3/1.0 (-1) | 1,400 (+10%) | 6mo | $130,000 | $93 | 44 |
| 63 Liberty Ave | 0.64mi | 3/1.0 (-1) | 1,190 (-6%) | 10mo | $85,000 | $71 | 44 |
Match score weights: distance 35% · size 25% · config 20% · recency 20%. Top-matched comps best support the ARV.
Projected returns pro-forma
-3.0% appreciation · 3.0% rent growth · sell at horizon
- IRR
- —
- Equity multiple
- 6.13×
- Total profit
- $41,656
- Equity at exit
- $4,324
- IRR
- —
- Equity multiple
- 12.82×
- Total profit
- $96,013
- Equity at exit
- $2,507
Cash invested: $8,120 (down + closing). Projections, not guarantees.
Landlord ↔ Tenant lean methodology
- Overall (STATE)
- 15 Strongly Tenant-Friendly
- State New York
- 15 Strongly Tenant-Friendly · D+10
- County
- — inherits STATE
- City
- — inherits STATE
ZIP-level market 13662
- Home prices YoY
- -6.4%
- Active inventory
- 175
- Price-to-rent
- 2.1×
Monthly cashflow live
- Estimated rent
- $1,175 medium interval (Pro) →
- Mortgage (P&I)
- −$152
- Tax est. 1.5%
- −$36 /mo · $435/yr
- Insurance
- −$12
- HOA
- −$0
- Vacancy / Maint / Mgmt
- −$247
- Net cashflow
- $728
Break-even live
Sensitivity live
| Price | -10% $748 | -5% $738 | +0% $728 | +5% $718 | +10% $708 |
|---|---|---|---|---|---|
| Rent | -10% $635 | -5% $681 | +0% $728 | +5% $774 | +10% $820 |
| Rate | -1.0pp $742 | -0.5pp $735 | base $728 | +0.5pp $720 | +1.0pp $712 |
UW: 25.0% down · 7.5% · 30yr · 1.5% tax · 5.0% vac · 8.0% maint · 8.0% mgmt
Financing live
Cash to close
- Down payment
- $7,250
- Closing costs
- $870
- Reserves months
- —
- Total cash needed
- —
Loan-product check · same deal, 3 products live
Conventional
25% down · 7.5% · 30yr
- Down + closing
- —
- Monthly P&I
- —
- Monthly cashflow
- —
- DSCR
- —
- Eligible?
- —
Personal DTI + credit; lowest rate.
DSCR
20% down · 8.5% · 30yr
- Down + closing
- —
- Monthly P&I
- —
- Monthly cashflow
- —
- DSCR
- —
- Eligible?
- —
No personal income docs; deal must DSCR.
Hard money
10% down · 12.0% · 12mo
- Down + closing
- —
- Monthly P&I
- —
- Monthly cashflow
- —
- DSCR
- —
- Eligible?
- —
Short-term bridge; refi at stabilization.
Listing history 5 events
-
2026-05-11status Pending 879-char remark
-
2026-04-20$29,000 Active 879-char remark
-
2023-01-27soldstatus $16,000 445-char remark
Show marketing remark (445 chars)
This handyman special has great bones, and with some TLC could be restored to the cute 4 bedroom 1.5 bathroom it once was. It’s located on a quiet street with great neighbors, a level backyard, a large paved driveway big enough for 3-4 vehicles, and an oversized storage shed. All windows are vinyl replacements. Living room floor is newer hardwood. Dining room floor is newer tile laminate. Appliances convey. Furnace was new in Feb 2007.
-
2022-11-02$34,000 445-char remark
Show marketing remark (445 chars)
This handyman special has great bones, and with some TLC could be restored to the cute 4 bedroom 1.5 bathroom it once was. It’s located on a quiet street with great neighbors, a level backyard, a large paved driveway big enough for 3-4 vehicles, and an oversized storage shed. All windows are vinyl replacements. Living room floor is newer hardwood. Dining room floor is newer tile laminate. Appliances convey. Furnace was new in Feb 2007.
-
2001-11-01soldstatus $47,000
ⓘ Source: listings_history table (triggers on properties + properties_extension) + one-shot
backfill from property_details.listing_events for pre-trigger history.
Climate risk First Street
- Flood 6/10 Major 69% chance over 30 yrs
- Wildfire 3/10 Moderate
- Heat 2/10 Low 7 d/yr ≥93°F today · 15 d/yr by 30 yrs out
- Wind 1/10 Low
- Air quality 2/10 Low 1 unhealthy d/yr today · 1 by 30 yrs out
Nearby sold comps map
Loading sold comps map…
Walkable amenities ~0.75 mi
Loading nearby amenities…
Taxation est. · year 1
- Rental income
- $14,096
- − Mortgage interest
- −$1,624
- − Property taxes
- −$435
- − Insurance
- −$145
- − Repairs & maintenance
- −$1,128
- − Management
- −$1,128
- − Depreciation
- −$844
- Taxable income
- $8,792
- Est. tax owed @ 24.0%
- −$2,110
- After-tax cash flow
- $6,620/yr
For passive investors: Depreciation is non-cash, so a rental often shows a tax loss while cash-flowing — sheltering income. Rental losses are passive: they offset passive income freely, and up to $25,000/yr can offset ordinary (W-2) income if you actively participate and your MAGI is under $100k (phasing out to $0 by $150k); unused losses carry forward. On sale, claimed depreciation is recaptured at up to 25%, and gains may owe capital-gains tax (a 1031 exchange can defer both). Figures are a year-1 estimate at your 24.0% rate — not tax advice; consult a CPA.
Schools (NCES district)
- District
- Massena Central School District
- NCES district ID
- 3618660
- Math proficiency
- 43% ▼ -10.00%
- Reading proficiency
- 49% ▲ 1.00%
- Median HH income
- $42,610
- Composite
- 38.75/100
- National rank
- #4123
- State rank
- #456 of 590 in NY
Livability — Massena
- Score
- 73/100
- State rank
- #330
- US rank
- #5449
Category grades
Schools grade is shown separately in the Schools card above.
Census & demographics
- Census place
- Massena, NY
- City population
- 15,737
- Population (ZIP)
- 15,737
Population outlook (St. Lawrence County) Hauer SSP2
- Today (2025)
- 110,027 people
- By 2030
- 107,455 · -2.3%
- By 2040
- 100,492 · -8.7%
- By 2050
- 94,254 · -14.3%
- By 2075
- 80,175 · -27.1%
- By 2100
- 63,140 · -42.6%
Race, ethnicity, and origin ACS 2023
- Neighborhood character
- Predominantly White (93%)
- Race & ethnicity
- White 93% Two or more races 4% Hispanic / Latino 2%
- Common ancestry
- Lithuanian 12% Slovak 2% Romanian 2%
- Foreign-born
- 4% · Canada
- Languages at home
- 96% English-only · French/Haitian/Cajun 1% Spanish 1% Russian/Polish/Slavic 1%
Political lean MEDSL · St. Lawrence
- 2024 margin
- R (+18.0) · D 41.0% · R 59.0%
- 2008→2024 swing
- -34.3pp toward R · 2008: 16.3pp · 2024: -18.0pp
- All cycles
- 2024: R+18.0 2020: R+11.7 2016: R+10.8 2012: D+16.6 2008: D+16.3
Not yet ingested
- Civics
- —
Market trends
- HPI YoY
- ▼ -16.77%
- Current HPI
- 243.4674
- Rent YoY
- —
- Metro
- —
- State GDP YoY
- ▲ 2.60%
- F500 in state
- 92
Industry mix (Fortune 500 HQ in NY)
| Industry | F500 HQs | Revenue |
|---|---|---|
| Financial Services | 10 | $950B |
|
||
| Consumer Goods | 9 | $162B |
|
||
| Insurance | 4 | $225B |
|
||
| Telecommunications | 2 | $144B |
|
||
| Pharmaceuticals | 2 | $112B |
|
||
| Media / Entertainment | 2 | $69B |
|
||
Price history
-38.3% since first listed5 events — show timeline
- 2026-05-11 Pending — SLCMLS
- 2026-04-20 Listed $29,000 SLCMLS
- 2023-01-27 Sold (MLS) $16,000 SLCMLS
- 2022-11-02 Listed $34,000 SLCMLS
- 2001-11-01 Sold (Public Records) $47,000 Public Records
Property tax history
+3.4%/yrLatest (2025): $2,365 · -1.1% YoY. Source: county tax records.
Cash-flow waterfall
monthlySold comps — $/sqft
last 12 mo · ≤1 miLoading sold comps…