14183 Granger Pointe Ln · Grangerland, TX
Flood risk 1/10 · Minimal
- FEMA flood zone
- X (unshaded)
- Chance of flooding over 30 yrs
- 0.0%
- Est. flood insurance / yr
- $507 – $1,088
Fire risk 5/10 · Moderate
- Est. fire insurance / yr
- $1,222 – $2,270
Heat risk 8/10 · Major
- Hot days now (above 112°F)
- 7 days/yr
- Hot days in 30 yrs
- 24 days/yr
Wind risk 8/10 · Major
- Chance of severe wind over 30 yrs
- 99.0%
Air-quality risk 3/10 · Minor
- Unhealthy air days now
- 2 days/yr
- Unhealthy air days in 30 yrs
- 3 days/yr
Risk factors via First Street. Map © Google.
Why this score? — see what drove the C- grade
The composite is a weighted blend of 9 inputs, each scored 0–100. Each bar is that input's sub-score; the figure is the points it added to the 100-point composite (weight × sub-score).
- Cash flow +17.6/30.0
- ARV discount +10.8/15.0
- DSCR +5.5/10.0
- Schools +5.1/10.0
- 1% rule +5.0/10.0
- Condition / age +4.0/5.0
- Rent growth +3.3/5.0
- Livability +2.5/5.0
- Appreciation +0.0/10.0
$219,940
🖨 Deal sheet 📄 Offer letter ✓ Due diligence
Listing remarks MLS
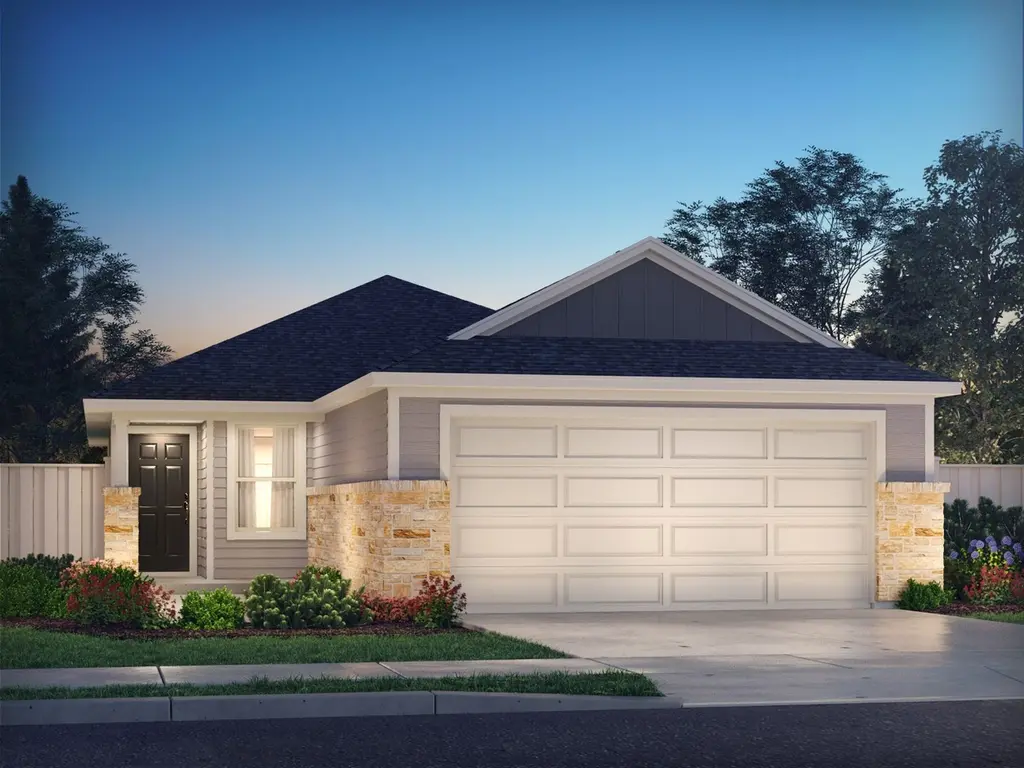
The Cascade's private primary suite boasts dual sinks and a large walk-in closet for ample storage. White cabinets with white quartz countertops and white backsplash, light brown EVP flooring and multi-tone carpet.
Key facts
- Dual sinks
- White cabinets
- White backsplash
Tags
Neighborhood map
What this means for you Summary
Snapshot
- This is a 3-bed/2.0-bath single-family listed at $220k. Condition is rated good.
Deal economics
- At list price, monthly cash flow is $172 ($2k/yr) — positive.
- The deal already cash-flows at list — no discount required.
- To meet the 1% rule (rent ≥ 1% of price), the offer needs to be $220k (0.2% below list).
- Recommended offer: $220k (0.2% below list) — sets the bar for 1% rule.
- Cap rate 7.2% vs local median 5.1% in Grangerland — top-decile yield for the area; either an underpriced asset or a hidden risk that comps aren't pricing in. Stress-test before assuming the spread holds.
Location & tenants
- Location reads: area grade C — affects rentability + tenant quality, not the cash-flow math above.
- Conroe ISD (other): math 57% / reading 57% proficiency, ranked #69 of 826 in TX (top 8%) — acceptable for families but not a draw, mixed tenant base, ~2y average lease.
- Market conditions: Rents rising (+3.3%/yr); 1111 active listings in the ZIP; 2 comparable units currently listed for rent nearby; solid renter incomes; 13,259 units permitted in Montgomery County in 2024 (1,402 in 5+ unit buildings).
- This rent runs 31% of the median local income ($85k/yr) — at the standard rent-burdened threshold; future hikes will face affordability resistance.
Forward outlook
- Local home prices are declining (-3.0%/yr); year-one equity from $2k of loan paydown is wiped out by about $7k of value loss. Plan a longer hold.
- Montgomery County population projected at +65% by 2050 — long-run rental-demand tailwind backs the buy-and-hold thesis.
Negotiation context
- Only 13 days on market — expect competitive offers; lowballing is unlikely to land.
Risks & watch-outs
- Climate carrying-cost: severe wind risk, 99% chance of damaging wind over 30y; moderate wildfire risk; extreme-heat days projected 7→24/yr by 2055 (HVAC capex compounding) — expect insurance premiums to compound above CPI over the hold.
Questions for the listing agent
- What does the HOA fee cover, when was the last increase, and are there any pending special assessments or reserve-fund shortfalls?
- Is there a deadline driving the sale (1031 exchange, divorce, estate, relocation)? That informs how much negotiation room exists.
- What's the average days-on-market for RENTAL listings here right now (not sales)? A rising rental-DOM trend means longer vacancies and softer asking-rent achievability than the comps imply.
- What's the recent tenant-quality profile in this submarket — average credit score on applications, eviction rate, late-payment / NSF rate, and stable-employment percentage? A property-management company in the area should have these aggregated.
- How much new for-sale + rental construction is in the pipeline within 1–3 miles? Heavy new supply typically softens prices + rents 12–24 months out; constrained supply supports both.
Investment metrics
- 1% rule
- 1.00% ✗
- Cap rate
- 7.23%
- Cash-on-cash
- 3.35%
- DSCR
- 1.15
- GRM
- 8.4
CMA / ARV
- ARV (median comp)
- $237,428
- List price
- $219,940
- Delta
- 1.48%
- Verdict
- FAIR
- Comps
- 20 within 1.0 mi
Show comp detail 12 sales within ~0.75 mi
| Address | Dist | Beds/Ba | Sqft | Sold | Price | $/sf | Match |
|---|---|---|---|---|---|---|---|
| 14170 Granger Pointe Ln | 0.04mi | 3/2.0 | 1,426 (-1%) | 0mo | $227,940 | $160 | 96 |
| 14162 Granger Pointe Ln | 0.05mi | 3/2.0 | 1,426 (-1%) | 0mo | $214,590 | $150 | 96 |
| 14312 Grey Pointe Ct | 0.07mi | 3/2.0 | 1,440 (0%) | 2mo | $236,940 | $165 | 95 |
| 14301 Grey Pointe Ct | 0.05mi | 3/2.0 | 1,440 (0%) | 3mo | $229,940 | $160 | 95 |
| 14304 Grey Pointe | 0.07mi | 3/2.0 | 1,426 (-1%) | 2mo | $221,590 | $155 | 93 |
| 14166 Granger Pointe Ln | 0.05mi | 4/2.0 (+1) | 1,557 (+8%) | 2mo | $260,040 | $167 | 78 |
| 14158 Granger Pointe Ln | 0.06mi | 4/2.0 (+1) | 1,557 (+8%) | 2mo | $254,040 | $163 | 77 |
| 16785 Lonely Pines Dr | 0.54mi | 3/2.0 | 1,410 (-2%) | 3mo | $184,900 | $131 | 69 |
| 16916 Rich Pines Dr | 0.42mi | 3/2.0 | 1,575 (+9%) | 2mo | $202,995 | $129 | 63 |
| 14409 Sugar Pines Dr | 0.62mi | 3/2.0 | 1,390 (-4%) | 3mo | $200,000 | $144 | 63 |
| 15427 Woody Haven Dr | 0.64mi | 3/2.0 | 1,516 (+5%) | 1mo | $249,990 | $165 | 61 |
| 17104 Coulter Pine Ct | 0.71mi | 4/2.0 (+1) | 1,583 (+10%) | 2mo | $234,600 | $148 | 44 |
Match score weights: distance 35% · size 25% · config 20% · recency 20%. Top-matched comps best support the ARV.
Projected returns pro-forma
-3.0% appreciation · 3.3% rent growth · sell at horizon
- IRR
- -10.6%
- Equity multiple
- 0.61×
- Total profit
- $-23,956
- Equity at exit
- $32,794
- IRR
- -0.9%
- Equity multiple
- 0.94×
- Total profit
- $-3,763
- Equity at exit
- $19,016
Cash invested: $61,583 (down + closing). Projections, not guarantees.
Landlord ↔ Tenant lean methodology
- Overall (STATE)
- 87 Strongly Landlord-Friendly
- State Texas
- 87 Strongly Landlord-Friendly · R+5
- County
- — inherits STATE
- City
- — inherits STATE
ZIP-level market 77302
- Rents YoY
- 3.3%
- Active inventory
- 1111
- Price-to-rent
- 8.4×
Monthly cashflow live
- Estimated rent
- $2,195 medium interval (Pro) →
- Mortgage (P&I)
- −$1,153
- Tax est. 1.5%
- −$275 /mo · $3,299/yr
- Insurance
- −$92
- HOA
- −$42
- Vacancy / Maint / Mgmt
- −$461
- Net cashflow
- $172
Break-even live
UW: 25.0% down · 7.5% · 30yr · 1.5% tax · 5.0% vac · 8.0% maint · 8.0% mgmt
Financing live
Cash to close
- Down payment
- $54,985
- Closing costs
- $6,598
- Reserves months
- —
- Total cash needed
- —
Loan-product check · same deal, 3 products live
Conventional
25% down · 7.5% · 30yr
- Down + closing
- —
- Monthly P&I
- —
- Monthly cashflow
- —
- DSCR
- —
- Eligible?
- —
Personal DTI + credit; lowest rate.
DSCR
20% down · 8.5% · 30yr
- Down + closing
- —
- Monthly P&I
- —
- Monthly cashflow
- —
- DSCR
- —
- Eligible?
- —
No personal income docs; deal must DSCR.
Hard money
10% down · 12.0% · 12mo
- Down + closing
- —
- Monthly P&I
- —
- Monthly cashflow
- —
- DSCR
- —
- Eligible?
- —
Short-term bridge; refi at stabilization.
Rent comps 2 comps
| Address | Beds | Baths | Sqft | Rent | $/sqft | DOM | Units | Dist |
|---|---|---|---|---|---|---|---|---|
| 16703 Twisted Pine Dr Conroe, TX | 3.0–4.0 | 2.0–3.0 | 1671 | $1,900 | $1.14 | 1d | 13 | 0.74mi |
| 17892 Brown Rd Conroe, TX | 2.0 | 2.0 | 1500 | $1,300 | $0.87 | 19d | 1 | 1.38mi |
HOA detail
- Monthly dues
- $42 · $504/yr
Listing history 18 events
-
2026-06-18days on market $219,940 Active 13 DOM
-
2026-06-17days on market $219,940 Active 12 DOM
-
2026-06-16days on market $219,940 Active 11 DOM
-
2026-06-16price $219,940 Active 10 DOM
-
2026-06-15days on market $240,940 Active 10 DOM
-
2026-06-13days on market $240,940 Active 8 DOM
-
2026-06-09days on market $240,940 Active 4 DOM
-
2026-06-08days on market $240,940 Active 3 DOM
-
2026-06-07remarks 687-char remark
-
2026-06-07days on market $240,940 Active 2 DOM
-
2026-06-04days on market $240,940 Active 43 DOM
-
2026-06-03pricedays on market $240,940 Active 42 DOM
-
2026-06-02days on market $239,940 Active 41 DOM
-
2026-06-01days on market $239,940 Active 40 DOM
-
2026-05-31days on market $239,940 Active 39 DOM
-
2026-05-02price $238,940 214-char remark
Show marketing remark (214 chars)
The Cascade's private primary suite boasts dual sinks and a large walk-in closet for ample storage. White cabinets with white quartz countertops and white backsplash, light brown EVP flooring and multi-tone carpet.
-
2026-04-23price $235,940 214-char remark
Show marketing remark (214 chars)
The Cascade's private primary suite boasts dual sinks and a large walk-in closet for ample storage. White cabinets with white quartz countertops and white backsplash, light brown EVP flooring and multi-tone carpet.
-
2026-04-22$239,940 Active 214-char remark
Show marketing remark (214 chars)
The Cascade's private primary suite boasts dual sinks and a large walk-in closet for ample storage. White cabinets with white quartz countertops and white backsplash, light brown EVP flooring and multi-tone carpet.
ⓘ Source: listings_history table (triggers on properties + properties_extension) + one-shot
backfill from property_details.listing_events for pre-trigger history.
Climate risk First Street
- Flood 1/10 Low FEMA zone X (unshaded) · 0% chance over 30 yrs
- Wildfire 5/10 Major
- Heat 8/10 Severe 7 d/yr ≥112°F today · 24 d/yr by 30 yrs out
- Wind 8/10 Severe 99% chance of damaging wind over 30 yrs
- Air quality 3/10 Moderate 2 unhealthy d/yr today · 3 by 30 yrs out
Nearby sold comps map
Loading sold comps map…
Walkable amenities ~0.75 mi
Loading nearby amenities…
Taxation est. · year 1
- Rental income
- $26,340
- − Mortgage interest
- −$12,320
- − Property taxes
- −$3,299
- − Insurance
- −$1,100
- − Repairs & maintenance
- −$2,107
- − Management
- −$2,107
- − HOA
- −$504
- − Depreciation
- −$6,398
- Taxable loss
- −$1,496
- Est. tax savings @ 24.0%
- +$359
- After-tax cash flow
- $2,424/yr
For passive investors: Depreciation is non-cash, so a rental often shows a tax loss while cash-flowing — sheltering income. Rental losses are passive: they offset passive income freely, and up to $25,000/yr can offset ordinary (W-2) income if you actively participate and your MAGI is under $100k (phasing out to $0 by $150k); unused losses carry forward. On sale, claimed depreciation is recaptured at up to 25%, and gains may owe capital-gains tax (a 1031 exchange can defer both). Figures are a year-1 estimate at your 24.0% rate — not tax advice; consult a CPA.
Condition & rehab AI · 1 photo
The home is in good condition with a cosmetic rehab level, featuring a well-maintained exterior and interior. Painting and landscaping improvements can further enhance its value.
Value-add opportunities
- Both Painting — Fresh paint can enhance curb appeal and interior aesthetics
- Both Landscaping — Well-maintained landscaping can improve curb appeal and attract potential buyers
Renovation cost estimate screening
Value-add ROI direction
- Both Painting — Fresh paint can enhance curb appeal and interior aesthetics ↑
- Both Landscaping — Well-maintained landscaping can improve curb appeal and attract potential buyers ↑
ⓘ Cost ranges are severity-bucket heuristics (US national rule-of-thumb). Get contractor quotes + a written scope before underwriting a rehab budget.
Schools (NCES district)
- District
- Conroe ISD
- NCES district ID
- 4815000
- Math proficiency
- 57% ▼ -6.00%
- Reading proficiency
- 57% ▼ -1.00%
- Median HH income
- $71,541
- Composite
- 50.65/100
- National rank
- #1833
- State rank
- #69 of 826 in TX
Livability — Grangerland
No livability data for this city. (Only ~50 U.S. cities are tracked.)
Census & demographics
- County
- Montgomery County · 663,713 people
- Metro
- Houston-The Woodlands-Sugar Land, TX
- Population (ZIP)
- 21,546
- Household income
- $84,673
- Rent vs Own
- Severe rent burden
- 205.0
Population outlook (Montgomery County) Hauer SSP2
- Today (2025)
- 713,896 people
- By 2030
- 805,263 · +12.8%
- By 2040
- 992,708 · +39.1%
- By 2050
- 1,179,590 · +65.2%
- By 2075
- 1,628,084 · +128.1%
- By 2100
- 1,937,880 · +171.5%
Race, ethnicity, and origin ACS 2023
- Neighborhood character
- Majority White (63%)
- Race & ethnicity
- White 63% Hispanic / Latino 29% Two or more races 19% Black 3% Asian 1%
- Hispanic origin (detail)
- Mexican 26% Puerto Rican 1%
- Common ancestry
- Lithuanian 3% Italian 2% Slovak 2%
- Foreign-born
- 13% · Canada, Vietnam, China
- Languages at home
- 78% English-only · Spanish 20% Russian/Polish/Slavic 1% Other Indo-European 0%
Political lean MEDSL · Montgomery
- 2024 margin
- Solid R (+45.5) · D 26.8% · R 72.3%
- 2008→2024 swing
- +7.2pp toward D · 2008: -52.7pp · 2024: -45.5pp
- All cycles
- 2024: R+45.5 2020: R+43.8 2016: R+51.4 2012: R+60.7 2008: R+52.7
Not yet ingested
- Civics
- —
Market trends
- HPI YoY
- ▼ -187.56%
- Current HPI
- 262.1879
- Rent YoY
- ▲ 3.30%
- Metro
- Houston-The Woodlands-Sugar Land, TX
- State GDP YoY
- ▲ 3.95%
- F500 in state
- 110
Industry mix (Fortune 500 HQ in TX)
| Industry | F500 HQs | Revenue |
|---|---|---|
| Energy | 16 | $1,198B |
|
||
| Technology | 5 | $198B |
|
||
| Engineering / Construction | 4 | $72B |
|
||
| Energy Services | 3 | $60B |
|
||
| Utilities | 3 | $41B |
|
||
| Healthcare | 2 | $330B |
|
||
Price history
-0.4% since first listed3 events — show timeline
- 2026-05-02 Price Changed $238,940 Zillow
- 2026-04-23 Price Changed $235,940 Zillow
- 2026-04-22 Listed $239,940 Zillow
Cash-flow waterfall
monthlySold comps — $/sqft
last 12 mo · ≤1 miLoading sold comps…