 Triplex
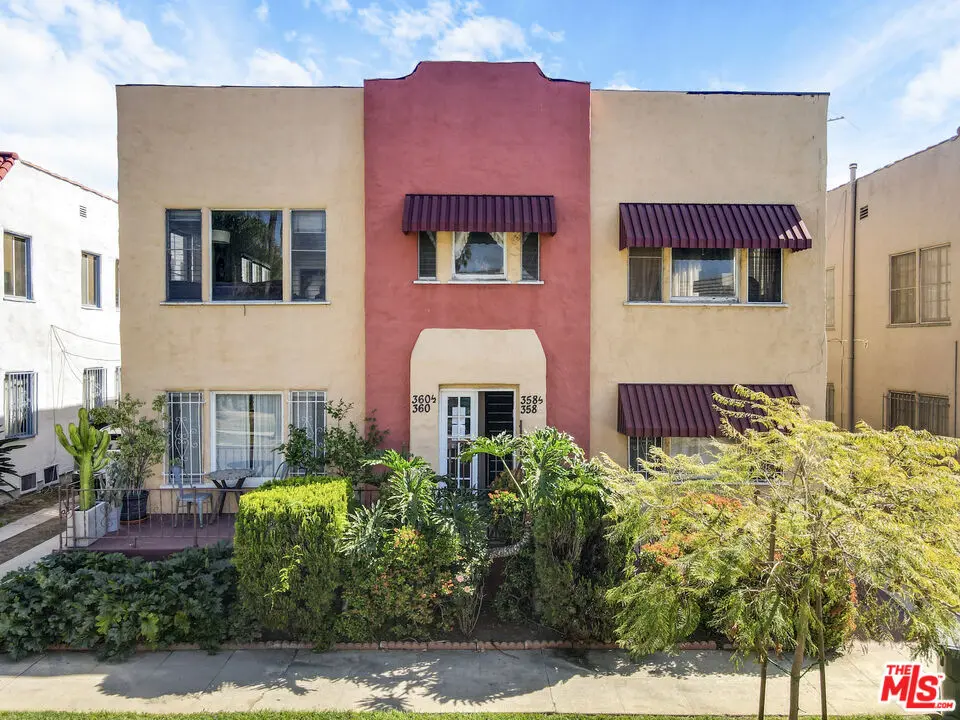
358 N Ogden Dr · Los Angeles, CA
Flood risk 1/10 · Minimal
- FEMA flood zone
- X (unshaded)
- Chance of flooding over 30 yrs
- 0.0%
- Est. flood insurance / yr
- $507 – $1,088
Fire risk 1/10 · Minimal
- Est. fire insurance / yr
- $659 – $1,223
Heat risk 6/10 · Moderate
- Hot days now (above 88°F)
- 7 days/yr
- Hot days in 30 yrs
- 22 days/yr
Wind risk 1/10 · Minimal
- Chance of severe wind over 30 yrs
- —
Air-quality risk 5/10 · Moderate
- Unhealthy air days now
- 7 days/yr
- Unhealthy air days in 30 yrs
- 7 days/yr
Risk factors via First Street. Map © Google.
Why this score? — see what drove the C- grade
The composite is a weighted blend of 9 inputs, each scored 0–100. Each bar is that input's sub-score; the figure is the points it added to the 100-point composite (weight × sub-score).
- Cash flow +14.1/30.0
- ARV discount +13.0/15.0
- Appreciation +6.3/10.0
- DSCR +4.3/10.0
- 1% rule +3.9/10.0
- Condition / age +3.8/5.0
- Schools +3.6/10.0
- Livability +3.4/5.0
- Rent growth +2.2/5.0
$1,750,000
🖨 Deal sheet 📄 Offer letter ✓ Due diligence
Multi-family units
County records classify this as Multi-Family (2-4 Unit). Listing-text estimate: 3 units. confirmed
Listing remarks MLS
358 N Ogden Dr, a charming four-unit apartment building located in the highly desirable Fairfax District of Los Angeles. Built in 1927, the property features (2) two-bedroom + one-bathroom units and (2) three-bedroom + one-bathroom units, totaling 5,486 square feet on a 6,375-square-foot lot. Situated in the heart of the vibrant Fairfax District, 358 N Ogden Dr offers residents the perfect blend of historic character and central city convenience. The neighborhood is celebrated for its tree-lined streets, classic architecture, and culturally rich, energetic atmosphere, all just minutes from some of LosAngeles' most iconic destinations. Residents benefit from easy access to Beverly Hills, Miracle Mile, and Mid-City, along with the shops, restaurants, and cultural institutions that define the Fairfax District. With its walkable location, strong connectivity, and timeless architectural appeal, the property stands out as a highly desirable rental opportunity in one of Los Angeles' most dynamic neighborhoods. 358 N Ogden Dr also presents a compelling value-add investment opportunity, offering both an exceptional location and notable rental upside. The property currently delivers an initial CAP rate of 4.49%, with the potential to reach a 6.65% CAP rate upon unit turnover.
Key facts
- Classic architecture
- Historic character
- Tree lined streets
Tags
Neighborhood map
What this means for you Summary
Snapshot
- This is a 3 × 3-bed/?-bath units multifamily listed at $1.75M. Condition is rated good.
Deal economics
- At list price, monthly cash flow is $253 ($3k/yr) — positive. Per door: $84/mo.
- The deal already cash-flows at list — no discount required.
- To meet the 1% rule (rent ≥ 1% of price), the offer needs to be $1.56M (10.7% below list).
- Recommended offer: $1.56M (10.7% below list) — sets the bar for 1% rule.
- Cap rate 6.5% vs local median 2.1% in Los Angeles — top-decile yield for the area; either an underpriced asset or a hidden risk that comps aren't pricing in. Stress-test before assuming the spread holds.
Location & tenants
- Location reads 68/100 on livability (#273 in CA) — a middle-class / working-renter tenant base. Strengths: amenities A+, commute A+, employment B; Watch: health & safety C-, schools D+, crime F.
- Los Angeles Unified (urban): math 29% / reading 54% proficiency, ranked #223 of 517 in CA (top 43%) — families likely to look elsewhere, expect single-tenant / working-renter base with shorter leases; 67% free/reduced lunch — lower-income household profile, screen leases tightly.
- Market conditions: Rents soft (-1.1%/yr); 95 active listings in the ZIP; solid renter incomes; 19,697 units permitted in Los Angeles County in 2024 (9,426 in 5+ unit buildings).
- At $15,629/mo this rent would consume 171% of the median local household income ($110k/yr) (locally 4924% of renters already pay >50% of income on rent) — very limited rent-growth headroom before tenants either downsize or default.
Forward outlook
- In year one you build about $57k of equity ($12k loan paydown + $45k appreciation (2.5% local appreciation)).
- Los Angeles County population projected at +9% by 2050 — modest demand growth; plan on rents tracking national, not racing it.
- At projected returns (2.5% appreciation + 0.0% rent growth), your $490k cash investment doubles in ~8 years — after that, you're playing with house money.
- By year 3, paydown + projected appreciation supports a ~$142k cash-out refi (75% LTV) — recoverable capital for the next deal without selling this one.
Negotiation context
- It's been on market 89 days — a 6% lower offer ($1.65M) is reasonable based on typical stale-listing flexibility.
- 4 sale attempts since 2y ago with the ask held roughly flat each time — persistent listings suggest the price (not the market) is what's stuck; bring a comps-based counter.
Risks & watch-outs
- Watch-outs: built in 1927 — expect roof / HVAC / electrical / plumbing capex.
- Climate carrying-cost: extreme-heat days projected 7→22/yr by 2055 (HVAC capex compounding) — expect insurance premiums to compound above CPI over the hold.
Questions for the listing agent
- It's been on market 89 days. Have you received any prior offers? Is the seller open to a 11% concession, seller financing, or rate buy-down credit?
- Can we see the unit-by-unit rent roll, current vacancy, and any below-market leases? What's the average tenancy length?
- What capital expenditures (roof, boiler, parking lot, exteriors) have been made in the last 5 years, and what's planned in the next 2?
- Built in 1927 — when were the roof, HVAC, electrical panel, plumbing, and water heater last replaced?
- Why hasn't it sold? Are there any deal-killer items the seller is aware of (foundation, flood, title, zoning, code violations)?
- Is there a deadline driving the sale (1031 exchange, divorce, estate, relocation)? That informs how much negotiation room exists.
- Schools are D-rated, which usually means shorter tenancies and higher turnover. Who's the typical renter profile here, and what's been the actual vacancy rate?
- Crime grade is F in this area — have there been break-ins, vandalism, or insurance claims at this property in the last 3 years? What carrier currently insures it and at what premium?
- What's the average days-on-market for RENTAL listings here right now (not sales)? A rising rental-DOM trend means longer vacancies and softer asking-rent achievability than the comps imply.
- What's the recent tenant-quality profile in this submarket — average credit score on applications, eviction rate, late-payment / NSF rate, and stable-employment percentage? A property-management company in the area should have these aggregated.
- How much new apartment / multifamily construction is in the pipeline within 1–3 miles? Heavy new supply (>2% of stock underway) typically softens rents 12–24 months out; light construction supports rent growth.
Investment metrics
- 1% rule
- 0.89% ✗
- Cap rate
- 6.47%
- Cash-on-cash
- 0.62%
- DSCR
- 1.03
- GRM
- 9.3
CMA / ARV
- ARV (median comp)
- $1,995,542
- List price
- $1,750,000
- Delta
- -12.30%
- Verdict
- UNDERPRICED
- Comps
- 20 within 1.0 mi
Show comp detail 8 sales within ~0.75 mi
| Address | Dist | Beds/Ba | Sqft | Sold | Price | $/sf | Match |
|---|---|---|---|---|---|---|---|
| 418 N Orange Grove Ave | 0.08mi | 8/4.0 (-1) | 5,438 (-1%) | 9mo | $1,795,000 | $330 | 82 |
| 458 N Genesee Ave | 0.14mi | 8/4.0 (-1) | 5,347 (-2%) | 6mo | $2,000,000 | $374 | 79 |
| 346 N Spaulding Ave | 0.12mi | 8/4.0 (-1) | 5,662 (+3%) | 6mo | $1,702,000 | $301 | 78 |
| 357 N Curson Ave | 0.20mi | 8/4.0 (-1) | 5,296 (-4%) | 6mo | $2,000,000 | $378 | 75 |
| 356 N Sierra Bonita | 0.30mi | 8/4.0 (-1) | 5,320 (-3%) | 2mo | $1,450,000 | $273 | 74 |
| 500 N Alta Vista Blvd | 0.71mi | 8/4.0 (-1) | 5,202 (-5%) | 8mo | $2,188,000 | $421 | 46 |
| 329 N Gardner St | 0.33mi | 8/6.0 (-1) | 5,140 (-6%) | 17mo | $1,926,000 | $375 | 46 |
| 337 N Gardner St | 0.32mi | 8/4.0 (-1) | 4,783 (-13%) | 18mo | $1,983,000 | $415 | 43 |
Match score weights: distance 35% · size 25% · config 20% · recency 20%. Top-matched comps best support the ARV.
Projected returns pro-forma
2.55% appreciation · 0.0% rent growth · sell at horizon
- IRR
- 5.2%
- Equity multiple
- 1.29×
- Total profit
- $140,359
- Equity at exit
- $743,254
- IRR
- 7.1%
- Equity multiple
- 1.97×
- Total profit
- $475,758
- Equity at exit
- $1,112,618
Cash invested: $490,000 (down + closing). Projections, not guarantees.
Landlord ↔ Tenant lean methodology
- Overall (CITY)
- 0 Strongly Tenant-Friendly
- State California
- 18 Strongly Tenant-Friendly · D+13
- County
- — inherits STATE
- City Los Angeles
- 0 Strongly Tenant-Friendly · D+22
ZIP-level market 90036
- Home prices YoY
- 0.6%
- Rents YoY
- -1.1%
- Active inventory
- 95
- Price-to-rent
- 28.0×
Monthly cashflow live
- Estimated rent
- $15,629 high interval (Pro) →
- Mortgage (P&I)
- −$9,177
- Tax est. 1.5%
- −$2,188 /mo · $26,250/yr
- Insurance
- −$729
- HOA
- −$0
- Vacancy / Maint / Mgmt
- −$3,282
- Net cashflow
- $253
Break-even live
3-unit breakdown (identical units grouped — click to expand)
| Units | Beds | Baths | Est. rent |
|---|---|---|---|
| 3× units | 3 | — | $15,630 |
| #1 | 3 | — | $5,210 |
| #2 | 3 | — | $5,210 |
| #3 | 3 | — | $5,210 |
| Total (3 units) | $15,629 | ||
UW: 25.0% down · 7.5% · 30yr · 1.5% tax · 5.0% vac · 8.0% maint · 8.0% mgmt
Financing live
Cash to close
- Down payment
- $437,500
- Closing costs
- $52,500
- Reserves months
- —
- Total cash needed
- —
Loan-product check · same deal, 3 products live
Conventional
25% down · 7.5% · 30yr
- Down + closing
- —
- Monthly P&I
- —
- Monthly cashflow
- —
- DSCR
- —
- Eligible?
- —
Personal DTI + credit; lowest rate.
DSCR
20% down · 8.5% · 30yr
- Down + closing
- —
- Monthly P&I
- —
- Monthly cashflow
- —
- DSCR
- —
- Eligible?
- —
No personal income docs; deal must DSCR.
Hard money
10% down · 12.0% · 12mo
- Down + closing
- —
- Monthly P&I
- —
- Monthly cashflow
- —
- DSCR
- —
- Eligible?
- —
Short-term bridge; refi at stabilization.
Listing history 18 events
-
2026-06-18days on market $1,750,000 Active 89 DOM
-
2026-06-17days on market $1,750,000 Active 88 DOM
-
2026-06-16days on market $1,750,000 Active 87 DOM
-
2026-06-15days on market $1,750,000 Active 86 DOM
-
2026-06-13days on market $1,750,000 Active 84 DOM
-
2026-06-09days on market $1,750,000 Active 80 DOM
-
2026-06-08days on market $1,750,000 Active 79 DOM
-
2026-06-07days on market $1,750,000 Active 78 DOM
-
2026-06-04days on market $1,750,000 Active 75 DOM
-
2026-06-03days on market $1,750,000 Active 74 DOM
-
2026-06-02days on market $1,750,000 Active 73 DOM
-
2026-06-01days on market $1,750,000 Active 72 DOM
-
2026-05-31days on market $1,750,000 Active 71 DOM
-
2026-03-21$1,750,000 Active 1286-char remark
Show marketing remark (1286 chars)
358 N Ogden Dr, a charming four-unit apartment building located in the highly desirable Fairfax District of Los Angeles. Built in 1927, the property features (2) two-bedroom + one-bathroom units and (2) three-bedroom + one-bathroom units, totaling 5,486 square feet on a 6,375-square-foot lot. Situated in the heart of the vibrant Fairfax District, 358 N Ogden Dr offers residents the perfect blend of historic character and central city convenience. The neighborhood is celebrated for its tree-lined streets, classic architecture, and culturally rich, energetic atmosphere, all just minutes from some of LosAngeles' most iconic destinations. Residents benefit from easy access to Beverly Hills, Miracle Mile, and Mid-City, along with the shops, restaurants, and cultural institutions that define the Fairfax District. With its walkable location, strong connectivity, and timeless architectural appeal, the property stands out as a highly desirable rental opportunity in one of Los Angeles' most dynamic neighborhoods. 358 N Ogden Dr also presents a compelling value-add investment opportunity, offering both an exceptional location and notable rental upside. The property currently delivers an initial CAP rate of 4.49%, with the potential to reach a 6.65% CAP rate upon unit turnover.
-
2025-10-24Active
-
2025-07-10Active
-
2025-03-18price
-
2024-05-02Active
ⓘ Source: listings_history table (triggers on properties + properties_extension) + one-shot
backfill from property_details.listing_events for pre-trigger history.
Climate risk First Street
- Flood 1/10 Low FEMA zone X (unshaded) · 0% chance over 30 yrs
- Wildfire 1/10 Low
- Heat 6/10 Major 7 d/yr ≥88°F today · 22 d/yr by 30 yrs out
- Wind 1/10 Low
- Air quality 5/10 Major 7 unhealthy d/yr today · 7 by 30 yrs out
Nearby sold comps map
Loading sold comps map…
Walkable amenities ~0.75 mi
Loading nearby amenities…
Taxation est. · year 1
- Rental income
- $187,548
- − Mortgage interest
- −$98,027
- − Property taxes
- −$26,250
- − Insurance
- −$8,750
- − Repairs & maintenance
- −$15,004
- − Management
- −$15,004
- − Depreciation
- −$50,909
- Taxable loss
- −$26,396
- Est. tax savings @ 24.0%
- +$6,335
- After-tax cash flow
- $9,372/yr
For passive investors: Depreciation is non-cash, so a rental often shows a tax loss while cash-flowing — sheltering income. Rental losses are passive: they offset passive income freely, and up to $25,000/yr can offset ordinary (W-2) income if you actively participate and your MAGI is under $100k (phasing out to $0 by $150k); unused losses carry forward. On sale, claimed depreciation is recaptured at up to 25%, and gains may owe capital-gains tax (a 1031 exchange can defer both). Figures are a year-1 estimate at your 24.0% rate — not tax advice; consult a CPA.
Condition & rehab AI · 12 photos
This four-unit apartment building in the Fairfax District is in good condition with a good exterior and well-maintained landscaping. It is ready for a fresh coat of paint to enhance its curb appeal and increase its value.
Value-add opportunities
- Both Paint exterior walls — Painting the exterior walls can enhance the curb appeal and increase the property's value.
- Both Inspect and clean gutters — Maintaining the gutters can prevent water damage and improve the property's overall appearance.
Renovation cost estimate screening
Value-add ROI direction
- Both Paint exterior walls — Painting the exterior walls can enhance the curb appeal and increase the property's value. ↑
- Both Inspect and clean gutters — Maintaining the gutters can prevent water damage and improve the property's overall appearance. ↑
ⓘ Cost ranges are severity-bucket heuristics (US national rule-of-thumb). Get contractor quotes + a written scope before underwriting a rehab budget.
Schools (NCES district)
- District
- Los Angeles Unified
- NCES district ID
- 0622710
- Math proficiency
- 29% ▼ -4.00%
- Reading proficiency
- 54% ▲ 10.00%
- Median HH income
- $50,403
- Composite
- 35.67/100
- National rank
- #4875
- State rank
- #223 of 517 in CA
Livability — Los Angeles
- Score
- 68/100
- State rank
- #273
- US rank
- #9237
Category grades
Schools grade is shown separately in the Schools card above.
Census & demographics
- Census place
- Los Angeles, CA
- County
- Los Angeles County · 9,444,647 people
- City population
- 3,838,149
- Metro
- Los Angeles-Long Beach-Anaheim, CA
- Population (ZIP)
- 39,278
- Household income
- $109,785
- Rent vs Own
- Severe rent burden
- 4924.0
Population outlook (Los Angeles County) Hauer SSP2
- Today (2025)
- 10,940,515 people
- By 2030
- 11,256,481 · +2.9%
- By 2040
- 11,729,929 · +7.2%
- By 2050
- 11,948,407 · +9.2%
- By 2075
- 11,818,114 · +8.0%
- By 2100
- 10,842,928 · -0.9%
Race, ethnicity, and origin ACS 2023
- Neighborhood character
- Diverse neighborhood (Simpson 0.65)
- Race & ethnicity
- White 54% Asian 19% Hispanic / Latino 13% Two or more races 11% Black 7%
- Hispanic origin (detail)
- Mexican 6%
- Common ancestry
- Romanian 4% Scotch-Irish 3% Lithuanian 2%
- Foreign-born
- 26% · Canada, South Korea, China
- Languages at home
- 66% English-only · Spanish 9% Korean 6% Other Indo-European 5%
Political lean MEDSL · Los Angeles
- 2024 margin
- Solid D (+32.9) · D 64.8% · R 31.9% · Other 3.3%
- 2008→2024 swing
- -7.4pp toward R · 2008: 40.4pp · 2024: 32.9pp
- All cycles
- 2024: D+32.9 2020: D+44.2 2016: D+48.0 2012: D+40.0 2008: D+40.4
Not yet ingested
- Civics
- —
Market trends
- HPI YoY
- ▲ 2.55%
- Current HPI
- 439.6946
- Rent YoY
- ▼ -1.13%
- Metro
- Los Angeles-Long Beach-Anaheim, CA
- State GDP YoY
- ▲ 3.21%
- F500 in state
- 116
Industry mix (Fortune 500 HQ in CA)
| Industry | F500 HQs | Revenue |
|---|---|---|
| Technology | 27 | $1,492B |
|
||
| Financial Services | 3 | $174B |
|
||
| Retail | 3 | $44B |
|
||
| Insurance | 3 | $26B |
|
||
| Media / Entertainment | 2 | $115B |
|
||
| Pharmaceuticals / Biotech | 2 | $62B |
|
||
Price history
5 events — show timeline
- 2026-03-21 Listed $1,750,000 TheMLS
- 2025-10-24 Listed — TheMLS
- 2025-07-10 Listed — TheMLS
- 2025-03-18 Price Changed — TheMLS
- 2024-05-02 Listed — TheMLS
Cash-flow waterfall
monthlySold comps — $/sqft
last 12 mo · ≤1 miLoading sold comps…