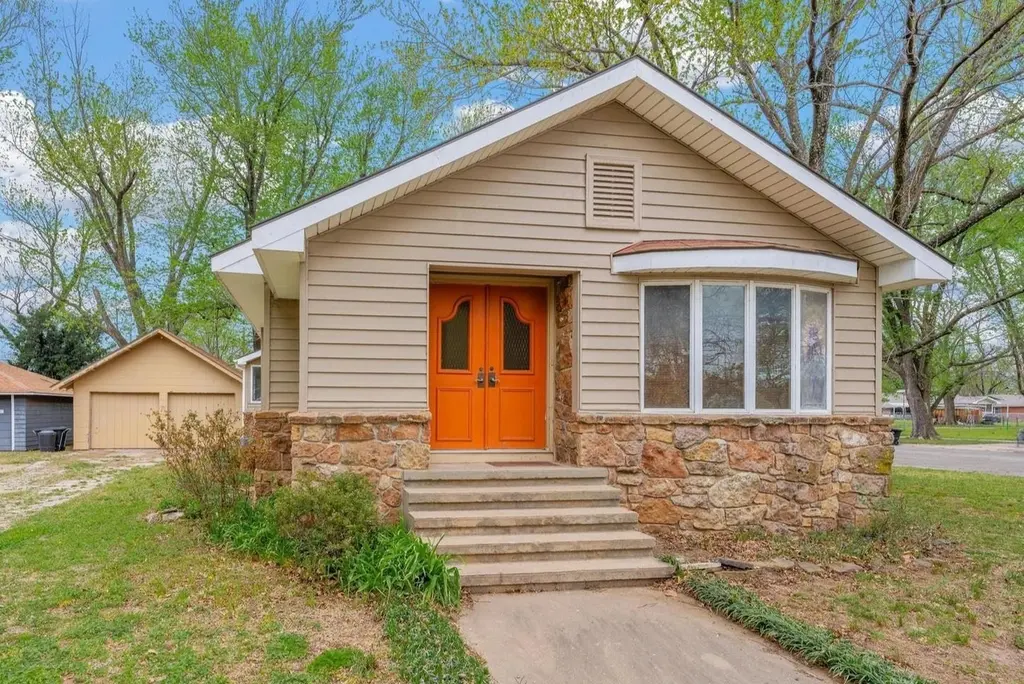
319 N Michigan St · Oxford, KS
Flood risk 1/10 · Minimal
- FEMA flood zone
- X (unshaded)
- Chance of flooding over 30 yrs
- 0.0%
- Est. flood insurance / yr
- $473 – $860
Fire risk 4/10 · Minor
- Est. fire insurance / yr
- $1,154 – $2,142
Heat risk 5/10 · Moderate
- Hot days now (above 107°F)
- 7 days/yr
- Hot days in 30 yrs
- 17 days/yr
Wind risk 2/10 · Minimal
- Chance of severe wind over 30 yrs
- 0.0%
Air-quality risk 2/10 · Minimal
- Unhealthy air days now
- 1 days/yr
- Unhealthy air days in 30 yrs
- 1 days/yr
Risk factors via First Street. Map © Google.
Why this score? — see what drove the C- grade
The composite is a weighted blend of 9 inputs, each scored 0–100. Each bar is that input's sub-score; the figure is the points it added to the 100-point composite (weight × sub-score).
- Cash flow +16.0/30.0
- ARV discount +7.5/15.0
- Appreciation +6.6/10.0
- DSCR +4.9/10.0
- 1% rule +4.7/10.0
- Livability +3.6/5.0
- Rent growth +2.5/5.0
- Schools +2.5/10.0
- Condition / age +2.5/5.0
$115,000
🖨 Deal sheet 📄 Offer letter ✓ Due diligence
Key facts
- Double doors
- Mature landscaping
- Cozy window seat
Tags
Property features AI
Exterior
- Parking: 2-car garage
- Utilities: Public sewer available; Natural gas available; Public utilities
- Home design: Single-family onsite built home; One story
- Construction: Composition roof; Partial foundation (no egress window)
- Exterior features: Patio; Storm windows
Interior
- Kitchen: Dishwasher; Range; Refrigerator
- Bathrooms: 2 full bathrooms
- Heating & cooling: Forced air heating; Central electric air conditioning
- Interior features: Decorative fireplace; Partially finished basement
- Laundry & utility: Washer; Dryer; Laundry in basement with utility sink
Neighborhood map
What this means for you Summary
Snapshot
- This is a 3-bed/2.0-bath single-family listed at $115k.
Deal economics
- At list price, monthly cash flow is $56 ($677/yr) — positive.
- The deal already cash-flows at list — no discount required.
- To meet the 1% rule (rent ≥ 1% of price), the offer needs to be $112k (2.6% below list).
- Recommended offer: $112k (3.0% below list) — sets the bar for market timing.
Location & tenants
- Location reads 71/100 on livability (#128 in KS) — a middle-class / working-renter tenant base. Strengths: cost of living A+, health & safety A+, crime A-; Watch: amenities F, commute F.
- Oxford (rural): math 30% / reading 28% proficiency, ranked #102 of 169 in KS (top 60%) — low school quality limits family demand, transient renter base, plan for 1-2y turnover.
- Zoned schools: Oxford Elem (math 37% / reading 32%, grade F, #388 of 684 statewide, top 61%, 207 students, 44% FRL); Oxford Jr/Sr High (math 22% / reading 22%, grade F, #165 of 327 statewide, top 55%, 212 students, 39% FRL).
- Market conditions: 5 active listings in the ZIP; 14 units permitted in Sumner County in 2024 (0 in 5+ unit buildings).
Forward outlook
- In year one you build about $5k of equity ($795 loan paydown + $4k appreciation (3.3% local appreciation)).
- Sumner County population projected at -13% by 2050 — secular population decline; favor cash flow + early exit over multi-decade hold.
- At projected returns (3.3% appreciation + 3.0% rent growth), your $32k cash investment doubles in ~6 years — after that, you're playing with house money.
- By year 8, paydown + projected appreciation supports a ~$34k cash-out refi (75% LTV) — recoverable capital for the next deal without selling this one.
Negotiation context
- It's been on market 48 days — a 3% lower offer ($112k) is reasonable based on typical stale-listing flexibility.
- 2 sale attempts; this cycle's ask has dropped $15k (11%) from the opening price — seller is motivated, your offer sets the floor, not the list.
Risks & watch-outs
- Watch-outs: built in 1927 — expect roof / HVAC / electrical / plumbing capex.
- Climate carrying-cost: extreme-heat days projected 7→17/yr by 2055 (HVAC capex compounding) — expect insurance premiums to compound above CPI over the hold.
Questions for the listing agent
- It's been on market 48 days. Have you received any prior offers? Is the seller open to a 3% concession, seller financing, or rate buy-down credit?
- Built in 1927 — when were the roof, HVAC, electrical panel, plumbing, and water heater last replaced?
- Is there a deadline driving the sale (1031 exchange, divorce, estate, relocation)? That informs how much negotiation room exists.
- Schools are D-rated, which usually means shorter tenancies and higher turnover. Who's the typical renter profile here, and what's been the actual vacancy rate?
- What's the average days-on-market for RENTAL listings here right now (not sales)? A rising rental-DOM trend means longer vacancies and softer asking-rent achievability than the comps imply.
- What's the recent tenant-quality profile in this submarket — average credit score on applications, eviction rate, late-payment / NSF rate, and stable-employment percentage? A property-management company in the area should have these aggregated.
- How much new for-sale + rental construction is in the pipeline within 1–3 miles? Heavy new supply typically softens prices + rents 12–24 months out; constrained supply supports both.
Investment metrics
- 1% rule
- 0.97% ✗
- Cap rate
- 6.88%
- Cash-on-cash
- 2.10%
- DSCR
- 1.09
- GRM
- 8.6
CMA / ARV
No comps found within radius.
Projected returns pro-forma
3.26% appreciation · 3.0% rent growth · sell at horizon
- IRR
- 10.2%
- Equity multiple
- 1.59×
- Total profit
- $19,087
- Equity at exit
- $53,414
- IRR
- 12.4%
- Equity multiple
- 2.89×
- Total profit
- $61,016
- Equity at exit
- $83,668
Cash invested: $32,200 (down + closing). Projections, not guarantees.
Landlord ↔ Tenant lean methodology
- Overall (STATE)
- 83 Strongly Landlord-Friendly
- State Kansas
- 83 Strongly Landlord-Friendly · R+10
- County
- — inherits STATE
- City
- — inherits STATE
ZIP-level market 67119
- Home prices YoY
- 1.7%
- Active inventory
- 5
- Price-to-rent
- 8.6×
Monthly cashflow live
- Estimated rent
- $1,120 medium interval (Pro) →
- Mortgage (P&I)
- −$603
- Tax from tax record
- −$177 /mo · $2,127/yr
- Insurance
- −$48
- HOA
- −$0
- Vacancy / Maint / Mgmt
- −$235
- Net cashflow
- $56
Break-even live
UW: 25.0% down · 7.5% · 30yr · 1.5% tax · 5.0% vac · 8.0% maint · 8.0% mgmt
Financing live
Cash to close
- Down payment
- $28,750
- Closing costs
- $3,450
- Reserves months
- —
- Total cash needed
- —
Loan-product check · same deal, 3 products live
Conventional
25% down · 7.5% · 30yr
- Down + closing
- —
- Monthly P&I
- —
- Monthly cashflow
- —
- DSCR
- —
- Eligible?
- —
Personal DTI + credit; lowest rate.
DSCR
20% down · 8.5% · 30yr
- Down + closing
- —
- Monthly P&I
- —
- Monthly cashflow
- —
- DSCR
- —
- Eligible?
- —
No personal income docs; deal must DSCR.
Hard money
10% down · 12.0% · 12mo
- Down + closing
- —
- Monthly P&I
- —
- Monthly cashflow
- —
- DSCR
- —
- Eligible?
- —
Short-term bridge; refi at stabilization.
Listing history 13 events
-
2026-06-04pricestatusdays on market $115,000 Pending 48 DOM
-
2026-06-02days on market $115,900 Active 47 DOM
-
2026-06-01days on market $115,900 Active 46 DOM
-
2026-05-31days on market $115,900 Active 45 DOM
-
2026-05-31days on market $115,900 Active 44 DOM
-
2026-04-16$129,900 Active
-
2026-04-08price $139,900
-
2026-04-07historical
-
2026-01-29price $141,500
-
2026-01-16price $142,500
-
2025-12-24price $144,000
-
2025-12-19price $144,500
-
2025-09-10$145,000 Active
ⓘ Source: listings_history table (triggers on properties + properties_extension) + one-shot
backfill from property_details.listing_events for pre-trigger history.
Tax reassessment forecast KS · Resets to sale price
- Current annual tax
- $2,127 · $177/mo
- Projected year-2 tax
- $2,127 · $177/mo
- Expected delta
- $0/yr ($0/mo · 0.0%)
ⓘ Screening estimate from a state-policy table — verify with the county assessor before closing.
Climate risk First Street
- Flood 1/10 Low FEMA zone X (unshaded) · 0% chance over 30 yrs
- Wildfire 4/10 Moderate
- Heat 5/10 Major 7 d/yr ≥107°F today · 17 d/yr by 30 yrs out
- Wind 2/10 Low 0% chance of damaging wind over 30 yrs
- Air quality 2/10 Low 1 unhealthy d/yr today · 1 by 30 yrs out
Nearby sold comps map
Loading sold comps map…
Walkable amenities ~0.75 mi
Loading nearby amenities…
Taxation est. · year 1
- Rental income
- $13,437
- − Mortgage interest
- −$6,442
- − Property taxes
- −$2,127
- − Insurance
- −$575
- − Repairs & maintenance
- −$1,075
- − Management
- −$1,075
- − Depreciation
- −$3,345
- Taxable loss
- −$1,201
- Est. tax savings @ 24.0%
- +$288
- After-tax cash flow
- $965/yr
For passive investors: Depreciation is non-cash, so a rental often shows a tax loss while cash-flowing — sheltering income. Rental losses are passive: they offset passive income freely, and up to $25,000/yr can offset ordinary (W-2) income if you actively participate and your MAGI is under $100k (phasing out to $0 by $150k); unused losses carry forward. On sale, claimed depreciation is recaptured at up to 25%, and gains may owe capital-gains tax (a 1031 exchange can defer both). Figures are a year-1 estimate at your 24.0% rate — not tax advice; consult a CPA.
Schools (NCES district)
- District
- Oxford
- NCES district ID
- 2010440
- Math proficiency
- 30% ▲ 5.00%
- Reading proficiency
- 28% ▲ 3.00%
- Median HH income
- $50,686
- Composite
- 25.46/100
- National rank
- #7448
- State rank
- #102 of 169 in KS
Livability — Oxford
- Score
- 71/100
- State rank
- #128
- US rank
- #6580
Category grades
Schools grade is shown separately in the Schools card above.
Census & demographics
- Census place
- Oxford, KS
- Population (ZIP)
- 1,238
Population outlook (Sumner County) Hauer SSP2
- Today (2025)
- 22,787 people
- By 2030
- 22,292 · -2.2%
- By 2040
- 21,113 · -7.3%
- By 2050
- 19,916 · -12.6%
- By 2075
- 18,286 · -19.8%
- By 2100
- 16,450 · -27.8%
Race, ethnicity, and origin ACS 2023
- Neighborhood character
- Predominantly White (87%)
- Race & ethnicity
- White 87% Two or more races 6% Native American 3% Hispanic / Latino 2%
- Common ancestry
- Slovak 7% Italian 2% Portuguese 2%
- Foreign-born
- 0%
- Languages at home
- 98% English-only · Spanish 2%
Political lean MEDSL · Sumner
- 2024 margin
- Solid R (+50.1) · D 23.9% · R 74.0% · Other 2.0%
- 2008→2024 swing
- -17.4pp toward R · 2008: -32.7pp · 2024: -50.1pp
- All cycles
- 2024: R+50.1 2020: R+50.5 2016: R+50.6 2012: R+39.4 2008: R+32.7
Not yet ingested
- Civics
- —
Market trends
- HPI YoY
- ▲ 3.26%
- Current HPI
- 190.4343
- Rent YoY
- —
- Metro
- —
- State GDP YoY
- —
- F500 in state
- 0
Price history
-10.4% since first listed8 events — show timeline
- 2026-04-16 Listed $129,900 SCKMLS as Distributed by MLS Grid
- 2026-04-08 Price Changed $139,900 SCKMLS as Distributed by MLS Grid
- 2026-04-07 Listing Removed — SCKMLS as Distributed by MLS Grid
- 2026-01-29 Price Changed $141,500 SCKMLS as Distributed by MLS Grid
- 2026-01-16 Price Changed $142,500 SCKMLS as Distributed by MLS Grid
- 2025-12-24 Price Changed $144,000 SCKMLS as Distributed by MLS Grid
- 2025-12-19 Price Changed $144,500 SCKMLS as Distributed by MLS Grid
- 2025-09-10 Listed $145,000 SCKMLS as Distributed by MLS Grid
Property tax history
+5.7%/yrLatest (2025): $2,127 · +2.3% YoY. Source: county tax records.
Cash-flow waterfall
monthlySold comps — $/sqft
last 12 mo · ≤1 miLoading sold comps…