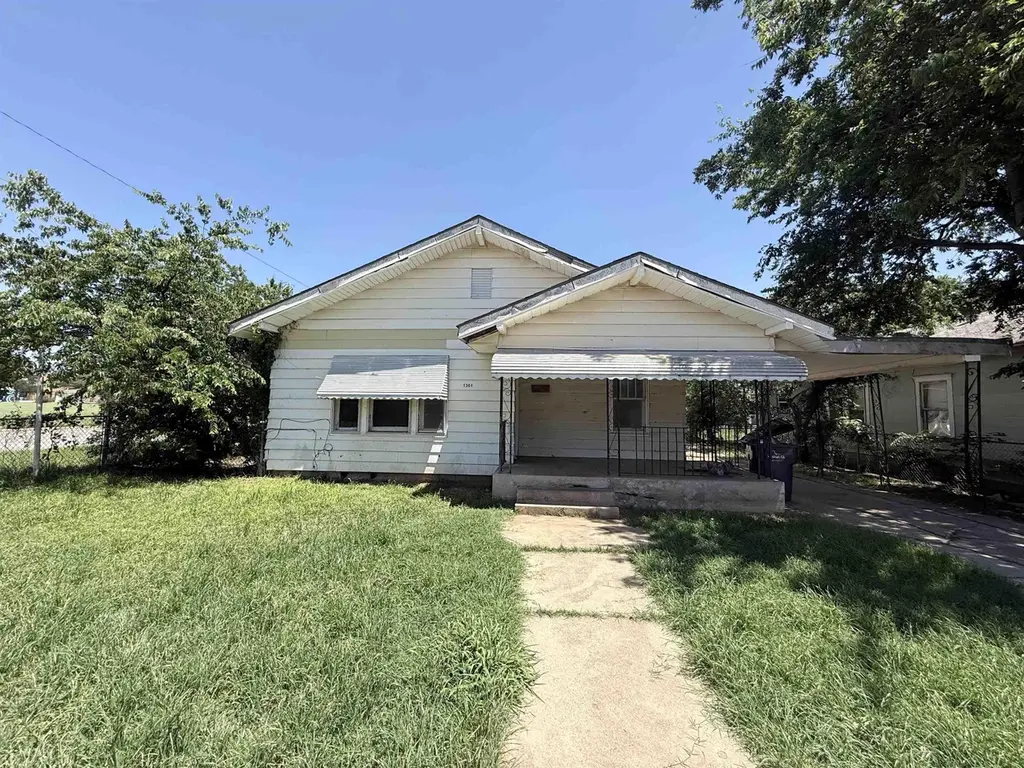
1301 Giddings St · Wichita Falls, TX
Flood risk 1/10 · Minimal
- FEMA flood zone
- X (unshaded)
- Chance of flooding over 30 yrs
- 0.0%
- Est. flood insurance / yr
- $507 – $1,088
Fire risk 1/10 · Minimal
- Est. fire insurance / yr
- $1,222 – $2,270
Heat risk 7/10 · Major
- Hot days now (above 109°F)
- 7 days/yr
- Hot days in 30 yrs
- 20 days/yr
Wind risk 4/10 · Minor
- Chance of severe wind over 30 yrs
- 8.0%
Air-quality risk 1/10 · Minimal
- Unhealthy air days now
- 0 days/yr
- Unhealthy air days in 30 yrs
- 0 days/yr
Risk factors via First Street. Map © Google.
Why this score? — see what drove the C- grade
The composite is a weighted blend of 9 inputs, each scored 0–100. Each bar is that input's sub-score; the figure is the points it added to the 100-point composite (weight × sub-score).
- Cash flow +24.8/30.0
- DSCR +8.0/10.0
- 1% rule +6.2/10.0
- Rent growth +3.8/5.0
- Livability +3.5/5.0
- Schools +2.7/10.0
- Condition / age +2.5/5.0
- ARV discount +0.0/15.0
- Appreciation +0.0/10.0
$99,990
🖨 Deal sheet 📄 Offer letter ✓ Due diligence
Listing remarks MLS
Good investment opportunity!!! Single family house has three beds, one bath. Second structure has two apartments and a garage below. Great income opportunity! Needs TLC! Bring me an offer!
Key facts
- Fenced yard
- Covered carport
- New central hvac
Tags
Property features AI
Finance
- HOA & community: Located in the Floral Heights West subdivision
Exterior
- Home design: Residential income property (Triplex)
- Construction: Built on a 0.18-acre lot
- Exterior features: Composition roof
Interior
- Interior features: Pets allowed
Neighborhood map
What this means for you Summary
Snapshot
- This is a 3-bed/1.0-bath single-family listed at $100k.
Deal economics
- At list price, monthly cash flow is $212 ($3k/yr) — positive.
- The deal already cash-flows at list — no discount required.
- Meets the 1% rule at list price ($1k rent vs $100k).
- Recommended offer: $97k (3.0% below list) — sets the bar for market timing.
- Cap rate 8.8% vs local median 4.7% in Wichita Falls — top-decile yield for the area; either an underpriced asset or a hidden risk that comps aren't pricing in. Stress-test before assuming the spread holds.
Location & tenants
- Location reads 69/100 on livability (#437 in TX) — a middle-class / working-renter tenant base. Strengths: cost of living A+, housing A+; Watch: health & safety C-, employment D+, schools D.
- Wichita Falls ISD (urban): math 31% / reading 33% proficiency, ranked #585 of 826 in TX (top 71%) — families likely to look elsewhere, expect single-tenant / working-renter base with shorter leases.
- Market conditions: Rents rising fast (+5.3%/yr); 133 active listings in the ZIP; 16 comparable units currently listed for rent nearby; rentals lingering (median 44d on market — plan ~5-8 weeks vacancy on turnover, expect pricing pressure); 100% of comp listings sitting > 30 days — soft ceiling on asking rent; lower-income renter base — watch delinquency; 231 units permitted in Wichita County in 2024 (10 in 5+ unit buildings).
- This rent runs 32% of the median local income ($42k/yr) — at the standard rent-burdened threshold; future hikes will face affordability resistance.
Forward outlook
- Local home prices are declining (-3.0%/yr); year-one equity from $692 of loan paydown is wiped out by about $3k of value loss. Plan a longer hold.
- Wichita County population projected to shrink 7% by 2050 — rents likely to lag national; underwrite the cash flow, not the appreciation.
- At projected returns (-3.0% appreciation + 5.3% rent growth), your $28k cash investment doubles in ~9 years — after that, you're playing with house money.
Negotiation context
- It's been on market 38 days — a 3% lower offer ($97k) is reasonable based on typical stale-listing flexibility.
- 3 sale attempts since 10y ago with the ask held roughly flat each time — persistent listings suggest the price (not the market) is what's stuck; bring a comps-based counter.
Risks & watch-outs
- Watch-outs: built in 1925 — expect roof / HVAC / electrical / plumbing capex.
- Climate carrying-cost: extreme-heat days projected 7→20/yr by 2055 (HVAC capex compounding) — expect insurance premiums to compound above CPI over the hold.
Questions for the listing agent
- It's been on market 38 days. Have you received any prior offers? Is the seller open to a 3% concession, seller financing, or rate buy-down credit?
- Built in 1925 — when were the roof, HVAC, electrical panel, plumbing, and water heater last replaced?
- Is there a deadline driving the sale (1031 exchange, divorce, estate, relocation)? That informs how much negotiation room exists.
- Schools are D-rated, which usually means shorter tenancies and higher turnover. Who's the typical renter profile here, and what's been the actual vacancy rate?
- Crime grade is D in this area — have there been break-ins, vandalism, or insurance claims at this property in the last 3 years? What carrier currently insures it and at what premium?
- What's the average days-on-market for RENTAL listings here right now (not sales)? A rising rental-DOM trend means longer vacancies and softer asking-rent achievability than the comps imply.
- What's the recent tenant-quality profile in this submarket — average credit score on applications, eviction rate, late-payment / NSF rate, and stable-employment percentage? A property-management company in the area should have these aggregated.
- How much new for-sale + rental construction is in the pipeline within 1–3 miles? Heavy new supply typically softens prices + rents 12–24 months out; constrained supply supports both.
Investment metrics
- 1% rule
- 1.12% ✓
- Cap rate
- 8.84%
- Cash-on-cash
- 9.09%
- DSCR
- 1.40
- GRM
- 7.4
CMA / ARV
- ARV (median comp)
- $83,978
- List price
- $99,990
- Delta
- 19.07%
- Verdict
- OVERPRICED
- Comps
- 3 within 1.0 mi
Show comp detail 6 sales within ~0.75 mi
| Address | Dist | Beds/Ba | Sqft | Sold | Price | $/sf | Match |
|---|---|---|---|---|---|---|---|
| 2168 Avenue H | 0.43mi | 3/2.0 | 1,340 (+3%) | 6mo | $45,500 | $34 | 66 |
| 1300 Bell St | 0.09mi | 2/1.5 (-1) | 1,150 (-11%) | 9mo | $59,000 | $51 | 62 |
| 2109 8th St | 0.37mi | 2/2.0 (-1) | 1,377 (+6%) | 17mo | $69,900 | $51 | 49 |
| 2147 Avenue J | 0.53mi | 3/1.0 | 1,140 (-12%) | 10mo | $135,000 | $118 | 47 |
| 2402 Kings Hwy | 0.70mi | 3/2.0 | 1,365 (+5%) | 13mo | $105,000 | $77 | 44 |
| 1642 Pearl Ave | 0.75mi | 2/1.0 (-1) | 1,148 (-12%) | 4mo | $59,000 | $51 | 38 |
Match score weights: distance 35% · size 25% · config 20% · recency 20%. Top-matched comps best support the ARV.
Projected returns pro-forma
-3.0% appreciation · 5.27% rent growth · sell at horizon
- IRR
- -0.1%
- Equity multiple
- 1.00×
- Total profit
- $-70
- Equity at exit
- $14,909
- IRR
- 11.8%
- Equity multiple
- 2.02×
- Total profit
- $28,595
- Equity at exit
- $8,645
Cash invested: $27,997 (down + closing). Projections, not guarantees.
Landlord ↔ Tenant lean methodology
- Overall (STATE)
- 87 Strongly Landlord-Friendly
- State Texas
- 87 Strongly Landlord-Friendly · R+5
- County
- — inherits STATE
- City
- — inherits STATE
ZIP-level market 76301
- Home prices YoY
- -34.1%
- Rents YoY
- 5.3%
- Active inventory
- 133
- Price-to-rent
- 7.4×
Monthly cashflow live
- Estimated rent
- $1,119 high interval (Pro) →
- Mortgage (P&I)
- −$524
- Tax from tax record
- −$106 /mo · $1,268/yr
- Insurance
- −$42
- HOA
- −$0
- Vacancy / Maint / Mgmt
- −$235
- Net cashflow
- $212
Break-even live
UW: 25.0% down · 7.5% · 30yr · 1.5% tax · 5.0% vac · 8.0% maint · 8.0% mgmt
Financing live
Cash to close
- Down payment
- $24,998
- Closing costs
- $3,000
- Reserves months
- —
- Total cash needed
- —
Loan-product check · same deal, 3 products live
Conventional
25% down · 7.5% · 30yr
- Down + closing
- —
- Monthly P&I
- —
- Monthly cashflow
- —
- DSCR
- —
- Eligible?
- —
Personal DTI + credit; lowest rate.
DSCR
20% down · 8.5% · 30yr
- Down + closing
- —
- Monthly P&I
- —
- Monthly cashflow
- —
- DSCR
- —
- Eligible?
- —
No personal income docs; deal must DSCR.
Hard money
10% down · 12.0% · 12mo
- Down + closing
- —
- Monthly P&I
- —
- Monthly cashflow
- —
- DSCR
- —
- Eligible?
- —
Short-term bridge; refi at stabilization.
Rent comps 16 comps
| Address | Beds | Baths | Sqft | Rent | $/sqft | DOM | Units | Dist |
|---|---|---|---|---|---|---|---|---|
| 1301 Giddings St Wichita Falls, TX | 3.0 | 1.0 | 1000 | $1,150 | $1.15 | 44d | 1 | 0.03mi |
| 1507 Polk St Wichita Falls, TX | 3.0 | 1.0 | 1316 | $1,050 | $0.80 | 44d | 1 | 0.27mi |
| 1515 Fillmore St Wichita Falls, TX | 3.0 | 2.0 | 909 | $1,225 | $1.35 | 44d | 1 | 0.41mi |
| 1901 Giddings St Wichita Falls, TX | 3.0 | 2.0 | 909 | $1,175 | $1.29 | 44d | 1 | 0.41mi |
| 1821 9th St Unit B Wichita Falls, TX | 2.0 | 1.0 | 1200 | $795 | $0.66 | 44d | 1 | 0.47mi |
| 2006 Bell St Wichita Falls, TX | 3.0 | 1.0 | 1120 | $1,000 | $0.89 | 44d | 1 | 0.52mi |
| 2130 Avenue K Wichita Falls, TX | 3.0 | 2.0 | 1090 | $1,390 | $1.28 | 44d | 1 | 0.53mi |
| 1813 Polk St Wichita Falls, TX | 3.0 | 2.0 | 1090 | $1,364 | $1.25 | 44d | 1 | 0.54mi |
| 1916 7th St Wichita Falls, TX | 2.0 | 1.0 | 1226 | $1,050 | $0.86 | 44d | 1 | 0.60mi |
| 2304 Avenue K Wichita Falls, TX | 3.0 | 2.0 | 1040 | $1,050 | $1.01 | 44d | 1 | 0.72mi |
| 1714 7th St Wichita Falls, TX | 3.0 | 1.0 | 1452 | $850 | $0.59 | 44d | 1 | 0.75mi |
| 2003 Buchanan St Wichita Falls, TX | 3.0 | 2.0 | 1118 | $1,100 | $0.98 | 44d | 1 | 0.79mi |
| 2500 Taylor St Unit 2500 Taylor A Wichita Falls, TX | 2.0 | 1.0 | 910 | $800 | $0.88 | 44d | 1 | 1.02mi |
| 2912 Avenue L Unit L Wichita Falls, TX | 2.0 | 1.0 | 1104 | $895 | $0.81 | 44d | 1 | 1.04mi |
| 1901 Wenonah Ave Unit B Wichita Falls, TX | 2.0 | 1.0 | 946 | $1,000 | $1.06 | 44d | 1 | 1.24mi |
| 2812 Avenue R Unit R Wichita Falls, TX | 2.0 | 1.0 | 1044 | $925 | $0.89 | 44d | 1 | 1.36mi |
Listing history 21 events
-
2026-06-19days on market $99,990 Active 38 DOM
-
2026-06-18days on market $99,990 Active 37 DOM
-
2026-06-17days on market $99,990 Active 36 DOM
-
2026-06-16days on market $99,990 Active 35 DOM
-
2026-06-15days on market $99,990 Active 34 DOM
-
2026-06-14days on market $99,990 Active 32 DOM
-
2026-06-13days on market $99,990 Active 31 DOM
-
2026-06-10days on market $99,990 Active 29 DOM
-
2026-06-09days on market $99,990 Active 28 DOM
-
2026-06-08days on market $99,990 Active 27 DOM
-
2026-06-07days on market $99,990 Active 26 DOM
-
2026-06-05days on market $99,990 Active 23 DOM
-
2026-06-02days on market $99,990 Active 21 DOM
-
2026-06-01days on market $99,990 Active 20 DOM
-
2026-05-31days on market $99,990 Active 19 DOM
-
2026-05-30days on market $99,990 Active 18 DOM
-
2026-05-12$99,990 Active 506-char remark
-
2026-03-31$1,150
-
2017-04-06soldstatus
-
2017-03-31soldstatus 188-char remark
Show marketing remark (188 chars)
Good investment opportunity!!! Single family house has three beds, one bath. Second structure has two apartments and a garage below. Great income opportunity! Needs TLC! Bring me an offer!
-
2016-03-29$32,000 188-char remark
Show marketing remark (188 chars)
Good investment opportunity!!! Single family house has three beds, one bath. Second structure has two apartments and a garage below. Great income opportunity! Needs TLC! Bring me an offer!
ⓘ Source: listings_history table (triggers on properties + properties_extension) + one-shot
backfill from property_details.listing_events for pre-trigger history.
Tax reassessment forecast TX · Resets to sale price
- Current annual tax
- $1,268 · $106/mo
- Projected year-2 tax
- $1,830 · $152/mo
- Expected delta
- +$562/yr (+$47/mo · 44.3%)
ⓘ Screening estimate from a state-policy table — verify with the county assessor before closing.
Climate risk First Street
- Flood 1/10 Low FEMA zone X (unshaded) · 0% chance over 30 yrs
- Wildfire 1/10 Low
- Heat 7/10 Severe 7 d/yr ≥109°F today · 20 d/yr by 30 yrs out
- Wind 4/10 Moderate 8% chance of damaging wind over 30 yrs
- Air quality 1/10 Low 0 unhealthy d/yr today · 0 by 30 yrs out
Nearby sold comps map
Loading sold comps map…
Walkable amenities ~0.75 mi
Loading nearby amenities…
Taxation est. · year 1
- Rental income
- $13,426
- − Mortgage interest
- −$5,601
- − Property taxes
- −$1,268
- − Insurance
- −$500
- − Repairs & maintenance
- −$1,074
- − Management
- −$1,074
- − Depreciation
- −$2,909
- Taxable income
- $1,000
- Est. tax owed @ 24.0%
- −$240
- After-tax cash flow
- $2,306/yr
For passive investors: Depreciation is non-cash, so a rental often shows a tax loss while cash-flowing — sheltering income. Rental losses are passive: they offset passive income freely, and up to $25,000/yr can offset ordinary (W-2) income if you actively participate and your MAGI is under $100k (phasing out to $0 by $150k); unused losses carry forward. On sale, claimed depreciation is recaptured at up to 25%, and gains may owe capital-gains tax (a 1031 exchange can defer both). Figures are a year-1 estimate at your 24.0% rate — not tax advice; consult a CPA.
Schools (NCES district)
- District
- Wichita Falls ISD
- NCES district ID
- 4845780
- Math proficiency
- 31% ▼ -10.00%
- Reading proficiency
- 33% ▼ -7.00%
- Median HH income
- $41,604
- Composite
- 27.06/100
- National rank
- #7051
- State rank
- #585 of 826 in TX
Livability — Wichita Falls
- Score
- 69/100
- State rank
- #437
- US rank
- #8940
Category grades
Schools grade is shown separately in the Schools card above.
Census & demographics
- Census place
- Wichita Falls, TX
- County
- Wichita County · 95,694 people
- City population
- 95,694
- Metro
- Wichita Falls, TX
- Population (ZIP)
- 15,479
- Household income
- $41,947
- Rent vs Own
- Severe rent burden
- 577.0
Population outlook (Wichita County) Hauer SSP2
- Today (2025)
- 129,638 people
- By 2030
- 128,366 · -1.0%
- By 2040
- 124,466 · -4.0%
- By 2050
- 120,499 · -7.0%
- By 2075
- 113,884 · -12.2%
- By 2100
- 101,818 · -21.5%
Race, ethnicity, and origin ACS 2023
- Neighborhood character
- Diverse neighborhood (Simpson 0.67)
- Race & ethnicity
- White 40% Hispanic / Latino 38% Black 18% Two or more races 15% Asian 1%
- Hispanic origin (detail)
- Mexican 36%
- Common ancestry
- Slovak 3% Lithuanian 2% Italian 1%
- Foreign-born
- 11% · Canada, Vietnam
- Languages at home
- 76% English-only · Spanish 22%
Political lean MEDSL · Wichita
- 2024 margin
- Solid R (+44.0) · D 27.5% · R 71.5%
- 2008→2024 swing
- -5.2pp toward R · 2008: -38.9pp · 2024: -44.0pp
- All cycles
- 2024: R+44.0 2020: R+41.1 2016: R+49.7 2012: R+47.1 2008: R+38.9
Not yet ingested
- Civics
- —
Market trends
- HPI YoY
- ▼ -69.89%
- Current HPI
- 135.1511
- Rent YoY
- ▲ 5.27%
- Metro
- Wichita Falls, TX
- State GDP YoY
- ▲ 3.95%
- F500 in state
- 110
Industry mix (Fortune 500 HQ in TX)
| Industry | F500 HQs | Revenue |
|---|---|---|
| Energy | 16 | $1,198B |
|
||
| Technology | 5 | $198B |
|
||
| Engineering / Construction | 4 | $72B |
|
||
| Energy Services | 3 | $60B |
|
||
| Utilities | 3 | $41B |
|
||
| Healthcare | 2 | $330B |
|
||
Price history
-96.4% since first listed6 events — show timeline
- 2026-06-03 Rental Removed $1,150 TENANTCLOUD
- 2026-05-12 Listed $99,990 WFAOR
- 2026-03-31 Listed for Rent $1,150 TENANTCLOUD
- 2017-04-06 Sold (Public Records) — Public Records
- 2017-03-31 Sold (MLS) — WFAOR
- 2016-03-29 Listed $32,000 WFAOR
Property tax history
+6.5%/yrLatest (2025): $1,268 · +1.9% YoY. Source: county tax records.
Cash-flow waterfall
monthlySold comps — $/sqft
last 12 mo · ≤1 miLoading sold comps…