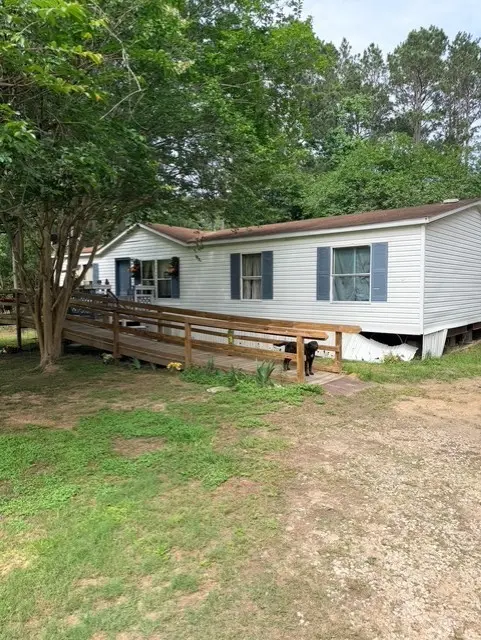
3326 N Walker Rd · Deerwood, TX
Flood risk 8/10 · Major
- FEMA flood zone
- X (unshaded)
- Chance of flooding over 30 yrs
- 0.99%
- Est. flood insurance / yr
- $507 – $1,088
Fire risk 6/10 · Moderate
- Est. fire insurance / yr
- $1,222 – $2,270
Heat risk 8/10 · Major
- Hot days now (above 111°F)
- 7 days/yr
- Hot days in 30 yrs
- 24 days/yr
Wind risk 8/10 · Major
- Chance of severe wind over 30 yrs
- 99.0%
Air-quality risk 2/10 · Minimal
- Unhealthy air days now
- 2 days/yr
- Unhealthy air days in 30 yrs
- 2 days/yr
Risk factors via First Street. Map © Google.
Why this score? — see what drove the C- grade
The composite is a weighted blend of 9 inputs, each scored 0–100. Each bar is that input's sub-score; the figure is the points it added to the 100-point composite (weight × sub-score).
- Cash flow +25.6/30.0
- DSCR +8.5/10.0
- 1% rule +5.7/10.0
- Schools +5.1/10.0
- Rent growth +2.5/5.0
- Livability +2.5/5.0
- Condition / age +2.5/5.0
- ARV discount +0.0/15.0
- Appreciation +0.0/10.0
$189,000
🖨 Deal sheet 📄 Offer letter ✓ Due diligence
Listing remarks
Mobile home on over 1.2 acres, it is unrestricted, the area is growing it is close to Cleveland and Conroe area. It is a 4 bedroom 2 bath, home needs some work but can be a great investment opportunity.
Key facts
- 1.2 acre lot
- Built 2001
- Listed 15 days
Property features AI
Finance
- Other: Seller disclosure available
- Financial info: Lease not considered
Exterior
- Utilities: Water from well; Septic tank sewer
- Home design: Residential property; Single-story (first level entry)
- Construction: Built in 2001; Vinyl siding; Block foundation; Composition roof
- Exterior features: Lot approximately 1.204 acres; Lot features: Other
Interior
- Kitchen: Kitchen (first level, 13x12)
- Bedrooms: Primary bedroom (first level, 12x14); Three additional bedrooms (first level, approx. 11x11, 11x11, 10x11)
- Bathrooms: 2 full bathrooms
- Heating & cooling: Central heating (electric); Central air conditioning (electric)
- Interior features: 6 total rooms; Rooms include living room and kitchen
Neighborhood map
What this means for you Summary
Snapshot
- This is a 4-bed/2.0-bath manufactured listed at $189k.
Deal economics
- At list price, monthly cash flow is $380 ($5k/yr) — positive.
- The deal already cash-flows at list — no discount required.
- Meets the 1% rule at list price ($2k rent vs $189k).
- Recommended offer: $186k (1.5% below list) — sets the bar for market timing.
- Cap rate 9.1% vs local median 5.4% in Deerwood — top-decile yield for the area; either an underpriced asset or a hidden risk that comps aren't pricing in. Stress-test before assuming the spread holds.
Location & tenants
- Location reads: area grade C — affects rentability + tenant quality, not the cash-flow math above.
- Conroe ISD (other): math 57% / reading 57% proficiency, ranked #69 of 826 in TX (top 8%) — acceptable for families but not a draw, mixed tenant base, ~2y average lease.
- Zoned schools: Caney Creek H S (math 33% / reading 42%, grade F, #888 of 1,632 statewide, top 55%, 2,504 students, 79% FRL) — zoned schools average 79% FRL vs 34% district-wide (45 pts higher); higher-poverty schools than district average — tighter screening recommended.
- Zoned-school proficiency averages 38% at this address vs 57% district-wide (-20 pts) — the specific schools serving this property underperform the Conroe ISD average; the district grade overstates school quality for this exact location.
- Market conditions: 336 active listings in the ZIP; 3 comparable units currently listed for rent nearby; rentals leasing fast (median 10d on market — plan ~1-2 weeks tenant-placement turnaround); 13,259 units permitted in Montgomery County in 2024 (1,402 in 5+ unit buildings).
- This rent runs 39% of the median local income ($62k/yr) — at the standard rent-burdened threshold; future hikes will face affordability resistance.
Forward outlook
- Local home prices are declining (-3.0%/yr); year-one equity from $1k of loan paydown is wiped out by about $6k of value loss. Plan a longer hold.
- Montgomery County population projected at +65% by 2050 — long-run rental-demand tailwind backs the buy-and-hold thesis.
Negotiation context
- It's been on market 16 days — a 2% lower offer ($186k) is reasonable based on typical stale-listing flexibility.
- 5 sale attempts since 23y ago with the ask held roughly flat each time — persistent listings suggest the price (not the market) is what's stuck; bring a comps-based counter.
Risks & watch-outs
- Watch-outs: flood insurance adds $66/mo.
- Climate carrying-cost: severe flood risk; severe wind risk, 99% chance of damaging wind over 30y; major wildfire risk; extreme-heat days projected 7→24/yr by 2055 (HVAC capex compounding) — expect insurance premiums to compound above CPI over the hold.
Questions for the listing agent
- What's the actual annual flood-insurance premium (NFIP or private), and is the property in a SFHA with mandatory coverage?
- Is there a deadline driving the sale (1031 exchange, divorce, estate, relocation)? That informs how much negotiation room exists.
- What's the average days-on-market for RENTAL listings here right now (not sales)? A rising rental-DOM trend means longer vacancies and softer asking-rent achievability than the comps imply.
- What's the recent tenant-quality profile in this submarket — average credit score on applications, eviction rate, late-payment / NSF rate, and stable-employment percentage? A property-management company in the area should have these aggregated.
- How much new for-sale + rental construction is in the pipeline within 1–3 miles? Heavy new supply typically softens prices + rents 12–24 months out; constrained supply supports both.
Investment metrics
- 1% rule
- 1.07% ✓
- Cap rate
- 9.13%
- Cash-on-cash
- 10.13%
- DSCR
- 1.45
- GRM
- 7.8
CMA / ARV
- ARV (median comp)
- $159,990
- List price
- $189,000
- Delta
- 18.13%
- Verdict
- OVERPRICED
- Comps
- 5 within 2.0 mi
Show comp detail 1 sale within ~0.75 mi
| Address | Dist | Beds/Ba | Sqft | Sold | Price | $/sf | Match |
|---|---|---|---|---|---|---|---|
| 18200 Dodd Rd | 0.70mi | 4/2.0 | 1,512 (+4%) | 7mo | $199,000 | $132 | 55 |
Match score weights: distance 35% · size 25% · config 20% · recency 20%. Top-matched comps best support the ARV.
Projected returns pro-forma
-3.0% appreciation · 3.0% rent growth · sell at horizon
- IRR
- -3.2%
- Equity multiple
- 0.88×
- Total profit
- $-6,430
- Equity at exit
- $28,181
- IRR
- 6.4%
- Equity multiple
- 1.48×
- Total profit
- $25,489
- Equity at exit
- $16,341
Cash invested: $52,920 (down + closing). Projections, not guarantees.
Landlord ↔ Tenant lean methodology
- Overall (STATE)
- 87 Strongly Landlord-Friendly
- State Texas
- 87 Strongly Landlord-Friendly · R+5
- County
- — inherits STATE
- City
- — inherits STATE
ZIP-level market 77328
- Home prices YoY
- -7.7%
- Active inventory
- 336
- Price-to-rent
- 7.8×
Monthly cashflow live
- Estimated rent
- $2,022 medium interval (Pro) →
- Mortgage (P&I)
- −$991
- Tax from tax record
- −$81 /mo · $967/yr
- Insurance
- −$79
- Flood insurance flood zone
- −$66 /mo · $798/yr
- HOA
- −$0
- Vacancy / Maint / Mgmt
- −$425
- Net cashflow
- $380
Break-even live
UW: 25.0% down · 7.5% · 30yr · 1.5% tax · 5.0% vac · 8.0% maint · 8.0% mgmt
Financing live
Cash to close
- Down payment
- $47,250
- Closing costs
- $5,670
- Reserves months
- —
- Total cash needed
- —
Loan-product check · same deal, 3 products live
Conventional
25% down · 7.5% · 30yr
- Down + closing
- —
- Monthly P&I
- —
- Monthly cashflow
- —
- DSCR
- —
- Eligible?
- —
Personal DTI + credit; lowest rate.
DSCR
20% down · 8.5% · 30yr
- Down + closing
- —
- Monthly P&I
- —
- Monthly cashflow
- —
- DSCR
- —
- Eligible?
- —
No personal income docs; deal must DSCR.
Hard money
10% down · 12.0% · 12mo
- Down + closing
- —
- Monthly P&I
- —
- Monthly cashflow
- —
- DSCR
- —
- Eligible?
- —
Short-term bridge; refi at stabilization.
Rent comps 3 comps
| Address | Beds | Baths | Sqft | Rent | $/sqft | DOM | Units | Dist |
|---|---|---|---|---|---|---|---|---|
| 2140 Cedar Bend Dr Conroe, TX | 4.0 | 3.0 | 1871 | $1,995 | $1.07 | 10d | 1 | 1.07mi |
| 308 Kinsman Rd Cleveland, TX | 3.0 | 1.5 | 1400 | $1,650 | $1.18 | 7d | 1 | 1.15mi |
| 308 Kinsman Rd Cleveland, TX | 3.0 | 1.5 | 1400 | $1,650 | $1.18 | 43d | 1 | 1.15mi |
Listing history 23 events
-
2026-06-18days on market $189,000 Active 16 DOM
-
2026-06-17days on market $189,000 Active 15 DOM
-
2026-06-16days on market $189,000 Active 14 DOM
-
2026-06-15days on market $189,000 Active 13 DOM
-
2026-06-13days on market $189,000 Active 11 DOM
-
2026-06-09days on market $189,000 Active 7 DOM
-
2026-06-08days on market $189,000 Active 6 DOM
-
2026-06-07days on market $189,000 Active 5 DOM
-
2026-06-04days on market $189,000 Active 2 DOM
-
2026-06-03statusdays on market $189,000 Active 1 DOM
-
2026-06-02days on market $189,000 Coming Soon 21 DOM
-
2026-06-01days on market $189,000 Coming Soon 20 DOM
-
2026-05-31days on market $189,000 Coming Soon 19 DOM
-
2026-05-12historical $189,000 203-char remark
-
2025-08-27historical
-
2025-08-25$99,000 Active
-
2025-08-25historical
-
2025-08-04$99,000 Active
-
2004-03-02soldstatus
-
2003-12-11historical
-
2003-07-21$59,900
-
2003-07-19historical
-
2003-01-19$70,000
ⓘ Source: listings_history table (triggers on properties + properties_extension) + one-shot
backfill from property_details.listing_events for pre-trigger history.
Tax reassessment forecast TX · Resets to sale price
- Current annual tax
- $967 · $81/mo
- Projected year-2 tax
- $3,459 · $288/mo
- Expected delta
- +$2,491/yr (+$208/mo · 257.6%)
ⓘ Screening estimate from a state-policy table — verify with the county assessor before closing.
Climate risk First Street
- Flood 8/10 Severe FEMA zone X (unshaded) · 99% chance over 30 yrs
- Wildfire 6/10 Major
- Heat 8/10 Severe 7 d/yr ≥111°F today · 24 d/yr by 30 yrs out
- Wind 8/10 Severe 99% chance of damaging wind over 30 yrs
- Air quality 2/10 Low 2 unhealthy d/yr today · 2 by 30 yrs out
Nearby sold comps map
Loading sold comps map…
Walkable amenities ~0.75 mi
Loading nearby amenities…
Taxation est. · year 1
- Rental income
- $24,262
- − Mortgage interest
- −$10,587
- − Property taxes
- −$967
- − Insurance
- −$1,742
- − Repairs & maintenance
- −$1,941
- − Management
- −$1,941
- − Depreciation
- −$5,498
- Taxable income
- $1,585
- Est. tax owed @ 24.0%
- −$380
- After-tax cash flow
- $4,183/yr
For passive investors: Depreciation is non-cash, so a rental often shows a tax loss while cash-flowing — sheltering income. Rental losses are passive: they offset passive income freely, and up to $25,000/yr can offset ordinary (W-2) income if you actively participate and your MAGI is under $100k (phasing out to $0 by $150k); unused losses carry forward. On sale, claimed depreciation is recaptured at up to 25%, and gains may owe capital-gains tax (a 1031 exchange can defer both). Figures are a year-1 estimate at your 24.0% rate — not tax advice; consult a CPA.
Schools (NCES district)
- District
- Conroe ISD
- NCES district ID
- 4815000
- Math proficiency
- 57% ▼ -6.00%
- Reading proficiency
- 57% ▼ -1.00%
- Median HH income
- $71,541
- Composite
- 50.65/100
- National rank
- #1833
- State rank
- #69 of 826 in TX
Livability — Deerwood
No livability data for this city. (Only ~50 U.S. cities are tracked.)
Census & demographics
- County
- San Jacinto County · 17,208 people
- Metro
- Houston-The Woodlands-Sugar Land, TX
- Population (ZIP)
- 17,208
- Household income
- $62,428
- Rent vs Own
- Severe rent burden
- 58.0
Population outlook (Montgomery County) Hauer SSP2
- Today (2025)
- 713,896 people
- By 2030
- 805,263 · +12.8%
- By 2040
- 992,708 · +39.1%
- By 2050
- 1,179,590 · +65.2%
- By 2075
- 1,628,084 · +128.1%
- By 2100
- 1,937,880 · +171.5%
Race, ethnicity, and origin ACS 2023
- Neighborhood character
- Majority White (61%)
- Race & ethnicity
- White 61% Hispanic / Latino 33% Two or more races 14% Black 2%
- Hispanic origin (detail)
- Mexican 27% Cuban 1%
- Common ancestry
- Lithuanian 4% Italian 3% Serbian 3%
- Foreign-born
- 18% · Canada, China
- Languages at home
- 67% English-only · Spanish 31% Chinese 1%
Political lean MEDSL · Montgomery
- 2024 margin
- Solid R (+45.5) · D 26.8% · R 72.3%
- 2008→2024 swing
- +7.2pp toward D · 2008: -52.7pp · 2024: -45.5pp
- All cycles
- 2024: R+45.5 2020: R+43.8 2016: R+51.4 2012: R+60.7 2008: R+52.7
Not yet ingested
- Civics
- —
Market trends
- HPI YoY
- ▼ -22.82%
- Current HPI
- 273.6604
- Rent YoY
- —
- Metro
- Houston-The Woodlands-Sugar Land, TX
- State GDP YoY
- ▲ 3.95%
- F500 in state
- 110
Industry mix (Fortune 500 HQ in TX)
| Industry | F500 HQs | Revenue |
|---|---|---|
| Energy | 16 | $1,198B |
|
||
| Technology | 5 | $198B |
|
||
| Engineering / Construction | 4 | $72B |
|
||
| Energy Services | 3 | $60B |
|
||
| Utilities | 3 | $41B |
|
||
| Healthcare | 2 | $330B |
|
||
Price history
+170.0% since first listed11 events — show timeline
- 2026-06-03 Listed $189,000 HARMLS
- 2026-05-12 Coming Soon $189,000 HARMLS
- 2025-08-27 Listing Removed — HARMLS
- 2025-08-25 Listing Removed — HARMLS
- 2025-08-25 Listed $99,000 HARMLS
- 2025-08-04 Listed $99,000 HARMLS
- 2004-03-02 Sold (Public Records) — Public Records
- 2003-12-11 Listing Removed — HARMLS
- 2003-07-21 Listed $59,900 HARMLS
- 2003-07-19 Listing Removed — HARMLS
- 2003-01-19 Listed $70,000 HARMLS
Property tax history
+9.5%/yrLatest (2025): $967 · +9.6% YoY. Source: county tax records.
Cash-flow waterfall
monthlySold comps — $/sqft
last 12 mo · ≤1 miLoading sold comps…