223 W Locust St · Canton, IL
Flood risk 1/10 · Minimal
- FEMA flood zone
- X (unshaded)
- Chance of flooding over 30 yrs
- 0.0%
- Est. flood insurance / yr
- $473 – $860
Fire risk 1/10 · Minimal
- Est. fire insurance / yr
- $804 – $1,492
Heat risk 3/10 · Minor
- Hot days now (above 105°F)
- 7 days/yr
- Hot days in 30 yrs
- 18 days/yr
Wind risk 2/10 · Minimal
- Chance of severe wind over 30 yrs
- 1.0%
Air-quality risk 2/10 · Minimal
- Unhealthy air days now
- 1 days/yr
- Unhealthy air days in 30 yrs
- 2 days/yr
Risk factors via First Street. Map © Google.
Why this score? — see what drove the D+ grade
The composite is a weighted blend of 9 inputs, each scored 0–100. Each bar is that input's sub-score; the figure is the points it added to the 100-point composite (weight × sub-score).
- ARV discount +15.0/15.0
- Cash flow +10.9/30.0
- 1% rule +5.9/10.0
- Livability +3.6/5.0
- DSCR +3.2/10.0
- Rent growth +2.5/5.0
- Condition / age +2.5/5.0
- Schools +1.8/10.0
- Appreciation +0.0/10.0
$64,000
🖨 Deal sheet (PDF) 📄 Offer letter ✓ Due diligence
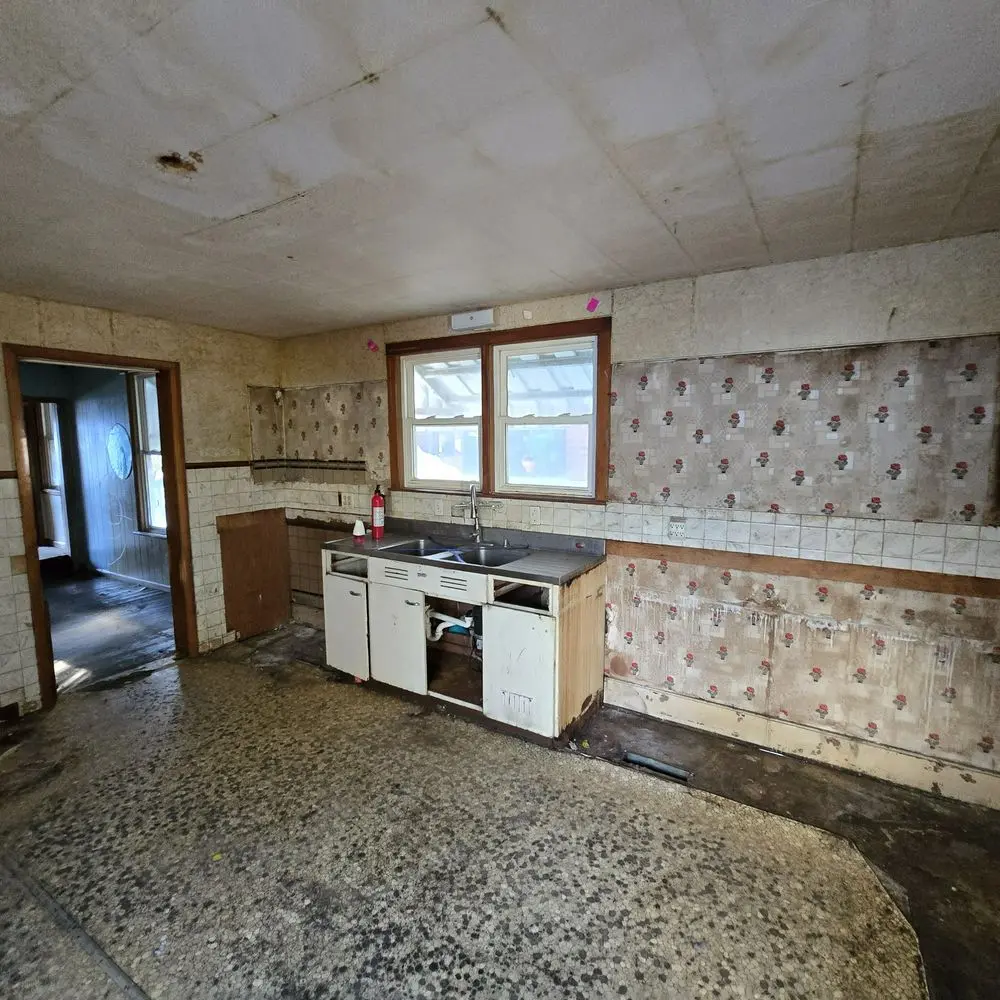
Listing remarks MLS
For Sale: Fixer-Upper in Canton! Don't miss out on this opportunity to transform a charming property into your dream home or investment! Address: 223 W Locust Bedrooms: 3 Bathrooms: 2 Square Footage: 1516 sqft This home is brimming with potential and just needs a little TLC to shine! Perfect for a savvy fixer and flipper or anyone looking for a project home. Priced to sell FAST! Contact Us for More Info: Jon Olson: [email protected] | 727-263-3034 Cash Buyers only $500 EMD 7 day inspection 30 day close
Key facts
- 7,840 sq ft lot
- Built 1911
- Listed 215 days
Neighborhood map
What this means for you Summary
Snapshot
- This is a 3-bed/2.0-bath other listed at $64k.
Deal economics
- At list price, monthly cash flow is $-28 ($-331/yr) — negative.
- To cash-flow at today's rent, offer at most $59k (7.6% below list).
- Meets the 1% rule at list price ($698 rent vs $64k).
- Recommended offer: $56k (12.0% below list) — sets the bar for market timing.
- Cap rate 5.8% vs local median 7.8% in Canton — below-typical yield; the buyer is paying a premium for something (appreciation thesis, condition, location) that the cap rate doesn't capture.
Location & tenants
- Location reads 72/100 on livability (#318 in IL) — a middle-class / working-renter tenant base. Strengths: cost of living A+, housing A+, health & safety A+; Watch: crime C-, amenities F, commute F.
- Canton Union SD 66 (town): math 19% / reading 23% proficiency, ranked #417 of 620 in IL (top 67%) — low school quality limits family demand, transient renter base, plan for 1-2y turnover.
- Zoned schools: Westview Elementary School (math 17% / reading 17%, grade F, #1,141 of 2,056 statewide, top 59%, 398 students, 0% FRL); Ingersoll Middle School (math 18% / reading 24%, grade F, #405 of 665 statewide, top 61%, 645 students, 0% FRL); Canton High School (math 22% / reading 27%, grade F, #256 of 693 statewide, top 44%, 641 students, 0% FRL) — zoned schools average 0% FRL vs 46% district-wide (46 pts lower); this property's tenant base skews higher-income than the district average.
- Market conditions: 109 active listings in the ZIP; 1 comparable units currently listed for rent nearby; 14 units permitted in Fulton County in 2024 (0 in 5+ unit buildings).
Forward outlook
- Local home prices are declining (-3.0%/yr); year-one equity from $442 of loan paydown is wiped out by about $2k of value loss. Plan a longer hold.
- Fulton County population projected at -20% by 2050 — secular population decline; favor cash flow + early exit over multi-decade hold.
Negotiation context
- It's been on market 215 days — a 12% lower offer ($56k) is reasonable based on typical stale-listing flexibility.
- 5 sale attempts since 26y ago with the ask held roughly flat each time — persistent listings suggest the price (not the market) is what's stuck; bring a comps-based counter.
- Current owner paid $20k; list at $64k implies a 220% gain — meaningful room to come down on a strong offer.
Risks & watch-outs
- Watch-outs: property tax is 4.1% of price; built in 1911 — expect roof / HVAC / electrical / plumbing capex.
Questions for the listing agent
- What do current leases actually rent for vs. the listed asking? Can we see a recent rent roll and the last 12 months of T-12 income?
- It's been on market 215 days. Have you received any prior offers? Is the seller open to a 12% concession, seller financing, or rate buy-down credit?
- Built in 1911 — when were the roof, HVAC, electrical panel, plumbing, and water heater last replaced?
- Property tax is high relative to price — has the assessment been appealed recently, and will the sale trigger a re-assessment?
- Why hasn't it sold? Are there any deal-killer items the seller is aware of (foundation, flood, title, zoning, code violations)?
- Is there a deadline driving the sale (1031 exchange, divorce, estate, relocation)? That informs how much negotiation room exists.
- Schools are F-rated, which usually means shorter tenancies and higher turnover. Who's the typical renter profile here, and what's been the actual vacancy rate?
- The area grade is low — what's the realistic commute time and amenity access for the typical tenant pool here? Any planned neighborhood developments (good or bad) we should know about?
- What's the average days-on-market for RENTAL listings here right now (not sales)? A rising rental-DOM trend means longer vacancies and softer asking-rent achievability than the comps imply.
- What's the recent tenant-quality profile in this submarket — average credit score on applications, eviction rate, late-payment / NSF rate, and stable-employment percentage? A property-management company in the area should have these aggregated.
- How much new for-sale + rental construction is in the pipeline within 1–3 miles? Heavy new supply typically softens prices + rents 12–24 months out; constrained supply supports both.
Investment metrics
- 1% rule
- 1.09% ✓
- Cap rate
- 5.78%
- Cash-on-cash
- -1.85%
- DSCR
- 0.92
- GRM
- 7.6
CMA / ARV
- ARV (median comp)
- $96,754
- List price
- $64,000
- Delta
- -33.85%
- Verdict
- UNDERPRICED
- Comps
- 20 within 1.0 mi
Projected returns pro-forma
-3.0% appreciation · 3.0% rent growth · sell at horizon
- IRR
- -19.2%
- Equity multiple
- 0.33×
- Total profit
- $-12,033
- Equity at exit
- $9,543
- IRR
- -11.4%
- Equity multiple
- 0.31×
- Total profit
- $-12,356
- Equity at exit
- $5,534
Cash invested: $17,920 (down + closing). Projections, not guarantees.
Landlord ↔ Tenant lean methodology
- Overall (STATE)
- 43 Moderately Tenant-Leaning
- State Illinois
- 43 Moderately Tenant-Leaning · D+7
- County
- — inherits STATE
- City
- — inherits STATE
ZIP-level market 61520
- Active inventory
- 109
- Price-to-rent
- 7.6×
Monthly cashflow live
- Estimated rent
- $698 medium interval (Pro) →
- Mortgage (P&I)
- −$336
- Tax from tax record
- −$217 /mo · $2,601/yr
- Insurance
- −$27
- HOA
- −$0
- Lot rent
- −$0
- Vacancy / Maint / Mgmt
- −$147
- Net cashflow
- $-28
Break-even live
Sensitivity live
| Price | -10% $9 | -5% $-9 | +0% $-28 | +5% $-46 | +10% $-64 |
|---|---|---|---|---|---|
| Rent | -10% $-83 | -5% $-55 | +0% $-28 | +5% $0 | +10% $28 |
| Rate | -1.0pp $5 | -0.5pp $-11 | base $-28 | +0.5pp $-44 | +1.0pp $-61 |
UW: 25.0% down · 7.5% · 30yr · 1.5% tax · 5.0% vac · 8.0% maint · 8.0% mgmt
Financing live
Cash to close
- Down payment
- $16,000
- Closing costs
- $1,920
- Reserves months
- —
- Total cash needed
- —
Loan-product check · same deal, 3 products live
Conventional
25% down · 7.5% · 30yr
- Down + closing
- —
- Monthly P&I
- —
- Monthly cashflow
- —
- DSCR
- —
- Eligible?
- —
Personal DTI + credit; lowest rate.
DSCR
20% down · 8.5% · 30yr
- Down + closing
- —
- Monthly P&I
- —
- Monthly cashflow
- —
- DSCR
- —
- Eligible?
- —
No personal income docs; deal must DSCR.
Hard money
10% down · 12.0% · 12mo
- Down + closing
- —
- Monthly P&I
- —
- Monthly cashflow
- —
- DSCR
- —
- Eligible?
- —
Short-term bridge; refi at stabilization.
Rent comps 1 comps
| Address | Beds | Baths | Sqft | Rent | $/sqft | DOM | Units | Dist |
|---|---|---|---|---|---|---|---|---|
| 1100 W Locust St Unit 32 Canton, IL | 3.0 | 2.0 | 952 | $698 | $0.73 | 16d | 1 | 1.42mi |
Listing history 30 events
-
2026-06-22days on market $64,000 Active 215 DOM
-
2026-06-21days on market $64,000 Active 214 DOM
-
2026-06-21days on market $64,000 Active 213 DOM
-
2026-06-18days on market $64,000 Active 211 DOM
-
2026-06-17days on market $64,000 Active 210 DOM
-
2026-06-16days on market $64,000 Active 209 DOM
-
2026-06-15days on market $64,000 Active 208 DOM
-
2026-06-13days on market $64,000 Active 206 DOM
-
2026-06-12days on market $64,000 Active 205 DOM
-
2026-06-09days on market $64,000 Active 202 DOM
-
2026-06-08days on market $64,000 Active 201 DOM
-
2026-06-07days on market $64,000 Active 200 DOM
-
2026-06-07days on market $64,000 Active 199 DOM
-
2026-06-04days on market $64,000 Active 196 DOM
-
2026-06-02days on market $64,000 Active 195 DOM
-
2026-06-01days on market $64,000 Active 194 DOM
-
2026-05-31days on market $64,000 Active 193 DOM
-
2026-05-31days on market $64,000 Active 192 DOM
-
2026-04-08historical
-
2026-03-02price
-
2026-02-11Active
-
2026-02-04price $64,000 528-char remark
Show marketing remark (528 chars)
For Sale: Fixer-Upper in Canton! Don't miss out on this opportunity to transform a charming property into your dream home or investment! Address: 223 W Locust Bedrooms: 3 Bathrooms: 2 Square Footage: 1516 sqft This home is brimming with potential and just needs a little TLC to shine! Perfect for a savvy fixer and flipper or anyone looking for a project home. Priced to sell FAST! Contact Us for More Info: Jon Olson: [email protected] | 727-263-3034 Cash Buyers only $500 EMD 7 day inspection 30 day close
-
2025-11-19$65,000 Active 528-char remark
Show marketing remark (528 chars)
For Sale: Fixer-Upper in Canton! Don't miss out on this opportunity to transform a charming property into your dream home or investment! Address: 223 W Locust Bedrooms: 3 Bathrooms: 2 Square Footage: 1516 sqft This home is brimming with potential and just needs a little TLC to shine! Perfect for a savvy fixer and flipper or anyone looking for a project home. Priced to sell FAST! Contact Us for More Info: Jon Olson: [email protected] | 727-263-3034 Cash Buyers only $500 EMD 7 day inspection 30 day close
-
2025-05-08historical $689
-
2025-05-01$689
-
2021-08-06historical
-
2021-04-16soldstatus $20,000
-
2021-02-02$29,900
-
2000-06-30soldstatus $48,000
-
2000-01-04$49,900
ⓘ Source: listings_history table (triggers on properties + properties_extension) + one-shot
backfill from property_details.listing_events for pre-trigger history.
Tax reassessment forecast IL · Partial reset (capped growth)
- Current annual tax
- $2,601 · $217/mo
- Projected year-2 tax
- $2,601 · $217/mo
- Expected delta
- $0/yr ($0/mo · 0.0%)
ⓘ Screening estimate from a state-policy table — verify with the county assessor before closing.
Climate risk First Street
- Flood 1/10 Low FEMA zone X (unshaded) · 0% chance over 30 yrs
- Wildfire 1/10 Low
- Heat 3/10 Moderate 7 d/yr ≥105°F today · 18 d/yr by 30 yrs out
- Wind 2/10 Low 100% chance of damaging wind over 30 yrs
- Air quality 2/10 Low 1 unhealthy d/yr today · 2 by 30 yrs out
Nearby sold comps map
Loading sold comps map…
Walkable amenities ~0.75 mi
Loading nearby amenities…
Taxation est. · year 1
- Rental income
- $8,376
- − Mortgage interest
- −$3,585
- − Property taxes
- −$2,601
- − Insurance
- −$320
- − Repairs & maintenance
- −$670
- − Management
- −$670
- − Depreciation
- −$1,862
- Taxable loss
- −$1,331
- Est. tax savings @ 24.0%
- +$320
- After-tax cash flow
- $-11/yr
For passive investors: Depreciation is non-cash, so a rental often shows a tax loss while cash-flowing — sheltering income. Rental losses are passive: they offset passive income freely, and up to $25,000/yr can offset ordinary (W-2) income if you actively participate and your MAGI is under $100k (phasing out to $0 by $150k); unused losses carry forward. On sale, claimed depreciation is recaptured at up to 25%, and gains may owe capital-gains tax (a 1031 exchange can defer both). Figures are a year-1 estimate at your 24.0% rate — not tax advice; consult a CPA.
Schools (NCES district)
- District
- Canton Union SD 66
- NCES district ID
- 1708280
- Math proficiency
- 19% ▼ -10.00%
- Reading proficiency
- 23% ▼ -12.00%
- Median HH income
- $42,657
- Composite
- 18.03/100
- National rank
- #8980
- State rank
- #417 of 620 in IL
Livability — Canton
- Score
- 72/100
- State rank
- #318
- US rank
- #6313
Category grades
Schools grade is shown separately in the Schools card above.
Census & demographics
- Census place
- Canton, IL
- Population (ZIP)
- 16,098
Population outlook (Fulton County) Hauer SSP2
- Today (2025)
- 33,356 people
- By 2030
- 32,144 · -3.6%
- By 2040
- 29,518 · -11.5%
- By 2050
- 26,775 · -19.7%
- By 2075
- 19,972 · -40.1%
- By 2100
- 13,580 · -59.3%
Race, ethnicity, and origin ACS 2023
- Neighborhood character
- Predominantly White (88%)
- Race & ethnicity
- White 88% Black 5% Hispanic / Latino 4% Two or more races 4% Native American 1%
- Common ancestry
- Slovak 3% Lithuanian 1% Romanian 1%
- Foreign-born
- 2% · Canada
- Languages at home
- 96% English-only · Spanish 3%
Political lean MEDSL · Fulton
- 2024 margin
- Strong R (+23.8) · D 37.1% · R 60.9% · Other 2.0%
- 2008→2024 swing
- -45.2pp toward R · 2008: 21.3pp · 2024: -23.8pp
- All cycles
- 2024: R+23.8 2020: R+20.1 2016: R+15.1 2012: D+11.1 2008: D+21.3
Not yet ingested
- Civics
- —
Market trends
- HPI YoY
- ▼ -88.00%
- Current HPI
- 123.8086
- Rent YoY
- —
- Metro
- —
- State GDP YoY
- ▲ 1.59%
- F500 in state
- 60
Industry mix (Fortune 500 HQ in IL)
| Industry | F500 HQs | Revenue |
|---|---|---|
| Insurance | 4 | $201B |
|
||
| Consumer Goods | 4 | $87B |
|
||
| Industrial Machinery | 3 | $64B |
|
||
| Healthcare | 2 | $55B |
|
||
| Retail / Pharmacy | 1 | $148B |
|
||
| Agriculture / Food | 1 | $86B |
|
||
Price history
+28.3% since first listed12 events — show timeline
- 2026-04-08 Listing Removed — RMLSA as Distributed by MLS Grid
- 2026-03-02 Price Changed — RMLSA as Distributed by MLS Grid
- 2026-02-11 Listed — RMLSA as Distributed by MLS Grid
- 2026-02-04 Price Changed $64,000 ForSaleByOwner.com
- 2025-11-19 Listed $65,000 ForSaleByOwner.com
- 2025-05-08 Rental Removed $689 Hemlane
- 2025-05-01 Listed for Rent $689 Hemlane
- 2021-08-06 Listing Removed — RMLSA as Distributed by MLS Grid
- 2021-04-16 Sold (MLS) $20,000 RMLSA as Distributed by MLS Grid
- 2021-02-02 Listed $29,900 RMLSA as Distributed by MLS Grid
- 2000-06-30 Sold (MLS) $48,000 RMLSA as Distributed by MLS Grid
- 2000-01-04 Listed $49,900 RMLSA as Distributed by MLS Grid
Property tax history
+4.4%/yrLatest (2024): $2,601 · +3.6% YoY. Source: county tax records.
Cash-flow waterfall
monthlySold comps — $/sqft
last 12 mo · ≤1 miLoading sold comps…