430 Post Rd #33 · Wells, ME
Flood risk No data
- FEMA flood zone
- —
- Chance of flooding over 30 yrs
- —
- Est. flood insurance / yr
- —
Fire risk No data
- Est. fire insurance / yr
- —
Heat risk No data
- Hot days now (above threshold)
- —
- Hot days in 30 yrs
- —
Wind risk No data
- Chance of severe wind over 30 yrs
- —
Air-quality risk No data
- Unhealthy air days now
- —
- Unhealthy air days in 30 yrs
- —
Risk factors via First Street. Map © Google.
Why this score? — see what drove the D+ grade
The composite is a weighted blend of 9 inputs, each scored 0–100. Each bar is that input's sub-score; the figure is the points it added to the 100-point composite (weight × sub-score).
- Cash flow +15.0/30.0
- Schools +7.6/10.0
- ARV discount +7.5/15.0
- 1% rule +5.0/10.0
- DSCR +5.0/10.0
- Rent growth +2.5/5.0
- Livability +2.5/5.0
- Condition / age +2.5/5.0
- Appreciation +0.0/10.0
$52,000
🖨 Deal sheet 📄 Offer letter ✓ Due diligence
Listing remarks
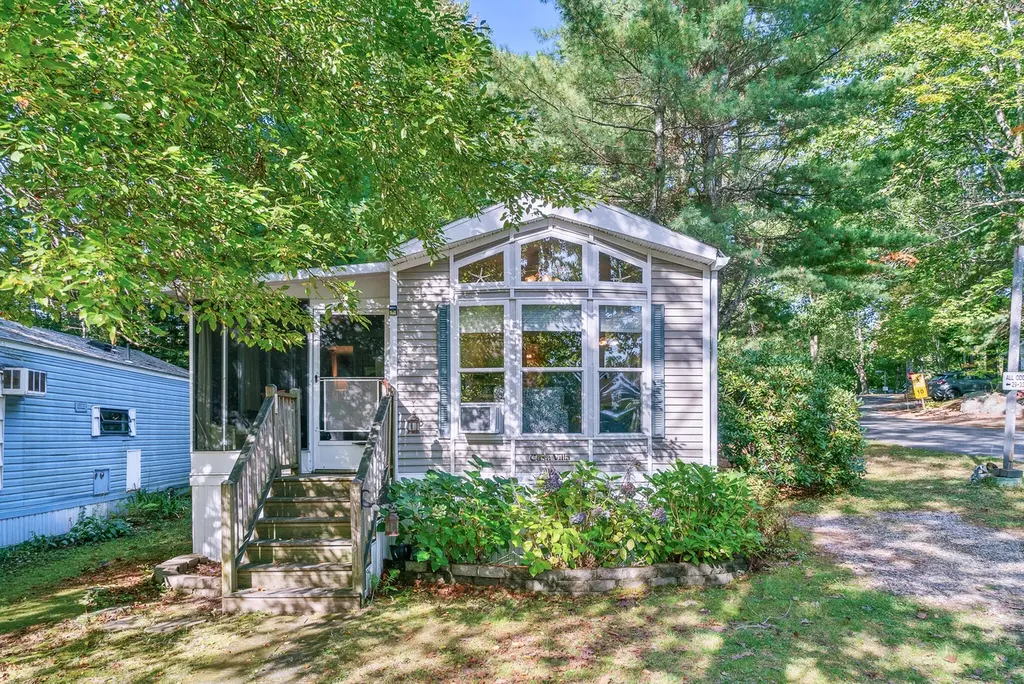
Welcome to Meadowledge, a sought-after gated seasonal resort community in Wells, offering the perfect blend of amenities and location! Residents enjoy TWO sparkling pools, a clubhouse, pickleball courts, coin-op laundry, and a calendar full of fun community events. This pet-friendly park welcomes your four-legged friends. This particular home is set in one of the most desirable locations in the community, close to the front entrance for easy access to dining, shopping, and activities. Step inside to find a bright and open living area with vaulted ceilings, large windows, and plenty of natural light. The spacious kitchen offers ample cabinetry, a gas range, and a comfortable dining area. The
Key facts
- Pet-friendly park
- Two sparkling pools
- Clubhouse
Tags
Property features AI
Finance
- Other: Clubhouse on site; Subdivision: Meadowledge Resort; Zoning: RA; Address: 430 Post Rd #33, Wells, ME 04090; Gated community (GPS-navigable). Once through gate look for #33 on left.
- Financial info: Land lease (yes)
- HOA & community: Has association; Annual association fee (paid annually)
Exterior
- Parking: Gravel parking
- Utilities: Public water; Public sewer; Electric with circuit breakers; Gas water heater
- Home design: Mobile home (single wide); Facing information not provided; Entry level information not provided; One story (single wide mobile home)
- Construction: Built in 1998; Vinyl siding; Shingle roof; Mobile construction
- Exterior features: Screened porch; Located in a mobile home park; Near golf course, public beach, shopping, turnpike/interstate, and town; Corner, level lot; Paved road access
Interior
- Kitchen: Microwave; Gas range; Refrigerator
- Bedrooms: Bedroom 1 — First floor; Bedroom 2 — First floor
- Flooring: Carpet; Laminate
- Bathrooms: 1 full bathroom
- Heating & cooling: Forced air heating; Space heater
- Interior features: Furnished; 1st floor bedroom; Total of 4 rooms
Neighborhood map
What this means for you Summary
Snapshot
- This is a 2-bed/1.0-bath manufactured listed at $52k.
Deal economics
- At list price, monthly cash flow is $566 ($7k/yr) — positive.
- The deal already cash-flows at list — no discount required.
- Meets the 1% rule at list price ($2k rent vs $52k).
- Recommended offer: $51k (1.5% below list) — sets the bar for market timing.
Location & tenants
- Location reads: area grade D — affects rentability + tenant quality, not the cash-flow math above.
- Wells-Ogunquit CSD (rural): math 87% / reading 90% proficiency, ranked #32 of 112 in ME (top 29%) — strong family-tenant draw, lease renewals of 3-5y typical; only 17% free/reduced lunch — higher-income household profile.
- Market conditions: 267 active listings in the ZIP; 1,386 units permitted in York County in 2024 (338 in 5+ unit buildings).
Forward outlook
- Local home prices are declining (-3.0%/yr); year-one equity from $360 of loan paydown is wiped out by about $2k of value loss. Plan a longer hold.
- At projected returns (-3.0% appreciation + 3.0% rent growth), your $15k cash investment doubles in ~3 years — after that, you're playing with house money.
Negotiation context
- It's been on market 22 days — a 2% lower offer ($51k) is reasonable based on typical stale-listing flexibility.
- 3 sale attempts since 7y ago with the ask held roughly flat each time — persistent listings suggest the price (not the market) is what's stuck; bring a comps-based counter.
Risks & watch-outs
- Watch-outs: HOA is 38% of rent.
Questions for the listing agent
- What does the HOA fee cover, when was the last increase, and are there any pending special assessments or reserve-fund shortfalls?
- Is there a deadline driving the sale (1031 exchange, divorce, estate, relocation)? That informs how much negotiation room exists.
- The area grade is low — what's the realistic commute time and amenity access for the typical tenant pool here? Any planned neighborhood developments (good or bad) we should know about?
- What's the average days-on-market for RENTAL listings here right now (not sales)? A rising rental-DOM trend means longer vacancies and softer asking-rent achievability than the comps imply.
- What's the recent tenant-quality profile in this submarket — average credit score on applications, eviction rate, late-payment / NSF rate, and stable-employment percentage? A property-management company in the area should have these aggregated.
- How much new for-sale + rental construction is in the pipeline within 1–3 miles? Heavy new supply typically softens prices + rents 12–24 months out; constrained supply supports both.
Investment metrics
- 1% rule
- 4.24% ✓
- Cap rate
- 19.36%
- Cash-on-cash
- 46.69%
- DSCR
- 3.08
- GRM
- 2.0
CMA / ARV
No comps found within radius.
Projected returns pro-forma
-3.0% appreciation · 3.0% rent growth · sell at horizon
- IRR
- 44.5%
- Equity multiple
- 2.94×
- Total profit
- $28,186
- Equity at exit
- $7,753
- IRR
- 50.6%
- Equity multiple
- 6.03×
- Total profit
- $73,171
- Equity at exit
- $4,496
Cash invested: $14,560 (down + closing). Projections, not guarantees.
Landlord ↔ Tenant lean methodology
- Overall (STATE)
- 41 Moderately Tenant-Leaning
- State Maine
- 41 Moderately Tenant-Leaning · D+2
- County
- — inherits STATE
- City
- — inherits STATE
ZIP-level market 04090
- Home prices YoY
- -20.0%
- Active inventory
- 267
- Price-to-rent
- 2.0×
Monthly cashflow live
- Estimated rent
- $2,205 medium interval (Pro) →
- Mortgage (P&I)
- −$273
- Tax from tax record
- −$39 /mo · $466/yr
- Insurance
- −$22
- HOA
- −$842
- Vacancy / Maint / Mgmt
- −$463
- Net cashflow
- $566
Break-even live
UW: 25.0% down · 7.5% · 30yr · 1.5% tax · 5.0% vac · 8.0% maint · 8.0% mgmt
Financing live
Cash to close
- Down payment
- $13,000
- Closing costs
- $1,560
- Reserves months
- —
- Total cash needed
- —
Loan-product check · same deal, 3 products live
Conventional
25% down · 7.5% · 30yr
- Down + closing
- —
- Monthly P&I
- —
- Monthly cashflow
- —
- DSCR
- —
- Eligible?
- —
Personal DTI + credit; lowest rate.
DSCR
20% down · 8.5% · 30yr
- Down + closing
- —
- Monthly P&I
- —
- Monthly cashflow
- —
- DSCR
- —
- Eligible?
- —
No personal income docs; deal must DSCR.
Hard money
10% down · 12.0% · 12mo
- Down + closing
- —
- Monthly P&I
- —
- Monthly cashflow
- —
- DSCR
- —
- Eligible?
- —
Short-term bridge; refi at stabilization.
HOA detail
- Monthly dues
- $842 · $10,104/yr
- Likely covers
- gaspoolsecurity
Listing history 22 events
-
2026-06-18days on market $52,000 Active 22 DOM
-
2026-06-17days on market $52,000 Active 21 DOM
-
2026-06-16days on market $52,000 Active 20 DOM
-
2026-06-15days on market $52,000 Active 19 DOM
-
2026-06-14days on market $52,000 Active 17 DOM
-
2026-06-13days on market $52,000 Active 16 DOM
-
2026-06-10days on market $52,000 Active 14 DOM
-
2026-06-09days on market $52,000 Active 13 DOM
-
2026-06-08days on market $52,000 Active 12 DOM
-
2026-06-07days on market $52,000 Active 11 DOM
-
2026-06-05days on market $52,000 Active 8 DOM
-
2026-06-03days on market $52,000 Active 7 DOM
-
2026-06-02days on market $52,000 Active 6 DOM
-
2026-06-01days on market $52,000 Active 5 DOM
-
2026-05-31days on market $52,000 Active 4 DOM
-
2026-05-30days on market $52,000 Active 3 DOM
-
2026-05-27$52,000 Active
-
2025-11-03historical
-
2025-10-01$43,900 Active
-
2019-08-06historical
-
2019-07-14price $59,000
-
2019-06-14$67,000 Active
ⓘ Source: listings_history table (triggers on properties + properties_extension) + one-shot
backfill from property_details.listing_events for pre-trigger history.
Tax reassessment forecast ME · Partial reset (capped growth)
- Current annual tax
- $466 · $39/mo
- Projected year-2 tax
- $587 · $49/mo
- Expected delta
- +$121/yr (+$10/mo · 25.9%)
ⓘ Screening estimate from a state-policy table — verify with the county assessor before closing.
Nearby sold comps map
Loading sold comps map…
Walkable amenities ~0.75 mi
Loading nearby amenities…
Taxation est. · year 1
- Rental income
- $26,455
- − Mortgage interest
- −$2,913
- − Property taxes
- −$466
- − Insurance
- −$260
- − Repairs & maintenance
- −$2,116
- − Management
- −$2,116
- − HOA
- −$10,104
- − Depreciation
- −$1,513
- Taxable income
- $6,967
- Est. tax owed @ 24.0%
- −$1,672
- After-tax cash flow
- $5,125/yr
For passive investors: Depreciation is non-cash, so a rental often shows a tax loss while cash-flowing — sheltering income. Rental losses are passive: they offset passive income freely, and up to $25,000/yr can offset ordinary (W-2) income if you actively participate and your MAGI is under $100k (phasing out to $0 by $150k); unused losses carry forward. On sale, claimed depreciation is recaptured at up to 25%, and gains may owe capital-gains tax (a 1031 exchange can defer both). Figures are a year-1 estimate at your 24.0% rate — not tax advice; consult a CPA.
Schools (NCES district)
- District
- Wells-Ogunquit CSD
- NCES district ID
- 2313490
- Math proficiency
- 87% ▲ 42.00%
- Reading proficiency
- 90% ▲ 26.00%
- Median HH income
- $61,341
- Composite
- 75.79/100
- National rank
- #125
- State rank
- #32 of 112 in ME
Livability — Wells
No livability data for this city. (Only ~50 U.S. cities are tracked.)
Census & demographics
- Population (ZIP)
- 11,544
Population outlook (York County) Hauer SSP2
- Today (2025)
- 209,961 people
- By 2030
- 212,816 · +1.4%
- By 2040
- 214,360 · +2.1%
- By 2050
- 210,350 · +0.2%
- By 2075
- 201,686 · -3.9%
- By 2100
- 183,392 · -12.7%
Race, ethnicity, and origin ACS 2023
- Neighborhood character
- Predominantly White (89%)
- Race & ethnicity
- White 89% Two or more races 5% Black 3% Asian 1%
- Common ancestry
- Lithuanian 11% Romanian 3% Slovak 3%
- Foreign-born
- 5% · Canada, China
- Languages at home
- 94% English-only · Other Indo-European 1% French/Haitian/Cajun 1% Other Asian/Pacific 1%
Political lean MEDSL · York
- 2024 margin
- D (+10.5) · D 54.3% · R 43.8% · Other 1.9%
- 2008→2024 swing
- -10.1pp toward R · 2008: 20.5pp · 2024: 10.5pp
- All cycles
- 2024: D+10.5 2020: D+12.6 2016: D+4.8 2012: D+16.4 2008: D+20.5
Not yet ingested
- Civics
- —
Market trends
- HPI YoY
- ▼ -103.52%
- Current HPI
- 413.9951
- Rent YoY
- —
- Metro
- —
- State GDP YoY
- —
- F500 in state
- 0
Price history
-22.4% since first listed6 events — show timeline
- 2026-05-27 Listed $52,000 MREIS
- 2025-11-03 Delisted — MREIS
- 2025-10-01 Listed $43,900 MREIS
- 2019-08-06 Delisted — MREIS
- 2019-07-14 Price Changed $59,000 MREIS
- 2019-06-14 Listed $67,000 MREIS
Property tax history
+7.9%/yrLatest (2025): $466 · +23.0% YoY. Source: county tax records.
Cash-flow waterfall
monthlySold comps — $/sqft
last 12 mo · ≤1 miLoading sold comps…