 Multi-family
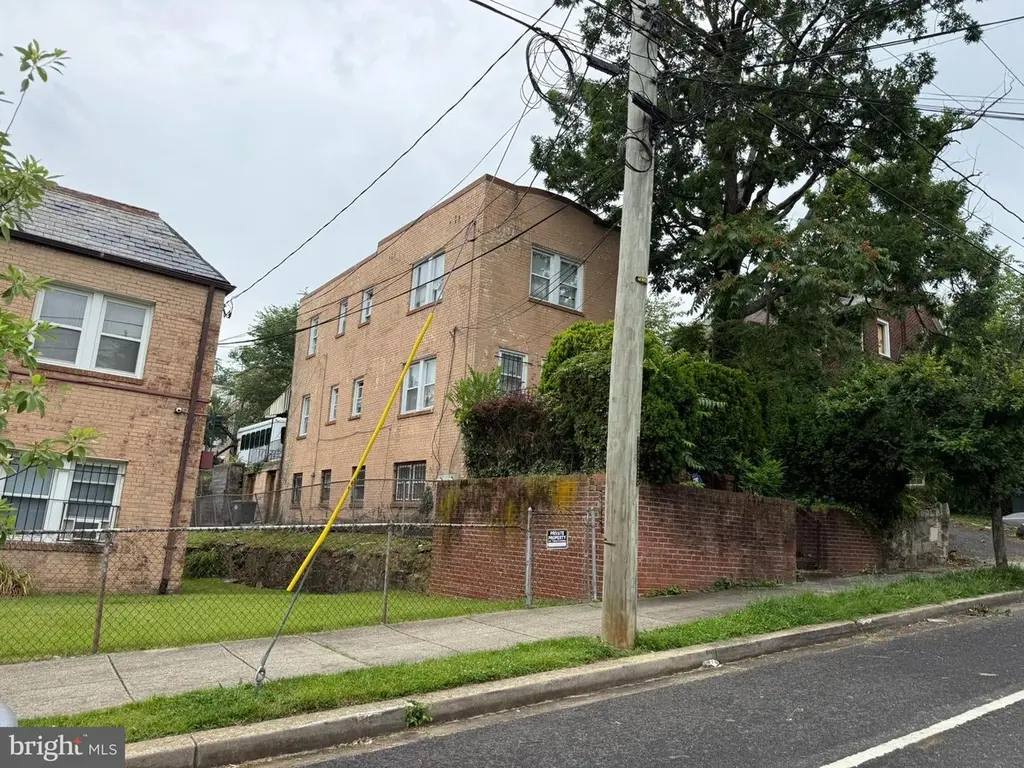
1622 28th Pl SE · Washington, DC
Flood risk 1/10 · Minimal
- FEMA flood zone
- X (unshaded)
- Chance of flooding over 30 yrs
- 0.0%
- Est. flood insurance / yr
- $473 – $860
Fire risk 1/10 · Minimal
- Est. fire insurance / yr
- $631 – $1,173
Heat risk 7/10 · Major
- Hot days now (above 104°F)
- 7 days/yr
- Hot days in 30 yrs
- 15 days/yr
Wind risk 4/10 · Minor
- Chance of severe wind over 30 yrs
- 21.0%
Air-quality risk 4/10 · Minor
- Unhealthy air days now
- 4 days/yr
- Unhealthy air days in 30 yrs
- 5 days/yr
Risk factors via First Street. Map © Google.
Why this score? — see what drove the B- grade
The composite is a weighted blend of 9 inputs, each scored 0–100. Each bar is that input's sub-score; the figure is the points it added to the 100-point composite (weight × sub-score).
- Cash flow +21.9/30.0
- ARV discount +15.0/15.0
- 1% rule +8.3/10.0
- DSCR +7.0/10.0
- Livability +3.7/5.0
- Schools +3.6/10.0
- Rent growth +3.5/5.0
- Condition / age +2.5/5.0
- Appreciation +0.0/10.0
$290,000
🖨 Deal sheet 📄 Offer letter ✓ Due diligence
Multi-family units
County records classify this as Multi-Family (2-4 Unit). Listing-text estimate: 1 unit. estimate disagrees with records
Listing remarks
A true “diamond in the rough”, 1622 28th Street, SE is a freestanding, detached home in the Hillcrest neighborhood. Located on a quiet, one-way street, the property sits perched above the street and has a driveway with parking in the rear. The property is zoned RF-1 and has a separately contained lower level unit. The property is basically a shell, allowing for design creativity.
Key facts
- 2,376 sq ft lot
- Built 1939
- Listed 18 days
Property features AI
Finance
- Financial info: Fee simple ownership
Exterior
- Parking: Off-street parking
- Utilities: Public water; Public sewer; Electric service (standard)
- Home design: Detached property; Above-grade finished living area reported by assessor
- Construction: Brick construction; Brick/mortar foundation; Above-grade and below-grade structures
- Exterior features: No tidal water
Interior
- Heating & cooling: Hot water heating; Central air conditioning
- Interior features: Basement with outside entrance; Two or more access exits
Neighborhood map
What this means for you Summary
Snapshot
- This is a 4-bed/3.0-bath multifamily listed at $290k.
Deal economics
- At list price, monthly cash flow is $457 ($5k/yr) — positive.
- The deal already cash-flows at list — no discount required.
- Meets the 1% rule at list price ($4k rent vs $290k).
- Recommended offer: $286k (1.5% below list) — sets the bar for market timing.
- Cap rate 8.2% vs local median 2.5% in Washington — top-decile yield for the area; either an underpriced asset or a hidden risk that comps aren't pricing in. Stress-test before assuming the spread holds.
Location & tenants
- Location reads 73/100 on livability (#1 in DC) — a middle-class / working-renter tenant base. Strengths: amenities A+, commute A+, employment A+; Watch: crime F, cost of living F.
- District Of Columbia Public Schools (urban): math 33% / reading 40% proficiency, ranked #8 of 32 in DC (top 25%) — families likely to look elsewhere, expect single-tenant / working-renter base with shorter leases; 65% free/reduced lunch — lower-income household profile, screen leases tightly.
- Market conditions: Rents rising (+3.9%/yr); 296 active listings in the ZIP; 40 comparable units currently listed for rent nearby; rentals at typical pace (median 25d on market — plan ~3-4 weeks tenant-placement turnaround); 1,737 units permitted in District of Columbia in 2024 (1,506 in 5+ unit buildings).
- At $3,854/mo this rent would consume 86% of the median local household income ($54k/yr) (locally 5148% of renters already pay >50% of income on rent) — very limited rent-growth headroom before tenants either downsize or default.
Forward outlook
- Local home prices are declining (-3.0%/yr); year-one equity from $2k of loan paydown is wiped out by about $9k of value loss. Plan a longer hold.
- District of Columbia County population projected at +50% by 2050 — long-run rental-demand tailwind backs the buy-and-hold thesis.
Negotiation context
- It's been on market 19 days — a 2% lower offer ($286k) is reasonable based on typical stale-listing flexibility.
- 4 sale attempts since 31y ago; this cycle's ask is 115% above the opening price — seller raised mid-cycle; expect resistance to lowballs.
- Current owner paid $140k; list at $290k implies a 107% gain — meaningful room to come down on a strong offer.
Risks & watch-outs
- Watch-outs: property tax is 3.9% of price; built in 1939 — expect roof / HVAC / electrical / plumbing capex.
- Climate carrying-cost: extreme-heat days projected 7→15/yr by 2055 (HVAC capex compounding) — expect insurance premiums to compound above CPI over the hold.
Questions for the listing agent
- Built in 1939 — when were the roof, HVAC, electrical panel, plumbing, and water heater last replaced?
- Property tax is high relative to price — has the assessment been appealed recently, and will the sale trigger a re-assessment?
- Is there a deadline driving the sale (1031 exchange, divorce, estate, relocation)? That informs how much negotiation room exists.
- Crime grade is F in this area — have there been break-ins, vandalism, or insurance claims at this property in the last 3 years? What carrier currently insures it and at what premium?
- What's the average days-on-market for RENTAL listings here right now (not sales)? A rising rental-DOM trend means longer vacancies and softer asking-rent achievability than the comps imply.
- What's the recent tenant-quality profile in this submarket — average credit score on applications, eviction rate, late-payment / NSF rate, and stable-employment percentage? A property-management company in the area should have these aggregated.
- How much new apartment / multifamily construction is in the pipeline within 1–3 miles? Heavy new supply (>2% of stock underway) typically softens rents 12–24 months out; light construction supports rent growth.
Investment metrics
- 1% rule
- 1.33% ✓
- Cap rate
- 8.18%
- Cash-on-cash
- 6.75%
- DSCR
- 1.30
- GRM
- 6.3
CMA / ARV
- ARV (on-the-fly)
- $412,608
- Comps found
- 1
Show comp detail 1 sale within ~0.75 mi
| Address | Dist | Beds/Ba | Sqft | Sold | Price | $/sf | Match |
|---|---|---|---|---|---|---|---|
| 2351 S S St SE | 0.34mi | 4/— | 1,512 (+12%) | 19mo | $464,000 | $307 | 48 |
Match score weights: distance 35% · size 25% · config 20% · recency 20%. Top-matched comps best support the ARV.
Projected returns pro-forma
-3.0% appreciation · 3.86% rent growth · sell at horizon
- IRR
- -4.6%
- Equity multiple
- 0.83×
- Total profit
- $-14,117
- Equity at exit
- $43,240
- IRR
- 6.4%
- Equity multiple
- 1.50×
- Total profit
- $40,910
- Equity at exit
- $25,074
Cash invested: $81,200 (down + closing). Projections, not guarantees.
Landlord ↔ Tenant lean methodology
- Overall (CITY)
- 0 Strongly Tenant-Friendly
- State District of Columbia
- 12 Strongly Tenant-Friendly · D+43
- County
- — inherits STATE
- City Washington
- 0 Strongly Tenant-Friendly · D+43
ZIP-level market 20020
- Rents YoY
- 3.9%
- Active inventory
- 296
- Price-to-rent
- 12.5×
Monthly cashflow live
- Estimated rent
- $3,854 high interval (Pro) →
- Mortgage (P&I)
- −$1,521
- Tax from tax record
- −$946 /mo · $11,355/yr
- Insurance
- −$121
- HOA
- −$0
- Vacancy / Maint / Mgmt
- −$809
- Net cashflow
- $457
Break-even live
2-unit breakdown (identical units grouped — click to expand)
| Units | Beds | Baths | Est. rent |
|---|---|---|---|
| 2× units | 3 | 1 | $3,854 |
| #1 | 3 | 1 | $1,927 |
| #2 | 3 | 1 | $1,927 |
| Total (2 units) | $3,854 | ||
UW: 25.0% down · 7.5% · 30yr · 1.5% tax · 5.0% vac · 8.0% maint · 8.0% mgmt
Financing live
Cash to close
- Down payment
- $72,500
- Closing costs
- $8,700
- Reserves months
- —
- Total cash needed
- —
Loan-product check · same deal, 3 products live
Conventional
25% down · 7.5% · 30yr
- Down + closing
- —
- Monthly P&I
- —
- Monthly cashflow
- —
- DSCR
- —
- Eligible?
- —
Personal DTI + credit; lowest rate.
DSCR
20% down · 8.5% · 30yr
- Down + closing
- —
- Monthly P&I
- —
- Monthly cashflow
- —
- DSCR
- —
- Eligible?
- —
No personal income docs; deal must DSCR.
Hard money
10% down · 12.0% · 12mo
- Down + closing
- —
- Monthly P&I
- —
- Monthly cashflow
- —
- DSCR
- —
- Eligible?
- —
Short-term bridge; refi at stabilization.
Rent comps 40 comps
| Address | Beds | Baths | Sqft | Rent | $/sqft | DOM | Units | Dist |
|---|---|---|---|---|---|---|---|---|
| 1616 27th St SE Unit 6 Washington, DC | 3.0 | 1.0 | 1100 | $2,850 | $2.59 | 24d | 1 | 0.09mi |
| 1525 28th St SE Unit 302 Washington, DC | 3.0 | 1.0 | 900 | $2,100 | $2.33 | 24d | 1 | 0.10mi |
| 2925-2929 Pennsylvania Ave SE Unit 204 Washington, DC | 3.0 | 1.0 | 980 | $3,000 | $3.06 | 4d | 1 | 0.11mi |
| 2925-2929 Pennsylvania Ave SE Unit 106 Washington, DC | 4.0 | 1.0 | 988 | $4,200 | $4.25 | 24d | 1 | 0.11mi |
| 2925-2929 Pennsylvania Ave SE Unit 106 Washington, DC | 4.0 | 1.0 | 980 | $4,200 | $4.29 | 4d | 1 | 0.11mi |
| 1800 28th Pl SE #201 Washington, DC | 3.0 | 2.0 | 1132 | $2,800 | $2.47 | 3d | 1 | 0.12mi |
| 2215 Minnesota Ave SE Unit 18 Washington, DC | 4.0 | 2.0 | 990 | $4,500 | $4.55 | 24d | 1 | 0.40mi |
| 1938 S St SE Washington, DC | 3.0 | 2.0 | 1522 | $2,999 | $1.97 | 24d | 1 | 0.48mi |
| 3128 Lyndale Pl SE Washington, DC | 3.0 | 2.0 | 1552 | $2,800 | $1.80 | 18d | 1 | 0.55mi |
| 2003 Fairlawn Ave SE Washington, DC | 4.0 | 2.0 | 1500 | $5,800 | $3.87 | 3d | 1 | 0.59mi |
| 1953 19th Pl SE Apt 104 Washington, DC | 3.0 | 1.0 | 980 | $2,800 | $2.86 | 5d | 1 | 0.67mi |
| 1953 19th Pl SE Apt 301 Washington, DC | 3.0 | 1.0 | 980 | $5,301 | $5.41 | 24d | 1 | 0.67mi |
| 1634 Ridge Pl SE Washington, DC | 3.0 | 3.5 | 1248 | $3,200 | $2.56 | 24d | 1 | 0.76mi |
| 1705 W St SE Washington, DC | 4.0 | 2.0 | 1550 | $2,500 | $1.61 | 3d | 1 | 0.87mi |
| 1750 Galen St SE Washington, DC | 3.0 | 3.0 | 1138 | $2,300 | $2.02 | 4d | 1 | 0.89mi |
| 1516 Marion Barry Ave SE Unit 301 Washington, DC | 3.0 | 2.0 | 1100 | $1,795 | $1.63 | 7d | 1 | 0.91mi |
| 2612 33rd St SE Washington, DC | 3.0 | 3.0 | 1826 | $3,529 | $1.93 | 24d | 1 | 0.92mi |
| 1802 14th St SE Washington, DC | 3.0 | 2.0 | 1800 | $2,800 | $1.56 | 24d | 1 | 0.98mi |
| 6 Barney Cir SE Washington, DC | 3.0 | 1.0 | 1200 | $2,550 | $2.12 | 11d | 1 | 1.00mi |
| 1430 V St SE Washington, DC | 3.0 | 2.0 | 1680 | $3,100 | $1.85 | 24d | 1 | 1.00mi |
| 1335 T St SE Washington, DC | 5.0 | 2.0 | 1200 | $7,000 | $5.83 | 24d | 1 | 1.02mi |
| 816 Kentucky Ave SE Washington, DC | 4.0 | 3.0 | 1800 | $4,850 | $2.69 | 3d | 1 | 1.03mi |
| 2847 Gainesville St SE Unit 303 Washington, DC | 3.0 | 1.0 | 902 | $2,400 | $2.66 | 24d | 1 | 1.04mi |
| 821 Kentucky Ave SE Washington, DC | 4.0 | 2.5 | 1520 | $3,900 | $2.57 | 3d | 1 | 1.05mi |
| 1805 Potomac Ave SE Washington, DC | 3.0 | 1.5 | 1598 | $4,000 | $2.50 | 24d | 1 | 1.08mi |
| 2412 18th St SE Washington, DC | 5.0 | 2.0 | 1584 | $3,300 | $2.08 | 24d | 1 | 1.11mi |
| 2412 18th St SE Washington, DC | 5.0 | 2.0 | 1584 | $3,500 | $2.21 | 24d | 1 | 1.11mi |
| 2227 14th St SE Washington, DC | 3.0 | 1.0 | 1222 | $2,495 | $2.04 | 24d | 1 | 1.13mi |
| 1815 Frankford St SE Washington, DC | 5.0 | 3.5 | 1572 | $6,100 | $3.88 | 24d | 1 | 1.16mi |
| 1633 Morris Rd SE Washington, DC | 5.0 | 2.0 | 1500 | $6,600 | $4.40 | 24d | 2 | 1.17mi |
| 3600 Ely Pl SE Washington, DC | 1.0–3.0 | 1.0 | 719 | $2,578 | $3.58 | 3d | 10 | 1.18mi |
| 1214 U St SE Washington, DC | 3.0 | 2.5 | 1350 | $3,375 | $2.50 | 24d | 1 | 1.18mi |
| 3928 Stone Gate Dr Unit D Suitland, MD | 3.0 | 1.5 | 1031 | $1,700 | $1.65 | 18d | 1 | 1.18mi |
| 1401 Pennsylvania Ave SE Washington, DC | 3.0 | 1.0–2.0 | 710 | $5,250 | $7.39 | 2d | 8 | 1.19mi |
| 1559 41st St SE Unit 1546448P Washington, DC | 4.0 | 2.0 | 1022 | $2,926 | $2.86 | 7d | 1 | 1.26mi |
| 1527 Morris Rd SE Washington, DC | 3.0 | 2.5 | 1508 | $2,700 | $1.79 | 7d | 1 | 1.28mi |
| 4113 Southern Ave SE Capitol Heights, MD | 3.0 | 1.0–1.5 | 816 | $1,950 | $2.39 | 1d | 45 | 1.29mi |
| 330 37th St SE Unit T2 Washington, DC | 4.0 | 2.0 | 1400 | $3,300 | $2.36 | 24d | 1 | 1.30mi |
| 3532 Minnesota Ave SE Unit 3 Washington, DC | 3.0 | 1.0 | 1100 | $2,500 | $2.27 | 24d | 1 | 1.33mi |
| 3009 Southern Ave SE Temple Hills, MD | 3.0 | 1.0 | 909 | $1,650 | $1.82 | 43d | 1 | 1.34mi |
Listing history 21 events
-
2026-06-09days on market $290,000 Coming Soon 19 DOM
-
2026-06-08days on market $290,000 Coming Soon 18 DOM
-
2026-06-07days on market $290,000 Coming Soon 17 DOM
-
2026-06-04days on market $290,000 Coming Soon 14 DOM
-
2026-06-03days on market $290,000 Coming Soon 13 DOM
-
2026-06-02days on market $290,000 Coming Soon 12 DOM
-
2026-06-01days on market $290,000 Coming Soon 11 DOM
-
2026-05-31days on market $290,000 Coming Soon 10 DOM
-
2026-05-21historical $290,000
-
2000-06-02soldstatus $140,000
-
2000-05-30soldstatus $140,000
-
2000-05-30soldstatus $140,000
-
2000-03-08historical
-
2000-03-08historical
-
2000-02-09$135,000
-
1999-05-10$135,000
-
1996-07-05historical
-
1996-04-05
-
1996-03-07historical
-
1995-07-07
-
1978-03-10soldstatus $27,000
ⓘ Source: listings_history table (triggers on properties + properties_extension) + one-shot
backfill from property_details.listing_events for pre-trigger history.
Tax reassessment forecast DC · Partial reset (capped growth)
- Current annual tax
- $11,355 · $946/mo
- Projected year-2 tax
- $11,355 · $946/mo
- Expected delta
- $0/yr ($0/mo · 0.0%)
ⓘ Screening estimate from a state-policy table — verify with the county assessor before closing.
Climate risk First Street
- Flood 1/10 Low FEMA zone X (unshaded) · 0% chance over 30 yrs
- Wildfire 1/10 Low
- Heat 7/10 Severe 7 d/yr ≥104°F today · 15 d/yr by 30 yrs out
- Wind 4/10 Moderate 21% chance of damaging wind over 30 yrs
- Air quality 4/10 Moderate 4 unhealthy d/yr today · 5 by 30 yrs out
Nearby sold comps map
Loading sold comps map…
Walkable amenities ~0.75 mi
Loading nearby amenities…
Taxation est. · year 1
- Rental income
- $46,248
- − Mortgage interest
- −$16,245
- − Property taxes
- −$11,355
- − Insurance
- −$1,450
- − Repairs & maintenance
- −$3,700
- − Management
- −$3,700
- − Depreciation
- −$8,436
- Taxable income
- $1,363
- Est. tax owed @ 24.0%
- −$327
- After-tax cash flow
- $5,155/yr
For passive investors: Depreciation is non-cash, so a rental often shows a tax loss while cash-flowing — sheltering income. Rental losses are passive: they offset passive income freely, and up to $25,000/yr can offset ordinary (W-2) income if you actively participate and your MAGI is under $100k (phasing out to $0 by $150k); unused losses carry forward. On sale, claimed depreciation is recaptured at up to 25%, and gains may owe capital-gains tax (a 1031 exchange can defer both). Figures are a year-1 estimate at your 24.0% rate — not tax advice; consult a CPA.
Schools (NCES district)
- District
- District Of Columbia Public Schools
- NCES district ID
- 1100030
- Math proficiency
- 33% ▲ 3.00%
- Reading proficiency
- 40% ▲ 5.00%
- Median HH income
- $67,671
- Composite
- 35.84/100
- National rank
- #9606
- State rank
- #8 of 32 in DC
Livability — Washington
- Score
- 73/100
- State rank
- #1
- US rank
- #5327
Category grades
Schools grade is shown separately in the Schools card above.
Census & demographics
- Census place
- Washington, DC
- County
- District of Columbia · 671,873 people
- City population
- 671,873
- Metro
- Washington-Arlington-Alexandria, DC-VA-MD-WV
- Population (ZIP)
- 53,005
- Household income
- $54,032
- Rent vs Own
- Severe rent burden
- 5148.0
Population outlook (District of Columbia County) Hauer SSP2
- Today (2025)
- 821,926 people
- By 2030
- 899,517 · +9.4%
- By 2040
- 1,061,162 · +29.1%
- By 2050
- 1,231,493 · +49.8%
- By 2075
- 1,603,312 · +95.1%
- By 2100
- 1,847,141 · +124.7%
Race, ethnicity, and origin ACS 2023
- Neighborhood character
- Predominantly Black (90%)
- Race & ethnicity
- Black 90% Two or more races 3% Hispanic / Latino 3% White 3%
- Common ancestry
- Lithuanian 1%
- Foreign-born
- 3% · Canada
- Languages at home
- 95% English-only · Spanish 2% French/Haitian/Cajun 1%
Political lean MEDSL · District of Columbia
- 2024 margin
- Solid D (+86.1) · D 91.2% · R 5.1% · Other 3.8%
- 2008→2024 swing
- +0.1pp no change · 2008: 85.9pp · 2024: 86.1pp
- All cycles
- 2024: D+86.1 2020: D+86.8 2016: D+88.7 2012: D+84.2 2008: D+85.9
Not yet ingested
- Civics
- —
Market trends
- HPI YoY
- ▼ -415.44%
- Current HPI
- 306.5068
- Rent YoY
- ▲ 3.86%
- Metro
- Washington-Arlington-Alexandria, DC-VA-MD-WV
- State GDP YoY
- ▲ 1.33%
- F500 in state
- 6
Industry mix (Fortune 500 HQ in DC)
| Industry | F500 HQs | Revenue |
|---|---|---|
| Financial Services | 1 | $153B |
|
||
| Life Sciences / Industrials | 1 | $25B |
|
||
| Industrial Machinery | 1 | $8B |
|
||
Price history
+974.1% since first listed13 events — show timeline
- 2026-05-21 Coming Soon $290,000 BRIGHT MLS
- 2000-06-02 Sold (Public Records) $140,000 Public Records
- 2000-05-30 Sold (MLS) $140,000 MRIS
- 2000-05-30 Sold (MLS) $140,000 MRIS
- 2000-03-08 Delisted — MRIS
- 2000-03-08 Delisted — MRIS
- 2000-02-09 Listed $135,000 MRIS
- 1999-05-10 Listed $135,000 MRIS
- 1996-07-05 Delisted — MRIS
- 1996-04-05 Listed — MRIS
- 1996-03-07 Delisted — MRIS
- 1995-07-07 Listed — MRIS
- 1978-03-10 Sold (Public Records) $27,000 Public Records
Property tax history
+16.1%/yrLatest (2025): $11,355 · +249.7% YoY. Source: county tax records.
Cash-flow waterfall
monthlySold comps — $/sqft
last 12 mo · ≤1 miLoading sold comps…