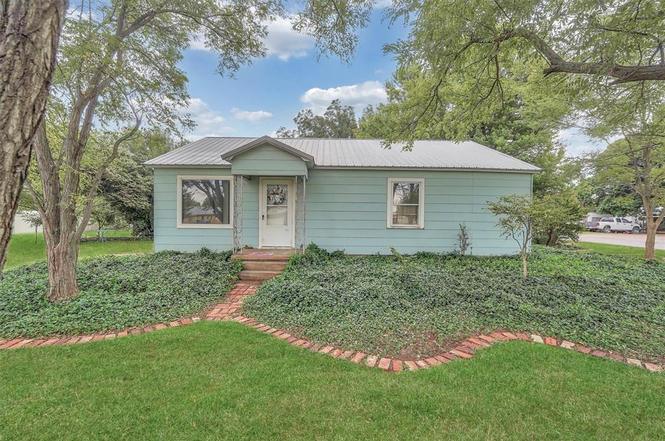
120 S Highland Dr · Erick, OK
Flood risk 1/10 · Minimal
- FEMA flood zone
- —
- Chance of flooding over 30 yrs
- 0.0%
- Est. flood insurance / yr
- —
Fire risk 3/10 · Minor
- Est. fire insurance / yr
- $2,463 – $4,575
Heat risk 6/10 · Moderate
- Hot days now (above threshold)
- 7 days/yr
- Hot days in 30 yrs
- 20 days/yr
Wind risk No data
- Chance of severe wind over 30 yrs
- —
Air-quality risk No data
- Unhealthy air days now
- —
- Unhealthy air days in 30 yrs
- —
Risk factors via First Street. Map © Google.
Why this score? — see what drove the A- grade
The composite is a weighted blend of 9 inputs, each scored 0–100. Each bar is that input's sub-score; the figure is the points it added to the 100-point composite (weight × sub-score).
- Cash flow +29.6/30.0
- ARV discount +15.0/15.0
- DSCR +10.0/10.0
- Appreciation +7.3/10.0
- 1% rule +7.0/10.0
- Schools +4.8/10.0
- Livability +3.2/5.0
- Rent growth +2.5/5.0
- Condition / age +2.5/5.0
$89,900
🖨 Deal sheet (PDF) 📄 Offer letter ✓ Due diligence
Listing remarks
Peaceful Country Living with Modern Comforts – 3 Bed, 2 Bath in Erick, OK Looking for space, comfort, and a touch of country charm? This 3-bedroom, 2-bath home in Erick, OK has it all! The home features generously sized bedrooms, plenty of cabinet storage in kitchen, and updated plumbing throughout. A sturdy metal roof offers low-maintenance peace of mind for years to come. Outside, you’ll love the large yard dotted with producing pecan, apricot, mulberry, peach, and nectarine trees—perfect for enjoying the seasons or starting your own mini orchard. There’s also two single car detached garages, an RV plug-in for added convivence and a storm shelter for peace of mind
Key facts
- Metal roof
- 0.49 acre lot
- 2 garage spots
Tags
Property features AI
Finance
- Other: Located in College Annex addition; Directions: US RTE 66 to Highland Dr
- Financial info: Sale offered As-Is; financing options include Cash and Conventional; Loan qualification: Yes
- HOA & community: No mandatory association dues
Exterior
- Parking: 2-car garage; Additional parking in backyard
- Security: Below-ground storm shelter
- Utilities: Water, sewer, and power: Not specified
- Home design: Single family residence; One-level property; Existing property; Homestead exempt (yes); Faces: Not specified
- Construction: Frame construction; Metal roof (replaced/installed 2015)
- Exterior features: Interior lot
Interior
- Kitchen: Gas oven
- Bedrooms: 3 bedrooms
- Bathrooms: 2 full bathrooms
- Heating & cooling: Electric heating; Cooling: Other
- Interior features: Electric fireplace (1); Covered porch
- Laundry & utility: Conventional foundation
Neighborhood map
What this means for you Summary
Snapshot
- This is a 3-bed/1.0-bath single-family listed at $90k.
Deal economics
- At list price, monthly cash flow is $323 ($4k/yr) — positive.
- The deal already cash-flows at list — no discount required.
- Meets the 1% rule at list price ($1k rent vs $90k).
- Recommended offer: $79k (12.0% below list) — sets the bar for market timing.
Location & tenants
- Location reads 63/100 on livability (#218 in OK) — a middle-class / working-renter tenant base. Strengths: cost of living A+, crime B+, housing B+; Watch: amenities F, commute F, employment F.
- Erick (rural): math 50% / reading 60% proficiency, ranked #19 of 513 in OK (top 4%) — acceptable for families but not a draw, mixed tenant base, ~2y average lease.
- Zoned schools: Erick Es (math 52% / reading 57%, grade C, #23 of 845 statewide, top 3%, 152 students, 0% FRL); Erick Hs (math 24% / reading 24%, grade F, #150 of 447 statewide, top 48%, 57 students, 0% FRL) — zoned schools average 0% FRL vs 44% district-wide (44 pts lower); this property's tenant base skews higher-income than the district average.
- Zoned-school proficiency averages 40% at this address vs 55% district-wide (-16 pts) — the specific schools serving this property underperform the Erick average; the district grade overstates school quality for this exact location.
- Market conditions: 19 active listings in the ZIP; 16 units permitted in Beckham County in 2024 (0 in 5+ unit buildings).
Forward outlook
- In year one you build about $5k of equity ($622 loan paydown + $4k appreciation (4.6% local appreciation)).
- Beckham County population projected at +35% by 2050 — long-run rental-demand tailwind backs the buy-and-hold thesis.
- At projected returns (4.6% appreciation + 3.0% rent growth), your $25k cash investment doubles in ~3 years — after that, you're playing with house money.
- By year 7, paydown + projected appreciation supports a ~$30k cash-out refi (75% LTV) — recoverable capital for the next deal without selling this one.
Negotiation context
- It's been on market 273 days — a 12% lower offer ($79k) is reasonable based on typical stale-listing flexibility.
- Current owner paid $35k; list at $90k implies a 157% gain — meaningful room to come down on a strong offer.
Risks & watch-outs
- Watch-outs: built in 1925 — expect roof / HVAC / electrical / plumbing capex.
- Climate carrying-cost: extreme-heat days projected 7→20/yr by 2055 (HVAC capex compounding) — expect insurance premiums to compound above CPI over the hold.
Questions for the listing agent
- It's been on market 273 days. Have you received any prior offers? Is the seller open to a 12% concession, seller financing, or rate buy-down credit?
- Built in 1925 — when were the roof, HVAC, electrical panel, plumbing, and water heater last replaced?
- Why hasn't it sold? Are there any deal-killer items the seller is aware of (foundation, flood, title, zoning, code violations)?
- Is there a deadline driving the sale (1031 exchange, divorce, estate, relocation)? That informs how much negotiation room exists.
- What's the average days-on-market for RENTAL listings here right now (not sales)? A rising rental-DOM trend means longer vacancies and softer asking-rent achievability than the comps imply.
- What's the recent tenant-quality profile in this submarket — average credit score on applications, eviction rate, late-payment / NSF rate, and stable-employment percentage? A property-management company in the area should have these aggregated.
- How much new for-sale + rental construction is in the pipeline within 1–3 miles? Heavy new supply typically softens prices + rents 12–24 months out; constrained supply supports both.
Investment metrics
- 1% rule
- 1.20% ✓
- Cap rate
- 10.61%
- Cash-on-cash
- 15.41%
- DSCR
- 1.69
- GRM
- 7.0
CMA / ARV
- ARV (on-the-fly)
- $126,540
- Comps found
- 1
Show comp detail 1 sale within ~0.75 mi
| Address | Dist | Beds/Ba | Sqft | Sold | Price | $/sf | Match |
|---|---|---|---|---|---|---|---|
| 311 N Walnut St | 0.52mi | 3/2.0 | 1,160 (-13%) | 21mo | $110,000 | $95 | 33 |
Match score weights: distance 35% · size 25% · config 20% · recency 20%. Top-matched comps best support the ARV.
Projected returns pro-forma
4.57% appreciation · 3.0% rent growth · sell at horizon
- IRR
- 25.3%
- Equity multiple
- 2.55×
- Total profit
- $39,094
- Equity at exit
- $48,633
- IRR
- 24.7%
- Equity multiple
- 5.03×
- Total profit
- $101,400
- Equity at exit
- $82,081
Cash invested: $25,172 (down + closing). Projections, not guarantees.
Landlord ↔ Tenant lean methodology
- Overall (STATE)
- 83 Strongly Landlord-Friendly
- State Oklahoma
- 83 Strongly Landlord-Friendly · R+20
- County
- — inherits STATE
- City
- — inherits STATE
ZIP-level market 73645
- Home prices YoY
- 4.4%
- Active inventory
- 19
- Price-to-rent
- 7.0×
Monthly cashflow live
- Estimated rent
- $1,077 medium interval (Pro) →
- Mortgage (P&I)
- −$471
- Tax from tax record
- −$19 /mo · $224/yr
- Insurance
- −$37
- HOA
- −$0
- Vacancy / Maint / Mgmt
- −$226
- Net cashflow
- $323
Break-even live
Sensitivity live
| Price | -10% $374 | -5% $349 | +0% $323 | +5% $298 | +10% $272 |
|---|---|---|---|---|---|
| Rent | -10% $238 | -5% $281 | +0% $323 | +5% $366 | +10% $408 |
| Rate | -1.0pp $369 | -0.5pp $346 | base $323 | +0.5pp $300 | +1.0pp $276 |
UW: 25.0% down · 7.5% · 30yr · 1.5% tax · 5.0% vac · 8.0% maint · 8.0% mgmt
Financing live
Cash to close
- Down payment
- $22,475
- Closing costs
- $2,697
- Reserves months
- —
- Total cash needed
- —
Loan-product check · same deal, 3 products live
Conventional
25% down · 7.5% · 30yr
- Down + closing
- —
- Monthly P&I
- —
- Monthly cashflow
- —
- DSCR
- —
- Eligible?
- —
Personal DTI + credit; lowest rate.
DSCR
20% down · 8.5% · 30yr
- Down + closing
- —
- Monthly P&I
- —
- Monthly cashflow
- —
- DSCR
- —
- Eligible?
- —
No personal income docs; deal must DSCR.
Hard money
10% down · 12.0% · 12mo
- Down + closing
- —
- Monthly P&I
- —
- Monthly cashflow
- —
- DSCR
- —
- Eligible?
- —
Short-term bridge; refi at stabilization.
Listing history 20 events
-
2026-06-21days on market $89,900 Active 273 DOM
-
2026-06-18days on market $89,900 Active 271 DOM
-
2026-06-17days on market $89,900 Active 270 DOM
-
2026-06-16days on market $89,900 Active 269 DOM
-
2026-06-15days on market $89,900 Active 268 DOM
-
2026-06-13days on market $89,900 Active 266 DOM
-
2026-06-12days on market $89,900 Active 265 DOM
-
2026-06-09days on market $89,900 Active 262 DOM
-
2026-06-08days on market $89,900 Active 261 DOM
-
2026-06-08days on market $89,900 Active 260 DOM
-
2026-06-07days on market $89,900 Active 259 DOM
-
2026-06-04days on market $89,900 Active 256 DOM
-
2026-06-02days on market $89,900 Active 255 DOM
-
2026-06-01days on market $89,900 Active 254 DOM
-
2026-05-31days on market $89,900 Active 253 DOM
-
2026-05-18status Pending
-
2026-04-12price $89,900
-
2026-03-07price $109,900
-
2025-09-09$119,900 Active
-
2002-10-23soldstatus $35,000
ⓘ Source: listings_history table (triggers on properties + properties_extension) + one-shot
backfill from property_details.listing_events for pre-trigger history.
Tax reassessment forecast OK · Resets to sale price
- Current annual tax
- $224 · $19/mo
- Projected year-2 tax
- $809 · $67/mo
- Expected delta
- +$585/yr (+$49/mo · 261.2%)
ⓘ Screening estimate from a state-policy table — verify with the county assessor before closing.
Climate risk First Street
- Flood 1/10 Low 0% chance over 30 yrs
- Wildfire 3/10 Moderate
- Heat 6/10 Major
Nearby sold comps map
Loading sold comps map…
Walkable amenities ~0.75 mi
Loading nearby amenities…
Taxation est. · year 1
- Rental income
- $12,924
- − Mortgage interest
- −$5,036
- − Property taxes
- −$224
- − Insurance
- −$450
- − Repairs & maintenance
- −$1,034
- − Management
- −$1,034
- − Depreciation
- −$2,615
- Taxable income
- $2,532
- Est. tax owed @ 24.0%
- −$608
- After-tax cash flow
- $3,272/yr
For passive investors: Depreciation is non-cash, so a rental often shows a tax loss while cash-flowing — sheltering income. Rental losses are passive: they offset passive income freely, and up to $25,000/yr can offset ordinary (W-2) income if you actively participate and your MAGI is under $100k (phasing out to $0 by $150k); unused losses carry forward. On sale, claimed depreciation is recaptured at up to 25%, and gains may owe capital-gains tax (a 1031 exchange can defer both). Figures are a year-1 estimate at your 24.0% rate — not tax advice; consult a CPA.
Schools (NCES district)
- District
- Erick
- NCES district ID
- 4011040
- Math proficiency
- 50% ▲ 5.00%
- Reading proficiency
- 60% ▲ 5.00%
- Median HH income
- $39,189
- Composite
- 47.69/100
- National rank
- #4918
- State rank
- #19 of 513 in OK
Livability — Erick
- Score
- 63/100
- State rank
- #218
- US rank
- #15619
Category grades
Schools grade is shown separately in the Schools card above.
Census & demographics
- Census place
- Erick, OK
- Population (ZIP)
- 1,090
Population outlook (Beckham County) Hauer SSP2
- Today (2025)
- 26,564 people
- By 2030
- 28,217 · +6.2%
- By 2040
- 31,865 · +20.0%
- By 2050
- 35,862 · +35.0%
- By 2075
- 47,189 · +77.6%
- By 2100
- 55,622 · +109.4%
Race, ethnicity, and origin ACS 2023
- Neighborhood character
- Predominantly White (77%)
- Race & ethnicity
- White 77% Hispanic / Latino 12% Two or more races 10% Native American 1%
- Hispanic origin (detail)
- Mexican 12%
- Common ancestry
- Italian 5% Lithuanian 3% Slovak 1%
- Languages at home
- 96% English-only · Spanish 3%
Political lean MEDSL · Beckham
- 2024 margin
- Solid R (+70.1) · D 14.2% · R 84.3% · Other 1.4%
- 2008→2024 swing
- -14.0pp toward R · 2008: -56.1pp · 2024: -70.1pp
- All cycles
- 2024: R+70.1 2020: R+72.0 2016: R+70.8 2012: R+59.1 2008: R+56.1
Not yet ingested
- Civics
- —
Market trends
- HPI YoY
- ▲ 4.57%
- Current HPI
- 108.667
- Rent YoY
- —
- Metro
- —
- State GDP YoY
- ▲ 1.55%
- F500 in state
- 6
Industry mix (Fortune 500 HQ in OK)
| Industry | F500 HQs | Revenue |
|---|---|---|
| Energy | 3 | $48B |
|
||
Price history
+156.9% since first listed5 events — show timeline
- 2026-05-18 Pending — MLSOK
- 2026-04-12 Price Changed $89,900 MLSOK
- 2026-03-07 Price Changed $109,900 MLSOK
- 2025-09-09 Listed $119,900 MLSOK
- 2002-10-23 Sold (Public Records) $35,000 Public Records
Property tax history
+4.2%/yrLatest (2025): $224 · +3.7% YoY. Source: county tax records.
Cash-flow waterfall
monthlySold comps — $/sqft
last 12 mo · ≤1 miLoading sold comps…