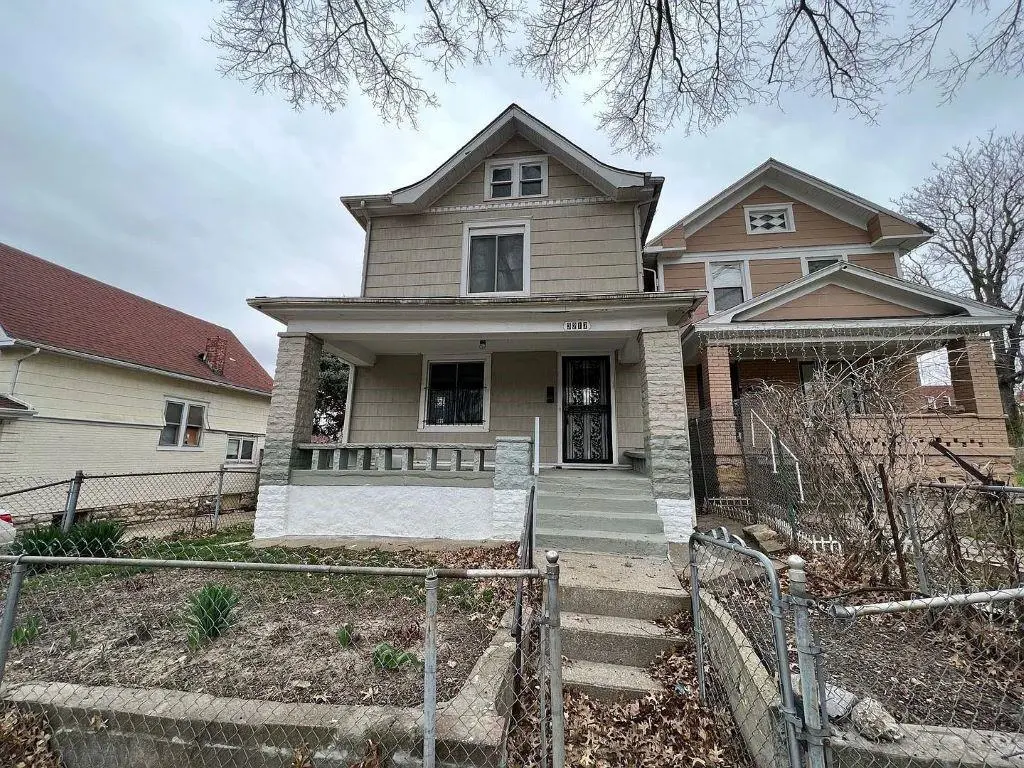
3217 Thompson Ave · Kansas City, MO
Flood risk 1/10 · Minimal
- FEMA flood zone
- X (unshaded)
- Chance of flooding over 30 yrs
- 0.0%
- Est. flood insurance / yr
- $473 – $860
Fire risk 3/10 · Minor
- Est. fire insurance / yr
- $1,054 – $1,958
Heat risk 4/10 · Minor
- Hot days now (above 106°F)
- 7 days/yr
- Hot days in 30 yrs
- 17 days/yr
Wind risk 2/10 · Minimal
- Chance of severe wind over 30 yrs
- —
Air-quality risk 3/10 · Minor
- Unhealthy air days now
- 2 days/yr
- Unhealthy air days in 30 yrs
- 3 days/yr
Risk factors via First Street. Map © Google.
Why this score? — see what drove the C+ grade
The composite is a weighted blend of 9 inputs, each scored 0–100. Each bar is that input's sub-score; the figure is the points it added to the 100-point composite (weight × sub-score).
- Cash flow +24.1/30.0
- ARV discount +15.0/15.0
- DSCR +7.8/10.0
- 1% rule +5.4/10.0
- Livability +3.9/5.0
- Rent growth +3.1/5.0
- Condition / age +2.5/5.0
- Schools +1.5/10.0
- Appreciation +0.0/10.0
$135,000
🖨 Deal sheet (PDF) 📄 Offer letter ✓ Due diligence
Listing remarks
An Incredible Value Opportunity! Stop renting and start building equity in this charming two-story gem, perfectly positioned for the first-time buyer. Combining historic character with modern convenience, this home features wood flooring and luxury vinyl plank throughout. The updated kitchen and stylishly renovated bathrooms provide a touch of luxury at an unbeatable price point. Spacious living areas and oversized bedrooms offer plenty of room to grow or work from home. Nestled in a desirable historic neighborhood, you’ll enjoy tree-lined charm just minutes from modern amenities. Offered at an exceptional value as the seller pivots to their next project, this home is a prime candidat
Key facts
- Wood flooring
- Oversized bedrooms
- Renovated bathrooms
Tags
Property features AI
Finance
- HOA & community: No association fees
Exterior
- Parking: Off-street parking
- Utilities: City/public water (verify); Public sewer
- Home design: Single-family residence; Residential property; 2-story floor plan; Approximately 1,408 square feet above grade
- Construction: Frame construction; Composition roof
- Exterior features: Deck; Porch; Metal and wood fencing; City lot
Interior
- Kitchen: Gas range; Cedar closet in kitchen area; Vinyl flooring in kitchen
- Bedrooms: 3 bedrooms total; One bedroom on the main level; Two bedrooms on the second level
- Flooring: Wood floors in several rooms; Ceramic flooring; Vinyl flooring
- Bathrooms: One full bathroom; One half bathroom; Second-level bathroom with shower over tub
- Heating & cooling: Natural gas forced air heating; Electric cooling (has central cooling)
- Interior features: Ceiling fans throughout; Stained cabinets; Storm doors; Partial storm windows and thermal windows
- Laundry & utility: Laundry located in the basement
Neighborhood map
What this means for you Summary
Snapshot
- This is a 3-bed/1.0-bath single-family listed at $135k.
Deal economics
- At list price, monthly cash flow is $267 ($3k/yr) — positive.
- The deal already cash-flows at list — no discount required.
- Meets the 1% rule at list price ($1k rent vs $135k).
- Recommended offer: $131k (3.0% below list) — sets the bar for market timing.
- Cap rate 8.7% vs local median 3.9% in Kansas City — top-decile yield for the area; either an underpriced asset or a hidden risk that comps aren't pricing in. Stress-test before assuming the spread holds.
Location & tenants
- Location reads 78/100 on livability (#28 in MO, #2,671 nationally) — a middle-class / working-renter tenant base. Strengths: amenities A+, commute A+, cost of living A+; Watch: crime F.
- Kansas City 33 (urban): math 12% / reading 24% proficiency, ranked #308 of 324 in MO (top 95%) — low school quality limits family demand, transient renter base, plan for 1-2y turnover; 75% free/reduced lunch — lower-income household profile, screen leases tightly.
- Zoned schools: Garfield Elementary (math 9% / reading 14%, grade F, #1,022 of 1,115 statewide, top 92%, 649 students, 100% FRL); Northeast Middle School (math 4% / reading 9%, grade F, #384 of 391 statewide, top 98%, 555 students, 100% FRL); Northeast High (math 2% / reading 22%, grade F, #497 of 521 statewide, top 96%, 657 students, 100% FRL) — zoned schools average 100% FRL vs 75% district-wide (24 pts higher); higher-poverty schools than district average — tighter screening recommended.
- Market conditions: Rents rising (+2.2%/yr); 53 active listings in the ZIP; 33 comparable units currently listed for rent nearby; rentals at typical pace (median 24d on market — plan ~3-4 weeks tenant-placement turnaround); 4,002 units permitted in Jackson County in 2024 (2,271 in 5+ unit buildings).
- This rent runs 37% of the median local income ($46k/yr) — at the standard rent-burdened threshold; future hikes will face affordability resistance.
Forward outlook
- Local home prices are declining (-3.0%/yr); year-one equity from $933 of loan paydown is wiped out by about $4k of value loss. Plan a longer hold.
- Jackson County population projected at +4% by 2050 — modest demand growth; plan on rents tracking national, not racing it.
Negotiation context
- It's been on market 35 days — a 3% lower offer ($131k) is reasonable based on typical stale-listing flexibility.
- 6 sale attempts since 4y ago; this cycle's ask has dropped $15k (10%) from the opening price — seller is motivated, your offer sets the floor, not the list.
Risks & watch-outs
- Watch-outs: built in 1888 — expect roof / HVAC / electrical / plumbing capex.
Questions for the listing agent
- It's been on market 35 days. Have you received any prior offers? Is the seller open to a 3% concession, seller financing, or rate buy-down credit?
- Built in 1888 — when were the roof, HVAC, electrical panel, plumbing, and water heater last replaced?
- Is there a deadline driving the sale (1031 exchange, divorce, estate, relocation)? That informs how much negotiation room exists.
- Crime grade is F in this area — have there been break-ins, vandalism, or insurance claims at this property in the last 3 years? What carrier currently insures it and at what premium?
- What's the average days-on-market for RENTAL listings here right now (not sales)? A rising rental-DOM trend means longer vacancies and softer asking-rent achievability than the comps imply.
- What's the recent tenant-quality profile in this submarket — average credit score on applications, eviction rate, late-payment / NSF rate, and stable-employment percentage? A property-management company in the area should have these aggregated.
- How much new for-sale + rental construction is in the pipeline within 1–3 miles? Heavy new supply typically softens prices + rents 12–24 months out; constrained supply supports both.
Investment metrics
- 1% rule
- 1.04% ✓
- Cap rate
- 8.66%
- Cash-on-cash
- 8.47%
- DSCR
- 1.38
- GRM
- 8.0
CMA / ARV
- ARV (median comp)
- $181,344
- List price
- $135,000
- Delta
- -25.56%
- Verdict
- UNDERPRICED
- Comps
- 20 within 1.0 mi
Show comp detail 12 sales within ~0.75 mi
| Address | Dist | Beds/Ba | Sqft | Sold | Price | $/sf | Match |
|---|---|---|---|---|---|---|---|
| 3621 Lexington St | 0.36mi | 3/1.5 | 1,395 (-1%) | 6mo | $165,000 | $118 | 75 |
| 3521 Lexington Ave | 0.30mi | 3/1.0 | 1,552 (+10%) | 2mo | $140,000 | $90 | 68 |
| 3430 E 6th St | 0.25mi | 2/2.0 (-1) | 1,558 (+11%) | 3mo | $75,000 | $48 | 59 |
| 2211 Amie St | 0.61mi | 3/1.0 | 1,344 (-4%) | 6mo | $122,000 | $91 | 58 |
| 402 Kensington Ave | 0.70mi | 3/2.0 | 1,376 (-2%) | 3mo | $75,000 | $55 | 58 |
| 3830 Roberts St | 0.40mi | 4/2.0 (+1) | 1,320 (-6%) | 6mo | $70,000 | $53 | 57 |
| 421 Prospect Ave | 0.38mi | 3/2.0 | 1,215 (-14%) | 5mo | $199,000 | $164 | 51 |
| 2116 Elma St | 0.68mi | 3/2.5 | 1,494 (+6%) | 2mo | $250,000 | $167 | 50 |
| 404 N Gladstone Blvd | 0.72mi | 3/1.5 | 1,512 (+7%) | 3mo | $260,000 | $172 | 49 |
| 2121 Elma St | 0.67mi | 3/2.0 | 1,296 (-8%) | 5mo | $220,000 | $170 | 47 |
| 2612 E 10th St | 0.55mi | 4/2.0 (+1) | 1,572 (+12%) | 3mo | $170,000 | $108 | 44 |
| 410 Kensington Ave | 0.69mi | 4/2.0 (+1) | 1,240 (-12%) | 5mo | $159,000 | $128 | 35 |
Match score weights: distance 35% · size 25% · config 20% · recency 20%. Top-matched comps best support the ARV.
Projected returns pro-forma
-3.0% appreciation · 2.2% rent growth · sell at horizon
- IRR
- -4.3%
- Equity multiple
- 0.84×
- Total profit
- $-6,048
- Equity at exit
- $20,129
- IRR
- 4.5%
- Equity multiple
- 1.32×
- Total profit
- $11,933
- Equity at exit
- $11,672
Cash invested: $37,800 (down + closing). Projections, not guarantees.
Landlord ↔ Tenant lean methodology
- Overall (STATE)
- 81 Strongly Landlord-Friendly
- State Missouri
- 81 Strongly Landlord-Friendly · R+10
- County
- — inherits STATE
- City
- — inherits STATE
ZIP-level market 64124
- Home prices YoY
- -26.0%
- Rents YoY
- 2.2%
- Active inventory
- 53
- Price-to-rent
- 8.0×
Monthly cashflow live
- Estimated rent
- $1,407 high interval (Pro) →
- Mortgage (P&I)
- −$708
- Tax from tax record
- −$81 /mo · $970/yr
- Insurance
- −$56
- HOA
- −$0
- Vacancy / Maint / Mgmt
- −$296
- Net cashflow
- $267
Break-even live
Sensitivity live
| Price | -10% $343 | -5% $305 | +0% $267 | +5% $228 | +10% $190 |
|---|---|---|---|---|---|
| Rent | -10% $156 | -5% $211 | +0% $267 | +5% $322 | +10% $378 |
| Rate | -1.0pp $335 | -0.5pp $301 | base $267 | +0.5pp $232 | +1.0pp $196 |
UW: 25.0% down · 7.5% · 30yr · 1.5% tax · 5.0% vac · 8.0% maint · 8.0% mgmt
Financing live
Cash to close
- Down payment
- $33,750
- Closing costs
- $4,050
- Reserves months
- —
- Total cash needed
- —
Loan-product check · same deal, 3 products live
Conventional
25% down · 7.5% · 30yr
- Down + closing
- —
- Monthly P&I
- —
- Monthly cashflow
- —
- DSCR
- —
- Eligible?
- —
Personal DTI + credit; lowest rate.
DSCR
20% down · 8.5% · 30yr
- Down + closing
- —
- Monthly P&I
- —
- Monthly cashflow
- —
- DSCR
- —
- Eligible?
- —
No personal income docs; deal must DSCR.
Hard money
10% down · 12.0% · 12mo
- Down + closing
- —
- Monthly P&I
- —
- Monthly cashflow
- —
- DSCR
- —
- Eligible?
- —
Short-term bridge; refi at stabilization.
Rent comps 33 comps
| Address | Beds | Baths | Sqft | Rent | $/sqft | DOM | Units | Dist |
|---|---|---|---|---|---|---|---|---|
| 504 Bellefontaine Ave Unit 2 Kansas City, MO | 2.0 | 2.0 | 1500 | $1,300 | $0.87 | 45d | 1 | 0.17mi |
| 3510 Garner Ave Kansas City, MO | 3.0 | 2.0 | 1536 | $1,400 | $0.91 | 5d | 1 | 0.23mi |
| 311 Bellefontaine Ave Kansas City, MO | 3.0 | 2.0 | 1360 | $2,200 | $1.62 | 45d | 1 | 0.24mi |
| 412 Montgall Ave Unit 412 Kansas City, MO | 2.0 | 2.0 | 900 | $1,200 | $1.33 | 45d | 1 | 0.31mi |
| 3429 Morrell Ave Kansas City, MO | 4.0 | 1.5 | 1800 | $1,650 | $0.92 | 9d | 1 | 0.34mi |
| 3435 E 7th St Kansas City, MO | 2.0 | 1.0 | 970 | $949 | $0.98 | 9d | 1 | 0.34mi |
| 414 Prospect Ave Unit 1 Kansas City, MO | 2.0 | 1.0 | 900 | $1,295 | $1.44 | 9d | 1 | 0.39mi |
| 901 Benton Blvd Unit 7 Kansas City, MO | 2.0 | 1.0 | 1100 | $1,202 | $1.09 | 45d | 1 | 0.41mi |
| 3523 Saint John Ave Kansas City, MO | 3.0 | 1.0 | 1500 | $995 | $0.66 | 25d | 1 | 0.43mi |
| 916 Bellefontaine Ave Kansas City, MO | 3.0 | 1.5 | 1399 | $1,650 | $1.18 | 18d | 1 | 0.45mi |
| 2834 E 10th St Kansas City, MO | 2.0 | 1.5 | 1020 | $1,250 | $1.23 | 45d | 1 | 0.48mi |
| 2826 E 10th St Kansas City, MO | 2.0 | 1.5 | 1020 | $1,250 | $1.23 | 45d | 1 | 0.49mi |
| 2702 Peery Ave Unit 3E Kansas City, MO | 2.0 | 1.0 | 1000 | $895 | $0.90 | 0d | 1 | 0.65mi |
| 220 Brooklyn Ave Kansas City, MO | 2.0 | 1.0 | 1000 | $1,295 | $1.29 | 9d | 1 | 0.68mi |
| 220 Brooklyn Ave Unit 220-2 Kansas City, MO | 2.0 | 1.0 | 1000 | $1,295 | $1.29 | 22d | 1 | 0.68mi |
| 129 Brooklyn Ave Kansas City, MO | 2.0 | 1.0 | 1225 | $1,195 | $0.98 | 12d | 1 | 0.68mi |
| 105 Brooklyn Ave Kansas City, MO | 3.0 | 1.5 | 1152 | $1,250 | $1.09 | 6d | 1 | 0.71mi |
| 3921 Norledge Ave Unit 2E Kansas City, MO | 2.0 | 1.0 | 900 | $950 | $1.06 | 45d | 1 | 0.73mi |
| 1233 Benton Blvd Kansas City, MO | 4.0 | 2.5 | 1500 | $2,500 | $1.67 | 45d | 1 | 0.73mi |
| 347 Maple Blvd Kansas City, MO | 3.0 | 1.5 | 1300 | $1,473 | $1.13 | 0d | 1 | 0.77mi |
| 347 Maple Blvd Kansas City, MO | 3.0 | 1.5 | 1246 | $1,350 | $1.08 | 25d | 1 | 0.77mi |
| 612 Garfield Ave Kansas City, MO | 1.0–2.0 | 1.0–2.0 | 900 | $1,875 | $2.08 | 3d | 44 | 0.82mi |
| 4405 Norledge Ave Kansas City, MO | 3.0 | 1.0 | 1510 | $1,600 | $1.06 | 45d | 1 | 0.93mi |
| 815 Elmwood Ave Kansas City, MO | 3.0 | 1.5 | 1302 | $1,600 | $1.23 | 16d | 1 | 0.95mi |
| 218 N Elmwood Ave Kansas City, MO | 4.0 | 2.0 | 1184 | $1,500 | $1.27 | 45d | 1 | 0.97mi |
| 3305 E 19th St Kansas City, MO | 2.0 | 1.0 | 1500 | $1,200 | $0.80 | 45d | 1 | 1.27mi |
| 1603 Elmwood Ave Kansas City, MO | 2.0 | 1.0 | 1064 | $1,006 | $0.95 | 0d | 1 | 1.36mi |
| 5213 Wilburn Ct Kansas City, MO | 3.0 | 1.0 | 1274 | $1,375 | $1.08 | 23d | 1 | 1.38mi |
| 1805 Jackson Ave Kansas City, MO | 4.0 | 2.0 | 1250 | $1,250 | $1.00 | 45d | 1 | 1.38mi |
| 3201 E 20th St Kansas City, MO | 2.0 | 1.0 | 900 | $1,050 | $1.17 | 25d | 1 | 1.39mi |
| 2003 Wabash Ave Unit B Kansas City, MO | 3.0 | 2.0 | 1200 | $1,095 | $0.91 | 25d | 1 | 1.47mi |
| 2900 E 21st St Kansas City, MO | 3.0 | 1.5 | 897 | $1,650 | $1.84 | 18d | 1 | 1.48mi |
| 1812 Elmwood Ave Kansas City, MO | 3.0 | 1.0 | 1650 | $1,600 | $0.97 | 18d | 1 | 1.50mi |
Listing history 37 events
-
2026-06-19status $135,000 Pending 35 DOM
-
2026-06-18days on market $135,000 Active 35 DOM
-
2026-06-17days on market $135,000 Active 34 DOM
-
2026-06-16days on market $135,000 Active 33 DOM
-
2026-06-16price $135,000 Active 32 DOM
-
2026-06-15days on market $150,000 Active 32 DOM
-
2026-06-13days on market $150,000 Active 30 DOM
-
2026-06-09days on market $150,000 Active 26 DOM
-
2026-06-08days on market $150,000 Active 25 DOM
-
2026-06-07days on market $150,000 Active 24 DOM
-
2026-06-05days on market $150,000 Active 21 DOM
-
2026-06-03days on market $150,000 Active 20 DOM
-
2026-06-02days on market $150,000 Active 19 DOM
-
2026-06-01days on market $150,000 Active 18 DOM
-
2026-05-31days on market $150,000 Active 17 DOM
-
2026-05-14$150,000 Active 855-char remark
-
2025-10-08historical
-
2025-09-03price $127,500
-
2025-08-15status Active
-
2025-08-07status Pending
-
2025-06-03$135,000 Active
-
2024-10-24historical $1,300
-
2024-09-05price $1,300
-
2024-07-27$1,325
-
2024-07-27historical
-
2024-06-23price $165,000
-
2024-06-15price $179,900
-
2024-05-31$189,900 Active
-
2023-01-17soldstatus
-
2023-01-06soldstatus
-
2022-11-22historical
-
2022-10-25price $125,600
-
2022-10-03price $139,500
-
2022-10-01price $143,000
-
2022-09-15price $154,900
-
2022-08-25$159,900 Active
-
1989-12-29soldstatus
ⓘ Source: listings_history table (triggers on properties + properties_extension) + one-shot
backfill from property_details.listing_events for pre-trigger history.
Tax reassessment forecast MO · Resets to sale price
- Current annual tax
- $970 · $81/mo
- Projected year-2 tax
- $1,310 · $109/mo
- Expected delta
- +$340/yr (+$28/mo · 35.1%)
ⓘ Screening estimate from a state-policy table — verify with the county assessor before closing.
Climate risk First Street
- Flood 1/10 Low FEMA zone X (unshaded) · 0% chance over 30 yrs
- Wildfire 3/10 Moderate
- Heat 4/10 Moderate 7 d/yr ≥106°F today · 17 d/yr by 30 yrs out
- Wind 2/10 Low
- Air quality 3/10 Moderate 2 unhealthy d/yr today · 3 by 30 yrs out
Nearby sold comps map
Loading sold comps map…
Walkable amenities ~0.75 mi
Loading nearby amenities…
Taxation est. · year 1
- Rental income
- $16,886
- − Mortgage interest
- −$7,562
- − Property taxes
- −$970
- − Insurance
- −$675
- − Repairs & maintenance
- −$1,351
- − Management
- −$1,351
- − Depreciation
- −$3,927
- Taxable income
- $1,051
- Est. tax owed @ 24.0%
- −$252
- After-tax cash flow
- $2,948/yr
For passive investors: Depreciation is non-cash, so a rental often shows a tax loss while cash-flowing — sheltering income. Rental losses are passive: they offset passive income freely, and up to $25,000/yr can offset ordinary (W-2) income if you actively participate and your MAGI is under $100k (phasing out to $0 by $150k); unused losses carry forward. On sale, claimed depreciation is recaptured at up to 25%, and gains may owe capital-gains tax (a 1031 exchange can defer both). Figures are a year-1 estimate at your 24.0% rate — not tax advice; consult a CPA.
Schools (NCES district)
- District
- Kansas City 33
- NCES district ID
- 2916400
- Math proficiency
- 12% ▼ -8.00%
- Reading proficiency
- 24% ▬ 0.00%
- Median HH income
- $35,227
- Composite
- 14.8/100
- National rank
- #9387
- State rank
- #308 of 324 in MO
Livability — Kansas City
- Score
- 78/100
- State rank
- #28
- US rank
- #2671
Category grades
Schools grade is shown separately in the Schools card above.
Census & demographics
- Census place
- Kansas City, MO
- County
- Jackson County · 687,798 people
- City population
- 439,467
- Metro
- Kansas City, MO-KS
- Population (ZIP)
- 10,925
- Household income
- $46,241
- Rent vs Own
- Severe rent burden
- 541.0
Population outlook (Jackson County) Hauer SSP2
- Today (2025)
- 719,589 people
- By 2030
- 731,456 · +1.6%
- By 2040
- 746,689 · +3.8%
- By 2050
- 749,289 · +4.1%
- By 2075
- 736,227 · +2.3%
- By 2100
- 668,210 · -7.1%
Race, ethnicity, and origin ACS 2023
- Neighborhood character
- Diverse neighborhood (Simpson 0.68)
- Race & ethnicity
- Hispanic / Latino 43% White 30% Black 20% Two or more races 10% Asian 4% Native American 2%
- Hispanic origin (detail)
- Mexican 30% Cuban 1%
- Common ancestry
- Italian 2% Hispanic 1% Serbian 1%
- Foreign-born
- 32% · Canada, Vietnam
- Languages at home
- 52% English-only · Spanish 35% Vietnamese 2% Arabic 2%
Political lean MEDSL · Jackson
- 2024 margin
- D (+19.3) · D 58.9% · R 39.5% · Other 1.6%
- 2008→2024 swing
- -6.1pp toward R · 2008: 25.4pp · 2024: 19.3pp
- All cycles
- 2024: D+19.3 2020: D+22.0 2016: D+16.6 2012: D+19.0 2008: D+25.4
Not yet ingested
- Civics
- —
Market trends
- HPI YoY
- ▼ -125.95%
- Current HPI
- 358.4244
- Rent YoY
- ▲ 2.20%
- Metro
- Kansas City, MO-KS
- State GDP YoY
- ▲ 1.84%
- F500 in state
- 20
Industry mix (Fortune 500 HQ in MO)
| Industry | F500 HQs | Revenue |
|---|---|---|
| Healthcare | 1 | $163B |
|
||
| Insurance | 1 | $21B |
|
||
| Industrial Technology | 1 | $17B |
|
||
| Retail | 1 | $16B |
|
||
| Industrial Distribution | 1 | $10B |
|
||
| Utilities | 1 | $9B |
|
||
Price history
-15.6% since first listed23 events — show timeline
- 2026-06-16 Price Changed $135,000 Heartland MLS as Distributed by MLS Grid
- 2026-05-14 Listed $150,000 Heartland MLS as Distributed by MLS Grid
- 2025-10-08 Listing Removed — Heartland MLS as Distributed by MLS Grid
- 2025-09-03 Price Changed $127,500 Heartland MLS as Distributed by MLS Grid
- 2025-08-15 Relisted — Heartland MLS as Distributed by MLS Grid
- 2025-08-07 Pending — Heartland MLS as Distributed by MLS Grid
- 2025-06-03 Listed $135,000 Heartland MLS as Distributed by MLS Grid
- 2024-10-24 Rental Removed $1,300 HMLS
- 2024-09-05 Price Changed $1,300 HMLS
- 2024-07-27 Listed for Rent $1,325 HMLS
- 2024-07-27 Listing Removed — Heartland MLS as Distributed by MLS Grid
- 2024-06-23 Price Changed $165,000 Heartland MLS as Distributed by MLS Grid
- 2024-06-15 Price Changed $179,900 Heartland MLS as Distributed by MLS Grid
- 2024-05-31 Listed $189,900 Heartland MLS as Distributed by MLS Grid
- 2023-01-17 Sold (Public Records) — Public Records
- 2023-01-06 Sold (Public Records) — Public Records
- 2022-11-22 Listing Removed — Heartland MLS as Distributed by MLS Grid
- 2022-10-25 Price Changed $125,600 Heartland MLS as Distributed by MLS Grid
- 2022-10-03 Price Changed $139,500 Heartland MLS as Distributed by MLS Grid
- 2022-10-01 Price Changed $143,000 Heartland MLS as Distributed by MLS Grid
- 2022-09-15 Price Changed $154,900 Heartland MLS as Distributed by MLS Grid
- 2022-08-25 Listed $159,900 Heartland MLS as Distributed by MLS Grid
- 1989-12-29 Sold (Public Records) — Public Records
Property tax history
+8.7%/yrLatest (2025): $970 · -41.1% YoY. Source: county tax records.
Cash-flow waterfall
monthlySold comps — $/sqft
last 12 mo · ≤1 miLoading sold comps…