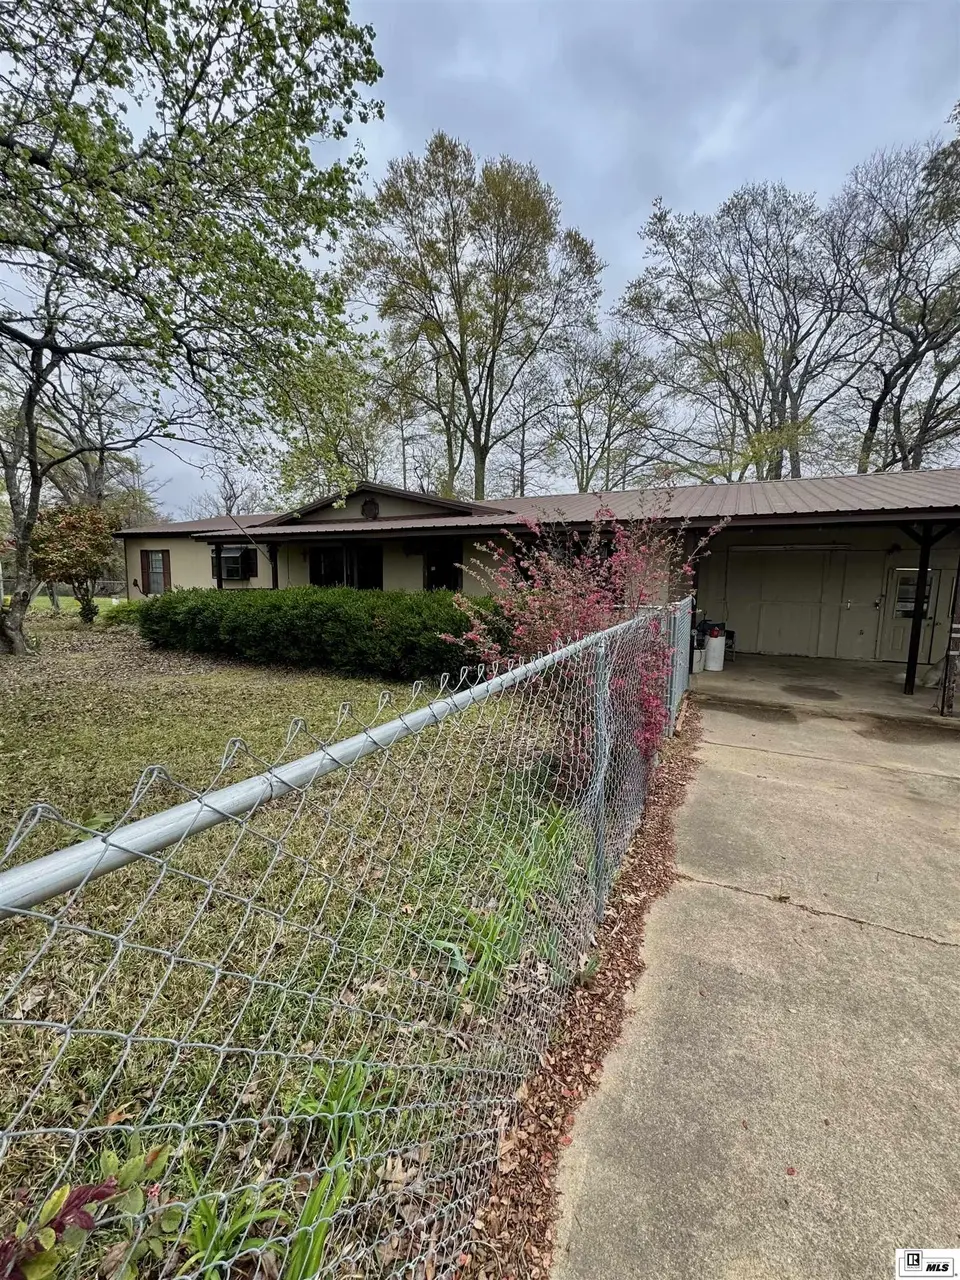
9850 Toledo Rd · Mer Rouge, LA
Flood risk 1/10 · Minimal
- FEMA flood zone
- X
- Chance of flooding over 30 yrs
- 0.0%
- Est. flood insurance / yr
- $507 – $1,088
Fire risk 2/10 · Minimal
- Est. fire insurance / yr
- $1,269 – $2,357
Heat risk 7/10 · Major
- Hot days now (above 110°F)
- 7 days/yr
- Hot days in 30 yrs
- 21 days/yr
Wind risk 7/10 · Major
- Chance of severe wind over 30 yrs
- 78.0%
Air-quality risk 1/10 · Minimal
- Unhealthy air days now
- 0 days/yr
- Unhealthy air days in 30 yrs
- 0 days/yr
Risk factors via First Street. Map © Google.
Why this score? — see what drove the B- grade
The composite is a weighted blend of 9 inputs, each scored 0–100. Each bar is that input's sub-score; the figure is the points it added to the 100-point composite (weight × sub-score).
- Cash flow +26.8/30.0
- DSCR +9.2/10.0
- ARV discount +7.5/15.0
- 1% rule +6.5/10.0
- Appreciation +6.3/10.0
- Livability +2.9/5.0
- Rent growth +2.5/5.0
- Condition / age +2.5/5.0
- Schools +1.1/10.0
$99,000
🖨 Deal sheet 📄 Offer letter ✓ Due diligence
Listing remarks MLS
3 bedroom, 2 bath manufactured home on Bayou Bonne Idee featuring an open living area and a spacious primary bathroom. Exterior highlights include a screened porch, private pier, carport with exterior storage. Well-suited for a weekend retreat or fishing camp!
Key facts
- 1,742 sq ft lot
- Garage
- Listed 37 days
Neighborhood map
What this means for you Summary
Snapshot
- This is a 3-bed/2.0-bath manufactured listed at $99k.
Deal economics
- At list price, monthly cash flow is $271 ($3k/yr) — positive.
- The deal already cash-flows at list — no discount required.
- Meets the 1% rule at list price ($1k rent vs $99k).
- Recommended offer: $96k (3.0% below list) — sets the bar for market timing.
Location & tenants
- Location reads 57/100 on livability (#325 in LA) — a working-class tenant base; expect higher turnover. Strengths: cost of living A+, housing A; Watch: schools D, health & safety D, crime F.
- Morehouse Parish (town): math 10% / reading 19% proficiency, ranked #83 of 98 in LA (top 85%) — low school quality limits family demand, transient renter base, plan for 1-2y turnover; 78% free/reduced lunch — lower-income household profile, screen leases tightly.
- Market conditions: 10 active listings in the ZIP; 11 units permitted in Morehouse Parish in 2024 (0 in 5+ unit buildings).
Forward outlook
- In year one you build about $3k of equity ($684 loan paydown + $3k appreciation (2.7% local appreciation)).
- Morehouse County population projected at -29% by 2050 — secular population decline; favor cash flow + early exit over multi-decade hold.
- At projected returns (2.7% appreciation + 3.0% rent growth), your $28k cash investment doubles in ~4 years — after that, you're playing with house money.
- By year 10, paydown + projected appreciation supports a ~$32k cash-out refi (75% LTV) — recoverable capital for the next deal without selling this one.
Negotiation context
- It's been on market 37 days — a 3% lower offer ($96k) is reasonable based on typical stale-listing flexibility.
- 2 sale attempts since 13y ago with the ask held roughly flat each time — persistent listings suggest the price (not the market) is what's stuck; bring a comps-based counter.
- Current owner paid $70k; 41% above their basis — modest negotiation headroom, anchor on the comps not their cost.
Risks & watch-outs
- Climate carrying-cost: major wind risk, 78% chance of damaging wind over 30y; extreme-heat days projected 7→21/yr by 2055 (HVAC capex compounding) — expect insurance premiums to compound above CPI over the hold.
Questions for the listing agent
- It's been on market 37 days. Have you received any prior offers? Is the seller open to a 3% concession, seller financing, or rate buy-down credit?
- Is there a deadline driving the sale (1031 exchange, divorce, estate, relocation)? That informs how much negotiation room exists.
- Schools are D-rated, which usually means shorter tenancies and higher turnover. Who's the typical renter profile here, and what's been the actual vacancy rate?
- Crime grade is F in this area — have there been break-ins, vandalism, or insurance claims at this property in the last 3 years? What carrier currently insures it and at what premium?
- What's the average days-on-market for RENTAL listings here right now (not sales)? A rising rental-DOM trend means longer vacancies and softer asking-rent achievability than the comps imply.
- What's the recent tenant-quality profile in this submarket — average credit score on applications, eviction rate, late-payment / NSF rate, and stable-employment percentage? A property-management company in the area should have these aggregated.
- How much new for-sale + rental construction is in the pipeline within 1–3 miles? Heavy new supply typically softens prices + rents 12–24 months out; constrained supply supports both.
Investment metrics
- 1% rule
- 1.15% ✓
- Cap rate
- 9.58%
- Cash-on-cash
- 11.75%
- DSCR
- 1.52
- GRM
- 7.2
CMA / ARV
No comps found within radius.
Projected returns pro-forma
2.68% appreciation · 3.0% rent growth · sell at horizon
- IRR
- 17.7%
- Equity multiple
- 1.99×
- Total profit
- $27,508
- Equity at exit
- $42,719
- IRR
- 19.4%
- Equity multiple
- 3.74×
- Total profit
- $75,820
- Equity at exit
- $64,472
Cash invested: $27,720 (down + closing). Projections, not guarantees.
Landlord ↔ Tenant lean methodology
- Overall (STATE)
- 90 Strongly Landlord-Friendly
- State Louisiana
- 90 Strongly Landlord-Friendly · R+12
- County
- — inherits STATE
- City
- — inherits STATE
ZIP-level market 71261
- Home prices YoY
- 3.3%
- Active inventory
- 10
- Price-to-rent
- 7.2×
Monthly cashflow live
- Estimated rent
- $1,141 medium interval (Pro) →
- Mortgage (P&I)
- −$519
- Tax from tax record
- −$70 /mo · $835/yr
- Insurance
- −$41
- HOA
- −$0
- Vacancy / Maint / Mgmt
- −$240
- Net cashflow
- $271
Break-even live
UW: 25.0% down · 7.5% · 30yr · 1.5% tax · 5.0% vac · 8.0% maint · 8.0% mgmt
Financing live
Cash to close
- Down payment
- $24,750
- Closing costs
- $2,970
- Reserves months
- —
- Total cash needed
- —
Loan-product check · same deal, 3 products live
Conventional
25% down · 7.5% · 30yr
- Down + closing
- —
- Monthly P&I
- —
- Monthly cashflow
- —
- DSCR
- —
- Eligible?
- —
Personal DTI + credit; lowest rate.
DSCR
20% down · 8.5% · 30yr
- Down + closing
- —
- Monthly P&I
- —
- Monthly cashflow
- —
- DSCR
- —
- Eligible?
- —
No personal income docs; deal must DSCR.
Hard money
10% down · 12.0% · 12mo
- Down + closing
- —
- Monthly P&I
- —
- Monthly cashflow
- —
- DSCR
- —
- Eligible?
- —
Short-term bridge; refi at stabilization.
Listing history 5 events
-
2026-04-15$99,000 Active 260-char remark
Show marketing remark (260 chars)
3 bedroom, 2 bath manufactured home on Bayou Bonne Idee featuring an open living area and a spacious primary bathroom. Exterior highlights include a screened porch, private pier, carport with exterior storage. Well-suited for a weekend retreat or fishing camp!
-
2015-02-20soldstatus $70,000
-
2013-08-26$79,000
-
2012-01-05soldstatus $77,000
-
2008-03-05soldstatus
ⓘ Source: listings_history table (triggers on properties + properties_extension) + one-shot
backfill from property_details.listing_events for pre-trigger history.
Tax reassessment forecast LA · Resets to sale price
- Current annual tax
- $835 · $70/mo
- Projected year-2 tax
- $835 · $70/mo
- Expected delta
- $0/yr ($0/mo · 0.0%)
ⓘ Screening estimate from a state-policy table — verify with the county assessor before closing.
Climate risk First Street
- Flood 1/10 Low FEMA zone X · 0% chance over 30 yrs
- Wildfire 2/10 Low
- Heat 7/10 Severe 7 d/yr ≥110°F today · 21 d/yr by 30 yrs out
- Wind 7/10 Severe 78% chance of damaging wind over 30 yrs
- Air quality 1/10 Low 0 unhealthy d/yr today · 0 by 30 yrs out
Nearby sold comps map
Loading sold comps map…
Walkable amenities ~0.75 mi
Loading nearby amenities…
Taxation est. · year 1
- Rental income
- $13,692
- − Mortgage interest
- −$5,546
- − Property taxes
- −$835
- − Insurance
- −$495
- − Repairs & maintenance
- −$1,095
- − Management
- −$1,095
- − Depreciation
- −$2,880
- Taxable income
- $1,746
- Est. tax owed @ 24.0%
- −$419
- After-tax cash flow
- $2,838/yr
For passive investors: Depreciation is non-cash, so a rental often shows a tax loss while cash-flowing — sheltering income. Rental losses are passive: they offset passive income freely, and up to $25,000/yr can offset ordinary (W-2) income if you actively participate and your MAGI is under $100k (phasing out to $0 by $150k); unused losses carry forward. On sale, claimed depreciation is recaptured at up to 25%, and gains may owe capital-gains tax (a 1031 exchange can defer both). Figures are a year-1 estimate at your 24.0% rate — not tax advice; consult a CPA.
Schools (NCES district)
- District
- Morehouse Parish
- NCES district ID
- 2201110
- Math proficiency
- 10% ▼ -29.00%
- Reading proficiency
- 19% ▼ -29.00%
- Median HH income
- $30,482
- Composite
- 11.46/100
- National rank
- #9704
- State rank
- #83 of 98 in LA
Livability — Mer Rouge
- Score
- 57/100
- State rank
- #325
- US rank
- #22049
Category grades
Schools grade is shown separately in the Schools card above.
Census & demographics
- Population (ZIP)
- 1,429
Population outlook (Morehouse County) Hauer SSP2
- Today (2025)
- 23,631 people
- By 2030
- 22,114 · -6.4%
- By 2040
- 19,203 · -18.7%
- By 2050
- 16,698 · -29.3%
- By 2075
- 11,998 · -49.2%
- By 2100
- 8,622 · -63.5%
Race, ethnicity, and origin ACS 2023
- Neighborhood character
- Majority White (59%)
- Race & ethnicity
- White 59% Black 40% Two or more races 1%
- Common ancestry
- Slovak 4% Italian 2%
Political lean MEDSL · Morehouse
- 2024 margin
- R (+19.4) · D 39.7% · R 59.0% · Other 1.3%
- 2008→2024 swing
- -8.3pp toward R · 2008: -11.1pp · 2024: -19.4pp
- All cycles
- 2024: R+19.4 2020: R+13.5 2016: R+11.4 2012: R+5.6 2008: R+11.1
Not yet ingested
- Civics
- —
Market trends
- HPI YoY
- ▲ 2.68%
- Current HPI
- 83.3317
- Rent YoY
- —
- Metro
- —
- State GDP YoY
- ▲ 3.29%
- F500 in state
- 10
Industry mix (Fortune 500 HQ in LA)
| Industry | F500 HQs | Revenue |
|---|---|---|
| Telecommunications | 2 | $23B |
|
||
| Utilities | 1 | $12B |
|
||
| Wholesale / Distribution | 1 | $5B |
|
||
| Advertising | 1 | $2B |
|
||
Price history
+28.6% since first listed5 events — show timeline
- 2026-04-15 Listed $99,000 NELABOR
- 2015-02-20 Sold (Public Records) $70,000 Public Records
- 2013-08-26 Listed $79,000 NELABOR
- 2012-01-05 Sold (Public Records) $77,000 Public Records
- 2008-03-05 Sold (Public Records) — Public Records
Property tax history
+0.9%/yrLatest (2024): $835 · +10.4% YoY. Source: county tax records.
Cash-flow waterfall
monthlySold comps — $/sqft
last 12 mo · ≤1 miLoading sold comps…