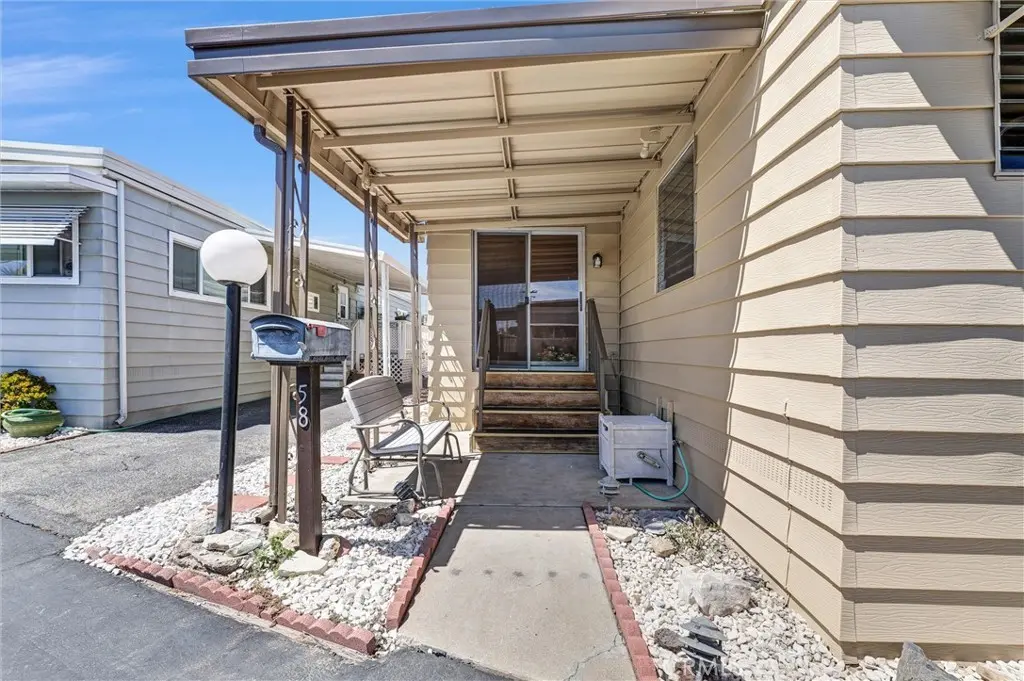
18801 Hawthorne Blvd #58 · Torrance, CA
Flood risk 1/10 · Minimal
- FEMA flood zone
- X (unshaded)
- Chance of flooding over 30 yrs
- 0.0%
- Est. flood insurance / yr
- $507 – $1,088
Fire risk 1/10 · Minimal
- Est. fire insurance / yr
- $659 – $1,223
Heat risk 4/10 · Minor
- Hot days now (above 85°F)
- 5 days/yr
- Hot days in 30 yrs
- 16 days/yr
Wind risk 1/10 · Minimal
- Chance of severe wind over 30 yrs
- —
Air-quality risk 4/10 · Minor
- Unhealthy air days now
- 5 days/yr
- Unhealthy air days in 30 yrs
- 6 days/yr
Risk factors via First Street. Map © Google.
Why this score? — see what drove the A- grade
The composite is a weighted blend of 9 inputs, each scored 0–100. Each bar is that input's sub-score; the figure is the points it added to the 100-point composite (weight × sub-score).
- Cash flow +30.0/30.0
- ARV discount +15.0/15.0
- 1% rule +10.0/10.0
- DSCR +10.0/10.0
- Schools +5.9/10.0
- Livability +3.8/5.0
- Condition / age +3.8/5.0
- Rent growth +3.1/5.0
- Appreciation +0.0/10.0
$99,000
🖨 Deal sheet 📄 Offer letter ✓ Due diligence
Listing remarks
Spacious single-wide 3 bedrooms, 1-bath mobile home with a bonus room that can be used as a 3rd bedroom. Located in the desirable 55+ South Bay Estates Park. This well-kept home offers an open layout that feels larger than expected, with comfortable living areas and great natural light throughout. The community was recently remodeled and features a well-maintained pool, updated gym, and clean common areas for residents to enjoy. Ideally situated just 3 miles from the beach and minutes from Del Amo Mall, you’ll have quick access to shopping, dining, and coastal recreation. South Bay Estates Park is known for its convenient location and well-managed amenities. A great opportunity to enj
Key facts
- Well-maintained pool
- Bonus room
- Clean common areas
Tags
Property features AI
Finance
- Other: Directions: Major cross-streets are W. 190th St and Hawthorne
- Financial info: Land lease of $2,150 per month (park-managed)
- HOA & community: Monthly association/land-lease fee; Located in a senior community; Community is urban in character; Park name: South Bay Estates Park; Manager approval required for occupancy; Pets allowed with breed restrictions
Exterior
- Parking: Attached carport with space for 2 vehicles
- Utilities: Public sewer; District/public water; Natural gas available; Electricity available
- Home design: Single (mobile) home; Model: Angelus; Mobile home remains on site; Single-story
- Construction: Mobile home width 10 ft and length 55 ft; Year built per public records
- Exterior features: Front porch; Community pool; Park nearby; One shed on the property
Interior
- Kitchen: Electric oven; Electric stove; Water heater unit
- Bedrooms: Primary bedroom on the main level; All bedrooms located on the lower/main level
- Flooring: Laminated flooring
- Bathrooms: One full bathroom with bathtub and shower-in-tub
- Interior features: One-level home with front entry; Entry located at the front
- Laundry & utility: No laundry hookups on site
Neighborhood map
What this means for you Summary
Snapshot
- This is a 3-bed/1.0-bath manufactured listed at $99k. Condition is rated good.
Deal economics
- At list price, monthly cash flow is $2k ($21k/yr) — positive.
- The deal already cash-flows at list — no discount required.
- Meets the 1% rule at list price ($3k rent vs $99k).
- Recommended offer: $96k (3.0% below list) — sets the bar for market timing.
- Cap rate 27.4% vs local median 2.1% in Torrance — top-decile yield for the area; either an underpriced asset or a hidden risk that comps aren't pricing in. Stress-test before assuming the spread holds.
Location & tenants
- Location reads 76/100 on livability (#95 in CA, #3,501 nationally) — a middle-class / working-renter tenant base. Strengths: schools A+, amenities A+, commute A+; Watch: health & safety C-, crime D+, cost of living F.
- Torrance Unified (urban): math 62% / reading 67% proficiency, ranked #150 of 1,400 in CA (top 11%) — acceptable for families but not a draw, mixed tenant base, ~2y average lease; only 20% free/reduced lunch — higher-income household profile.
- Market conditions: Rents rising (+2.3%/yr); 33 active listings in the ZIP; 40 comparable units currently listed for rent nearby; rentals at typical pace (median 24d on market — plan ~3-4 weeks tenant-placement turnaround); 40% of comp listings sitting > 30 days — soft ceiling on asking rent; solid renter incomes; 19,697 units permitted in Los Angeles County in 2024 (9,426 in 5+ unit buildings).
- This rent runs 34% of the median local income ($108k/yr) — at the standard rent-burdened threshold; future hikes will face affordability resistance.
Forward outlook
- Local home prices are declining (-3.0%/yr); year-one equity from $684 of loan paydown is wiped out by about $3k of value loss. Plan a longer hold.
- Los Angeles County population projected at +9% by 2050 — modest demand growth; plan on rents tracking national, not racing it.
- At projected returns (-3.0% appreciation + 2.3% rent growth), your $28k cash investment doubles in ~2 years — after that, you're playing with house money.
Negotiation context
- It's been on market 56 days — a 3% lower offer ($96k) is reasonable based on typical stale-listing flexibility.
Questions for the listing agent
- It's been on market 56 days. Have you received any prior offers? Is the seller open to a 3% concession, seller financing, or rate buy-down credit?
- Built in 1962 — when were the roof, HVAC, electrical panel, plumbing, and water heater last replaced?
- Is there a deadline driving the sale (1031 exchange, divorce, estate, relocation)? That informs how much negotiation room exists.
- Schools are A-rated — typically a magnet for longer-tenancy family renters. What's the average tenant stay here, and is there a school-zone premium baked into asking?
- Crime grade is D in this area — have there been break-ins, vandalism, or insurance claims at this property in the last 3 years? What carrier currently insures it and at what premium?
- What's the average days-on-market for RENTAL listings here right now (not sales)? A rising rental-DOM trend means longer vacancies and softer asking-rent achievability than the comps imply.
- What's the recent tenant-quality profile in this submarket — average credit score on applications, eviction rate, late-payment / NSF rate, and stable-employment percentage? A property-management company in the area should have these aggregated.
- How much new for-sale + rental construction is in the pipeline within 1–3 miles? Heavy new supply typically softens prices + rents 12–24 months out; constrained supply supports both.
Investment metrics
- 1% rule
- 3.10% ✓
- Cap rate
- 27.43%
- Cash-on-cash
- 75.48%
- DSCR
- 4.36
- GRM
- 2.7
CMA / ARV
- ARV (median comp)
- $187,102
- List price
- $99,000
- Delta
- -47.09%
- Verdict
- UNDERPRICED
- Comps
- 6 within 2.0 mi
Show comp detail 1 sale within ~0.75 mi
| Address | Dist | Beds/Ba | Sqft | Sold | Price | $/sf | Match |
|---|---|---|---|---|---|---|---|
| 18801 Hawthorne Blvd #19 | 0.00mi | 2/2.0 (-1) | 880 (+4%) | 8mo | $135,000 | $153 | 79 |
Match score weights: distance 35% · size 25% · config 20% · recency 20%. Top-matched comps best support the ARV.
Projected returns pro-forma
-3.0% appreciation · 2.26% rent growth · sell at horizon
- IRR
- 74.5%
- Equity multiple
- 4.35×
- Total profit
- $92,785
- Equity at exit
- $14,761
- IRR
- 78.1%
- Equity multiple
- 8.75×
- Total profit
- $214,799
- Equity at exit
- $8,560
Cash invested: $27,720 (down + closing). Projections, not guarantees.
Landlord ↔ Tenant lean methodology
- Overall (STATE)
- 18 Strongly Tenant-Friendly
- State California
- 18 Strongly Tenant-Friendly · D+13
- County
- — inherits STATE
- City
- — inherits STATE
ZIP-level market 90504
- Rents YoY
- 2.3%
- Active inventory
- 33
- Price-to-rent
- 2.7×
Monthly cashflow live
- Estimated rent
- $3,073 high interval (Pro) →
- Mortgage (P&I)
- −$519
- Tax est. 1.5%
- −$124 /mo · $1,485/yr
- Insurance
- −$41
- HOA
- −$0
- Vacancy / Maint / Mgmt
- −$645
- Net cashflow
- $1,744
Break-even live
UW: 25.0% down · 7.5% · 30yr · 1.5% tax · 5.0% vac · 8.0% maint · 8.0% mgmt
Financing live
Cash to close
- Down payment
- $24,750
- Closing costs
- $2,970
- Reserves months
- —
- Total cash needed
- —
Loan-product check · same deal, 3 products live
Conventional
25% down · 7.5% · 30yr
- Down + closing
- —
- Monthly P&I
- —
- Monthly cashflow
- —
- DSCR
- —
- Eligible?
- —
Personal DTI + credit; lowest rate.
DSCR
20% down · 8.5% · 30yr
- Down + closing
- —
- Monthly P&I
- —
- Monthly cashflow
- —
- DSCR
- —
- Eligible?
- —
No personal income docs; deal must DSCR.
Hard money
10% down · 12.0% · 12mo
- Down + closing
- —
- Monthly P&I
- —
- Monthly cashflow
- —
- DSCR
- —
- Eligible?
- —
Short-term bridge; refi at stabilization.
Rent comps 40 comps
| Address | Beds | Baths | Sqft | Rent | $/sqft | DOM | Units | Dist |
|---|---|---|---|---|---|---|---|---|
| 2929 190th St Redondo Beach, CA | 2.0 | 2.0 | 1100 | $2,895 | $2.63 | 3d | 1 | 0.13mi |
| 18225 Kingsdale Ave Redondo Beach, CA | 2.0 | 2.0 | 1090 | $3,150 | $2.89 | 44d | 1 | 0.39mi |
| 4115 W 182nd St Torrance, CA | 2.0 | 2.0 | 800 | $2,400 | $3.00 | 15d | 1 | 0.56mi |
| 2513 190th St Unit A Redondo Beach, CA | 2.0 | 1.0 | 760 | $3,495 | $4.60 | 11d | 1 | 0.62mi |
| 18150 Prairie Ave Torrance, CA | 1.0–2.0 | 1.0–2.0 | 900 | $2,895 | $3.22 | 18d | 2 | 0.72mi |
| 3839 W 182nd St Torrance, CA | 2.0 | 2.0 | 1000 | $3,250 | $3.25 | 24d | 1 | 0.79mi |
| 3546 Del Amo Blvd Unit 9 Torrance, CA | 2.0 | 2.0 | 900 | $2,595 | $2.88 | 43d | 1 | 0.85mi |
| 2617 Rockefeller Ln Unit C Redondo Beach, CA | 2.0 | 1.0 | 900 | $2,795 | $3.11 | 18d | 1 | 0.90mi |
| 2607 Rockefeller Ln Redondo Beach, CA | 2.0 | 1.0 | 760 | $3,050 | $4.01 | 43d | 1 | 0.94mi |
| 2704 Vanderbilt Ln Redondo Beach, CA | 2.0 | 2.0 | 1000 | $3,195 | $3.19 | 11d | 1 | 0.95mi |
| 4422 W 172nd St Lawndale, CA | 2.0 | 1.5 | 920 | $2,816 | $3.06 | 1d | 2 | 1.00mi |
| 2317 Marshallfield Ln Unit B Redondo Beach, CA | 2.0 | 1.5 | 1000 | $2,950 | $2.95 | 17d | 1 | 1.00mi |
| 4428 W 171st St Lawndale, CA | 2.0 | 1.0 | 700 | $2,700 | $3.86 | 1d | 1 | 1.06mi |
| 2421 Rockefeller Ln Redondo Beach, CA | 3.0 | 1.0 | 1000 | $3,850 | $3.85 | 43d | 1 | 1.07mi |
| 3724 Spencer St Torrance, CA | 2.0 | 2.0 | 1050 | $2,852 | $2.72 | 20d | 1 | 1.07mi |
| 4350 W 171st St Apt B Lawndale, CA | 2.0 | 1.0 | 900 | $2,700 | $3.00 | 24d | 1 | 1.07mi |
| 2616 Mathews Ave Redondo Beach, CA | 2.0 | 1.0 | 950 | $2,595 | $2.73 | 43d | 1 | 1.09mi |
| 4427 W 171st St Unit 4427 Lawndale, CA | 3.0 | 1.0 | 1016 | $3,200 | $3.15 | 1d | 1 | 1.11mi |
| 4507 Spencer St Torrance, CA | 2.0 | 2.0 | 1000 | $2,700 | $2.70 | 17d | 1 | 1.13mi |
| 4506 W 170th St Lawndale, CA | 2.0 | 1.0 | 777 | $3,600 | $4.63 | 1d | 1 | 1.14mi |
| 3707 Garnet St Torrance, CA | 1.0–2.0 | 1.0–2.0 | 875 | $2,849 | $3.26 | 10d | 1 | 1.14mi |
| 20501 Anza Ave Torrance, CA | 2.0 | 2.0 | 775 | $2,725 | $3.52 | 7d | 1 | 1.16mi |
| 2700 Ruhland Ave Unit C Redondo Beach, CA | 2.0 | 1.0 | 850 | $2,495 | $2.94 | 43d | 1 | 1.18mi |
| 1808 Mackay Ln Unit 03 Redondo Beach, CA | 2.0 | 1.0 | 1000 | $2,749 | $2.75 | 3d | 1 | 1.19mi |
| 1808 Mackay Ln Unit 06 Redondo Beach, CA | 2.0 | 1.0 | 800 | $2,649 | $3.31 | 43d | 1 | 1.19mi |
| 1808 Mackay Ln Unit 02 Redondo Beach, CA | 2.0 | 1.0 | 900 | $2,750 | $3.06 | 43d | 1 | 1.19mi |
| 4108 Redondo Beach Blvd Unit A Torrance, CA | 2.0 | 1.0 | 700 | $2,800 | $4.00 | 24d | 1 | 1.20mi |
| 3723 Artesia Blvd Torrance, CA | 3.0 | 2.0 | 1050 | $3,250 | $3.10 | 43d | 1 | 1.24mi |
| 3723 Artesia Blvd Apt E Torrance, CA | 3.0 | 1.5 | 1050 | $3,250 | $3.10 | 43d | 1 | 1.24mi |
| 3553 Emerald St Torrance, CA | 1.0–2.0 | 1.0–2.0 | 800 | $2,695 | $3.37 | 6d | 1 | 1.27mi |
| 20606 Anza Ave Torrance, CA | 2.0 | 2.0 | 1000 | $2,595 | $2.60 | 43d | 1 | 1.27mi |
| 20721 Amie Ave Torrance, CA | 2.0 | 2.0 | 1000 | $2,975 | $2.98 | 1d | 1 | 1.28mi |
| 3705 Artesia Blvd Torrance, CA | 1.0–2.0 | 1.0 | 700 | $2,692 | $3.85 | 43d | 2 | 1.29mi |
| 3505 Emerald St Apt 12 Torrance, CA | 2.0 | 1.5 | 864 | $2,595 | $3.00 | 43d | 1 | 1.31mi |
| 3505 Emerald St Unit 15 Torrance, CA | 2.0 | 1.5 | 948 | $2,695 | $2.84 | 43d | 1 | 1.31mi |
| 3554 Emerald St Unit A Torrance, CA | 2.0 | 1.0 | 900 | $2,950 | $3.28 | 6d | 1 | 1.32mi |
| 3910 Emerald St Torrance, CA | 1.0–2.0 | 1.0–2.0 | 900 | $2,275 | $2.53 | 24d | 1 | 1.33mi |
| 20710 Anza Ave Torrance, CA | 1.0–3.0 | 1.0–1.5 | 896 | $2,802 | $3.13 | 17d | 2 | 1.33mi |
| 2103 Harriman Ln Unit A Redondo Beach, CA | 2.0 | 1.0 | 978 | $3,500 | $3.58 | 43d | 1 | 1.33mi |
| 2209 Carnegie Ln #2 Redondo Beach, CA | 2.0 | 1.0 | 670 | $2,595 | $3.87 | 43d | 1 | 1.34mi |
Listing history 15 events
-
2026-06-18days on market $99,000 Active 56 DOM
-
2026-06-17days on market $99,000 Active 55 DOM
-
2026-06-16days on market $99,000 Active 54 DOM
-
2026-06-15days on market $99,000 Active 53 DOM
-
2026-06-13days on market $99,000 Active 51 DOM
-
2026-06-13days on market $99,000 Active 50 DOM
-
2026-06-09days on market $99,000 Active 47 DOM
-
2026-06-08days on market $99,000 Active 46 DOM
-
2026-06-07days on market $99,000 Active 45 DOM
-
2026-06-04days on market $99,000 Active 42 DOM
-
2026-06-03days on market $99,000 Active 41 DOM
-
2026-06-02days on market $99,000 Active 40 DOM
-
2026-06-01days on market $99,000 Active 39 DOM
-
2026-05-31days on market $99,000 Active 38 DOM
-
2026-04-23$119,000 Active 766-char remark
ⓘ Source: listings_history table (triggers on properties + properties_extension) + one-shot
backfill from property_details.listing_events for pre-trigger history.
Climate risk First Street
- Flood 1/10 Low FEMA zone X (unshaded) · 0% chance over 30 yrs
- Wildfire 1/10 Low
- Heat 4/10 Moderate 5 d/yr ≥85°F today · 16 d/yr by 30 yrs out
- Wind 1/10 Low
- Air quality 4/10 Moderate 5 unhealthy d/yr today · 6 by 30 yrs out
Nearby sold comps map
Loading sold comps map…
Walkable amenities ~0.75 mi
Loading nearby amenities…
Taxation est. · year 1
- Rental income
- $36,878
- − Mortgage interest
- −$5,546
- − Property taxes
- −$1,485
- − Insurance
- −$495
- − Repairs & maintenance
- −$2,950
- − Management
- −$2,950
- − Depreciation
- −$2,880
- Taxable income
- $20,572
- Est. tax owed @ 24.0%
- −$4,937
- After-tax cash flow
- $15,986/yr
For passive investors: Depreciation is non-cash, so a rental often shows a tax loss while cash-flowing — sheltering income. Rental losses are passive: they offset passive income freely, and up to $25,000/yr can offset ordinary (W-2) income if you actively participate and your MAGI is under $100k (phasing out to $0 by $150k); unused losses carry forward. On sale, claimed depreciation is recaptured at up to 25%, and gains may owe capital-gains tax (a 1031 exchange can defer both). Figures are a year-1 estimate at your 24.0% rate — not tax advice; consult a CPA.
Condition & rehab AI · 12 photos
This well-maintained single-wide mobile home in a desirable community offers a good condition with minimal repairs needed. Upgrades in paint, kitchen, and landscaping would significantly enhance its value.
Value-add opportunities
- Both Painting exterior and interior walls — Enhances curb appeal and interior aesthetics
- Both Upgrading kitchen appliances — Improves functionality and appeal
- Both Upgrading bathroom fixtures — Enhances functionality and appeal
- Both Landscaping improvements — Enhances curb appeal and property value
Renovation cost estimate screening
Value-add ROI direction
- Both Painting exterior and interior walls — Enhances curb appeal and interior aesthetics ↑
- Both Upgrading kitchen appliances — Improves functionality and appeal ↑
- Both Upgrading bathroom fixtures — Enhances functionality and appeal ↑
- Both Landscaping improvements — Enhances curb appeal and property value ↑
ⓘ Cost ranges are severity-bucket heuristics (US national rule-of-thumb). Get contractor quotes + a written scope before underwriting a rehab budget.
Schools (NCES district)
- District
- Torrance Unified
- NCES district ID
- 0639420
- Math proficiency
- 62% ▲ 2.00%
- Reading proficiency
- 67% ▬ 0.00%
- Median HH income
- $78,640
- Composite
- 58.96/100
- National rank
- #1969
- State rank
- #150 of 1400 in CA
Livability — Torrance
- Score
- 76/100
- State rank
- #95
- US rank
- #3501
Category grades
Schools grade is shown separately in the Schools card above.
Census & demographics
- Census place
- Torrance, CA
- County
- Los Angeles County · 9,444,647 people
- City population
- 153,473
- Metro
- Los Angeles-Long Beach-Anaheim, CA
- Population (ZIP)
- 33,084
- Household income
- $107,552
- Rent vs Own
- Severe rent burden
- 1335.0
Population outlook (Los Angeles County) Hauer SSP2
- Today (2025)
- 10,940,515 people
- By 2030
- 11,256,481 · +2.9%
- By 2040
- 11,729,929 · +7.2%
- By 2050
- 11,948,407 · +9.2%
- By 2075
- 11,818,114 · +8.0%
- By 2100
- 10,842,928 · -0.9%
Race, ethnicity, and origin ACS 2023
- Neighborhood character
- Highly diverse neighborhood (Simpson 0.72)
- Race & ethnicity
- Asian 39% Hispanic / Latino 26% White 24% Two or more races 16% Black 4%
- Hispanic origin (detail)
- Mexican 18%
- Common ancestry
- Lithuanian 1% Slovak 1% Portuguese 1%
- Foreign-born
- 29% · Canada, South Korea, Vietnam
- Languages at home
- 57% English-only · Spanish 14% Other Asian/Pacific 6% Korean 5%
Political lean MEDSL · Los Angeles
- 2024 margin
- Solid D (+32.9) · D 64.8% · R 31.9% · Other 3.3%
- 2008→2024 swing
- -7.4pp toward R · 2008: 40.4pp · 2024: 32.9pp
- All cycles
- 2024: D+32.9 2020: D+44.2 2016: D+48.0 2012: D+40.0 2008: D+40.4
Not yet ingested
- Civics
- —
Market trends
- HPI YoY
- ▼ -940.72%
- Current HPI
- 387.9811
- Rent YoY
- ▲ 2.26%
- Metro
- Los Angeles-Long Beach-Anaheim, CA
- State GDP YoY
- ▲ 3.21%
- F500 in state
- 116
Industry mix (Fortune 500 HQ in CA)
| Industry | F500 HQs | Revenue |
|---|---|---|
| Technology | 27 | $1,492B |
|
||
| Financial Services | 3 | $174B |
|
||
| Retail | 3 | $44B |
|
||
| Insurance | 3 | $26B |
|
||
| Media / Entertainment | 2 | $115B |
|
||
| Pharmaceuticals / Biotech | 2 | $62B |
|
||
Price history
-16.8% since first listed2 events — show timeline
- 2026-05-29 Price Changed $99,000 CRMLS
- 2026-04-23 Listed $119,000 CRMLS
Cash-flow waterfall
monthlySold comps — $/sqft
last 12 mo · ≤1 miLoading sold comps…