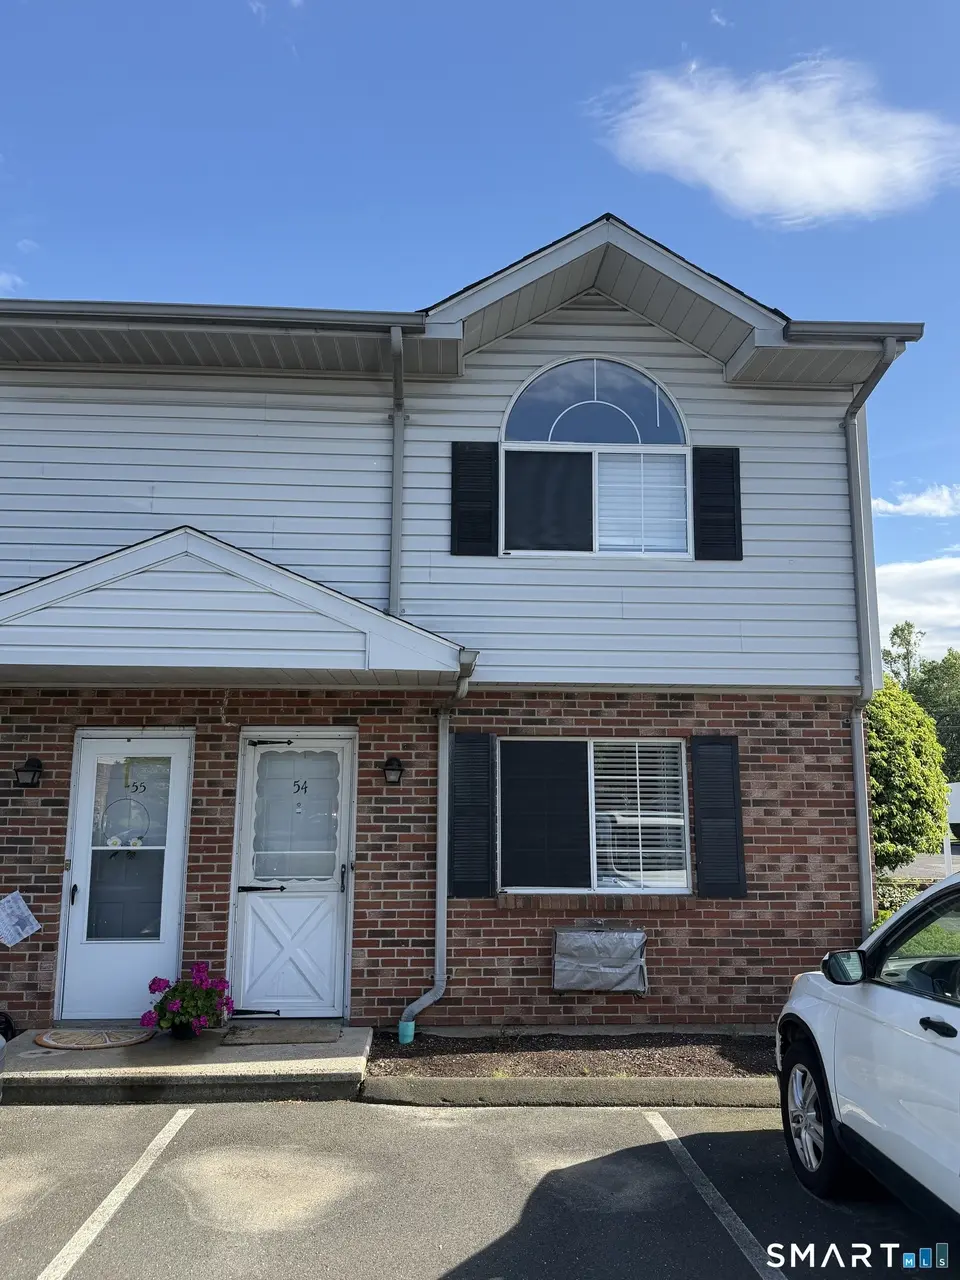
975 Meriden Rd #54 · Waterbury, CT
Flood risk No data
- FEMA flood zone
- —
- Chance of flooding over 30 yrs
- —
- Est. flood insurance / yr
- —
Fire risk No data
- Est. fire insurance / yr
- —
Heat risk No data
- Hot days now (above threshold)
- —
- Hot days in 30 yrs
- —
Wind risk No data
- Chance of severe wind over 30 yrs
- —
Air-quality risk No data
- Unhealthy air days now
- —
- Unhealthy air days in 30 yrs
- —
Risk factors via First Street. Map © Google.
Why this score? — see what drove the D grade
The composite is a weighted blend of 9 inputs, each scored 0–100. Each bar is that input's sub-score; the figure is the points it added to the 100-point composite (weight × sub-score).
- Cash flow +13.1/30.0
- ARV discount +7.5/15.0
- 1% rule +5.9/10.0
- Livability +4.0/5.0
- DSCR +3.9/10.0
- Rent growth +3.3/5.0
- Condition / age +2.5/5.0
- Schools +1.5/10.0
- Appreciation +0.0/10.0
$175,000
🖨 Deal sheet (PDF) 📄 Offer letter ✓ Due diligence
Listing remarks MLS
Unit boasts new carpet, & vinyl floors. New appliances, air conditoners & hot water heater. Popular "east end" close to shopping, i84, rt8, i691 & 91, end unit, more owners than renters. Move in condition...Nothing to do.
Key facts
- Public transit
- Local shopping
- Restaurants
Tags
Property features AI
Finance
- Other: Part of a 123-unit community
- HOA & community: Homeowners association with monthly fee; Monthly HOA fee of $230; HOA covers grounds maintenance, trash pickup, snow removal, and water; Professional off-site property management; Pets allowed with possible restrictions
Exterior
- Parking: Paved off-street assigned parking (1 space)
- Utilities: Public water connected; Public sewer connected; Electric service for heat and hot water
- Home design: Condominium; End unit; Condo/Co-op for sale
- Construction: Frame and brick construction; White exterior color
- Exterior features: Vinyl siding; Part of the Chelsea Square complex; Nearby amenities include basketball court, commuter bus, golf course, park, public recreation facilities, public transportation, tennis courts, and walkable bus lines
Interior
- Kitchen: Oven/Range; Refrigerator; Dishwasher
- Bedrooms: 2 bedrooms (unit spans 2 levels; laundry on upper level)
- Bathrooms: 1 full bath; 1 half bath
- Heating & cooling: Baseboard heating (electric); Wall unit cooling; Electric hot water
- Interior features: Open floor plan; Attic with storage space and pull-down stairs; No basement
- Laundry & utility: Laundry room on upper level
Neighborhood map
What this means for you Summary
Snapshot
- This is a 2-bed/1.5-bath condo listed at $175k.
Deal economics
- At list price, monthly cash flow is $-7 ($-88/yr) — negative.
- To cash-flow at today's rent, offer at most $174k (0.7% below list).
- Meets the 1% rule at list price ($2k rent vs $175k).
- Recommended offer: $172k (1.5% below list) — sets the bar for market timing.
- Cap rate 6.2% vs local median 3.5% in Waterbury — top-decile yield for the area; either an underpriced asset or a hidden risk that comps aren't pricing in. Stress-test before assuming the spread holds.
Location & tenants
- Location reads 79/100 on livability (#32 in CT, #2,205 nationally) — a middle-class / working-renter tenant base. Strengths: commute A+, cost of living A+, housing A+; Watch: crime D, employment D.
- Waterbury School District (suburban): math 12% / reading 23% proficiency, ranked #148 of 153 in CT (top 97%) — low school quality limits family demand, transient renter base, plan for 1-2y turnover; 73% free/reduced lunch — lower-income household profile, screen leases tightly.
- Zoned schools: H. S. Chase School (math 15% / reading 21%, grade F, #456 of 553 statewide, top 83%, 629 students, 73% FRL); Michael F. Wallace Middle School (math 13% / reading 28%, grade F, #160 of 175 statewide, top 91%, 1,062 students, 86% FRL); Crosby High School (math 2% / reading 17%, grade F, #187 of 194 statewide, top 96%, 1,400 students, 84% FRL).
- Market conditions: Rents rising (+3.4%/yr); 82 active listings in the ZIP; 23 comparable units currently listed for rent nearby; rentals at typical pace (median 23d on market — plan ~3-4 weeks tenant-placement turnaround); 48% of comp listings sitting > 30 days — soft ceiling on asking rent; 502 units permitted in Naugatuck Valley Planning Region in 2024 (171 in 5+ unit buildings).
- This rent runs 42% of the median local income ($54k/yr) — at the standard rent-burdened threshold; future hikes will face affordability resistance.
Forward outlook
- Local home prices are declining (-3.0%/yr); year-one equity from $1k of loan paydown is wiped out by about $5k of value loss. Plan a longer hold.
Negotiation context
- It's been on market 20 days — a 2% lower offer ($172k) is reasonable based on typical stale-listing flexibility.
- 6 sale attempts since 19y ago with the ask held roughly flat each time — persistent listings suggest the price (not the market) is what's stuck; bring a comps-based counter.
- Current owner paid $75k; list at $175k implies a 133% gain — meaningful room to come down on a strong offer.
Questions for the listing agent
- What do current leases actually rent for vs. the listed asking? Can we see a recent rent roll and the last 12 months of T-12 income?
- What does the HOA fee cover, when was the last increase, and are there any pending special assessments or reserve-fund shortfalls?
- Any open or pending special assessments — roof, HVAC, plumbing, elevator, façade? What's the per-unit balance and payoff schedule, and is the seller paying it off at close or rolling it to the buyer?
- Is there a deadline driving the sale (1031 exchange, divorce, estate, relocation)? That informs how much negotiation room exists.
- Schools are D-rated, which usually means shorter tenancies and higher turnover. Who's the typical renter profile here, and what's been the actual vacancy rate?
- Crime grade is D in this area — have there been break-ins, vandalism, or insurance claims at this property in the last 3 years? What carrier currently insures it and at what premium?
- The area grade is low — what's the realistic commute time and amenity access for the typical tenant pool here? Any planned neighborhood developments (good or bad) we should know about?
- What's the average days-on-market for RENTAL listings here right now (not sales)? A rising rental-DOM trend means longer vacancies and softer asking-rent achievability than the comps imply.
- What's the recent tenant-quality profile in this submarket — average credit score on applications, eviction rate, late-payment / NSF rate, and stable-employment percentage? A property-management company in the area should have these aggregated.
- How much new apartment / multifamily construction is in the pipeline within 1–3 miles? Heavy new supply (>2% of stock underway) typically softens rents 12–24 months out; light construction supports rent growth.
Investment metrics
- 1% rule
- 1.09% ✓
- Cap rate
- 6.24%
- Cash-on-cash
- -0.18%
- DSCR
- 0.99
- GRM
- 7.7
CMA / ARV
No comps found within radius.
Projected returns pro-forma
-3.0% appreciation · 3.37% rent growth · sell at horizon
- IRR
- -15.9%
- Equity multiple
- 0.43×
- Total profit
- $-27,898
- Equity at exit
- $26,093
- IRR
- -6.5%
- Equity multiple
- 0.57×
- Total profit
- $-21,085
- Equity at exit
- $15,131
Cash invested: $49,000 (down + closing). Projections, not guarantees.
Landlord ↔ Tenant lean methodology
- Overall (STATE)
- 27 Tenant-Leaning
- State Connecticut
- 27 Tenant-Leaning · D+7
- County
- — inherits STATE
- City
- — inherits STATE
ZIP-level market 06705
- Home prices YoY
- -11.0%
- Rents YoY
- 3.4%
- Active inventory
- 82
- Price-to-rent
- 7.7×
Monthly cashflow live
- Estimated rent
- $1,902 high interval (Pro) →
- Mortgage (P&I)
- −$918
- Tax from tax record
- −$290 /mo · $3,475/yr
- Insurance
- −$73
- HOA
- −$230
- Vacancy / Maint / Mgmt
- −$400
- Net cashflow
- $-7
Break-even live
Sensitivity live
| Price | -10% $92 | -5% $42 | +0% $-7 | +5% $-57 | +10% $-106 |
|---|---|---|---|---|---|
| Rent | -10% $-158 | -5% $-82 | +0% $-7 | +5% $68 | +10% $143 |
| Rate | -1.0pp $81 | -0.5pp $37 | base $-7 | +0.5pp $-53 | +1.0pp $-99 |
UW: 25.0% down · 7.5% · 30yr · 1.5% tax · 5.0% vac · 8.0% maint · 8.0% mgmt
Financing live
Cash to close
- Down payment
- $43,750
- Closing costs
- $5,250
- Reserves months
- —
- Total cash needed
- —
Loan-product check · same deal, 3 products live
Conventional
25% down · 7.5% · 30yr
- Down + closing
- —
- Monthly P&I
- —
- Monthly cashflow
- —
- DSCR
- —
- Eligible?
- —
Personal DTI + credit; lowest rate.
DSCR
20% down · 8.5% · 30yr
- Down + closing
- —
- Monthly P&I
- —
- Monthly cashflow
- —
- DSCR
- —
- Eligible?
- —
No personal income docs; deal must DSCR.
Hard money
10% down · 12.0% · 12mo
- Down + closing
- —
- Monthly P&I
- —
- Monthly cashflow
- —
- DSCR
- —
- Eligible?
- —
Short-term bridge; refi at stabilization.
Rent comps 23 comps
| Address | Beds | Baths | Sqft | Rent | $/sqft | DOM | Units | Dist |
|---|---|---|---|---|---|---|---|---|
| 18 Manchester Ave Waterbury, CT | 3.0 | 1.5 | 1074 | $3,000 | $2.79 | 23d | 1 | 0.14mi |
| 37 Alexander Ave Unit 1 Waterbury, CT | 2.0 | 1.0 | 750 | $1,650 | $2.20 | 4d | 1 | 0.15mi |
| 22 Leaf Ave Unit 2nd Floor Waterbury, CT | 2.0 | 1.0 | 1200 | $1,650 | $1.38 | 4d | 1 | 0.21mi |
| 87 Worcester Ave Waterbury, CT | 3.0 | 1.0 | 1252 | $2,300 | $1.84 | 21d | 1 | 0.29mi |
| 64 Wislock St Waterbury, CT | 3.0 | 2.0 | 1040 | $2,500 | $2.40 | 4d | 1 | 0.37mi |
| 22 Coral Dr Waterbury, CT | 1.0–3.0 | 1.0–1.5 | 1005 | $1,602 | $1.59 | 3d | 6 | 0.50mi |
| 248 Birchfield Dr Unit 53-1 Waterbury, CT | 2.0 | 1.0 | 768 | $1,500 | $1.95 | 45d | 1 | 0.59mi |
| 248 Birchfield Dr Unit 258-4 Waterbury, CT | 2.0 | 1.0 | 792 | $1,475 | $1.86 | 45d | 1 | 0.59mi |
| 329 Schraffts Dr Waterbury, CT | 1.0 | 1.0 | 800 | $1,650 | $2.06 | 45d | 1 | 0.70mi |
| 82 Middlefield Ave Unit 2nd Floor Waterbury, CT | 3.0 | 1.0 | 1216 | $1,900 | $1.56 | 23d | 1 | 0.71mi |
| 1358 Meriden Rd Unit 1368-13 Wolcott, CT | 2.0 | 1.0 | 901 | $1,550 | $1.72 | 45d | 1 | 0.73mi |
| 1358 Meriden Rd Unit 1358-15 Wolcott, CT | 1.0 | 1.0 | 740 | $1,250 | $1.69 | 5d | 1 | 0.73mi |
| 1358 Meriden Rd Unit 1368-09 Wolcott, CT | 1.0 | 1.0 | 740 | $1,250 | $1.69 | 45d | 1 | 0.73mi |
| 300 Schraffts Dr Waterbury, CT | 1.0–2.0 | 1.0–2.0 | 1075 | $1,850 | $1.72 | 4d | 2 | 0.81mi |
| 107 Blanchard St Waterbury, CT | 2.0 | 1.0 | 700 | $1,700 | $2.43 | 21d | 1 | 0.91mi |
| 174 Stonefield Dr #41 Waterbury, CT | 3.0 | 1.5 | 1354 | $2,450 | $1.81 | 4d | 1 | 0.93mi |
| 217 Scott Rd Unit 1-B Waterbury, CT | 1.0 | 1.0 | 750 | $1,275 | $1.70 | 45d | 1 | 1.06mi |
| 217 Scott Rd Waterbury, CT | 1.0 | 1.0 | 750 | $1,275 | $1.70 | 45d | 1 | 1.06mi |
| 75 Alma St Waterbury, CT | 3.0 | 1.0 | 1143 | $1,850 | $1.62 | 45d | 1 | 1.27mi |
| 124 Meriden Rd Waterbury, CT | 1.0 | 1.0 | 900 | $1,100 | $1.22 | 45d | 1 | 1.38mi |
| 100 Meriden Rd Unit A Waterbury, CT | 2.0 | 1.0 | 1044 | $1,850 | $1.77 | 16d | 1 | 1.42mi |
| 1720 E Main St Unit 2nd Floor Waterbury, CT | 2.0 | 1.0 | 1026 | $1,350 | $1.32 | 45d | 1 | 1.43mi |
| 1720 E Main St Unit 1st Floor Waterbury, CT | 2.0 | 1.0 | 1026 | $1,250 | $1.22 | 45d | 1 | 1.43mi |
HOA detail condo
- Monthly dues
- $230 · $2,760/yr
- Likely covers
- water
- Assessments
- None detected in remarks — confirm with the listing agent.
Listing history 15 events
-
2026-06-21days on market $175,000 Active 20 DOM
-
2026-06-18days on market $175,000 Active 17 DOM
-
2026-06-17days on market $175,000 Active 16 DOM
-
2026-06-16days on market $175,000 Active 15 DOM
-
2026-06-15days on market $175,000 Active 14 DOM
-
2026-06-14days on market $175,000 Active 12 DOM
-
2026-06-13days on market $175,000 Active 11 DOM
-
2026-06-10days on market $175,000 Active 9 DOM
-
2026-06-09days on market $175,000 Active 8 DOM
-
2026-06-08days on market $175,000 Active 7 DOM
-
2026-06-07days on market $175,000 Active 6 DOM
-
2026-06-05days on market $175,000 Active 3 DOM
-
2026-06-03days on market $175,000 Active 2 DOM
-
2026-06-01remarks 421-char remark
-
2026-06-01$175,000 Active 1 DOM
ⓘ Source: listings_history table (triggers on properties + properties_extension) + one-shot
backfill from property_details.listing_events for pre-trigger history.
Tax reassessment forecast CT · Partial reset (capped growth)
- Current annual tax
- $3,475 · $290/mo
- Projected year-2 tax
- $3,610 · $301/mo
- Expected delta
- +$135/yr (+$11/mo · 3.9%)
ⓘ Screening estimate from a state-policy table — verify with the county assessor before closing.
Nearby sold comps map
Loading sold comps map…
Walkable amenities ~0.75 mi
Loading nearby amenities…
Taxation est. · year 1
- Rental income
- $22,829
- − Mortgage interest
- −$9,803
- − Property taxes
- −$3,475
- − Insurance
- −$875
- − Repairs & maintenance
- −$1,826
- − Management
- −$1,826
- − HOA
- −$2,760
- − Depreciation
- −$5,091
- Taxable loss
- −$2,827
- Est. tax savings @ 24.0%
- +$679
- After-tax cash flow
- $591/yr
For passive investors: Depreciation is non-cash, so a rental often shows a tax loss while cash-flowing — sheltering income. Rental losses are passive: they offset passive income freely, and up to $25,000/yr can offset ordinary (W-2) income if you actively participate and your MAGI is under $100k (phasing out to $0 by $150k); unused losses carry forward. On sale, claimed depreciation is recaptured at up to 25%, and gains may owe capital-gains tax (a 1031 exchange can defer both). Figures are a year-1 estimate at your 24.0% rate — not tax advice; consult a CPA.
Schools (NCES district)
- District
- Waterbury School District
- NCES district ID
- 0904830
- Math proficiency
- 12% ▼ -7.00%
- Reading proficiency
- 23% ▼ -8.00%
- Median HH income
- $40,040
- Composite
- 14.85/100
- National rank
- #9380
- State rank
- #148 of 153 in CT
Livability — Waterbury
- Score
- 79/100
- State rank
- #32
- US rank
- #2205
Category grades
Schools grade is shown separately in the Schools card above.
Census & demographics
- Census place
- Waterbury, CT
- County
- New Haven County · 688,236 people
- City population
- 115,012
- Metro
- New Haven-Milford, CT
- Population (ZIP)
- 25,266
- Household income
- $53,954
- Rent vs Own
- Severe rent burden
- 1690.0
Population outlook (Naugatuck Valley County) Hauer SSP2
- By 2040
- 496,846
Race, ethnicity, and origin ACS 2023
- Neighborhood character
- Highly diverse neighborhood (Simpson 0.71)
- Race & ethnicity
- White 34% Hispanic / Latino 34% Black 22% Two or more races 14% Asian 4%
- Hispanic origin (detail)
- Mexican 2% Puerto Rican 22% Dominican 3%
- Common ancestry
- Lithuanian 6% Hispanic 3% Romanian 2%
- Foreign-born
- 19% · Canada, Jamaica, China
- Languages at home
- 66% English-only · Spanish 22% Other Indo-European 6% French/Haitian/Cajun 3%
Political lean MEDSL · Naugatuck Valley
- 2024 margin
- Lean R (+7.4) · D 45.6% · R 53.0% · Other 1.4%
- All cycles
- 2024: R+7.4
Not yet ingested
- Civics
- —
Market trends
- HPI YoY
- ▼ -37.50%
- Current HPI
- 304.4948
- Rent YoY
- ▲ 3.37%
- Metro
- New Haven-Milford, CT
- State GDP YoY
- ▲ 1.06%
- F500 in state
- 38
Industry mix (Fortune 500 HQ in CT)
| Industry | F500 HQs | Revenue |
|---|---|---|
| Industrial Machinery | 4 | $38B |
|
||
| Insurance | 3 | $71B |
|
||
| Financial Services | 2 | $25B |
|
||
| Transportation / Logistics | 2 | $18B |
|
||
| Healthcare | 1 | $247B |
|
||
| Telecommunications | 1 | $55B |
|
||
Price history
+121.8% since first listed14 events — show timeline
- 2026-06-01 Listed $175,000 Smart MLS
- 2021-08-25 Sold (Public Records) $75,000 Public Records
- 2009-03-20 Sold (Public Records) $87,000 Public Records
- 2009-03-18 Sold (MLS) $88,000 Smart MLS
- 2009-01-20 Listed $92,900 Smart MLS
- 2008-02-29 Listing Removed — Smart MLS
- 2008-01-25 Listed $94,000 Smart MLS
- 2008-01-18 Listing Removed — Smart MLS
- 2008-01-02 Listing Removed — Smart MLS
- 2008-01-02 Listed $98,000 Smart MLS
- 2007-10-27 Listed $93,900 Smart MLS
- 2007-10-26 Listing Removed — Smart MLS
- 2007-08-25 Listed $103,900 Smart MLS
- 1988-07-28 Sold (Public Records) $78,900 Public Records
Property tax history
+4.2%/yrLatest (2023): $3,475 · +60.4% YoY. Source: county tax records.
Cash-flow waterfall
monthlySold comps — $/sqft
last 12 mo · ≤1 miLoading sold comps…