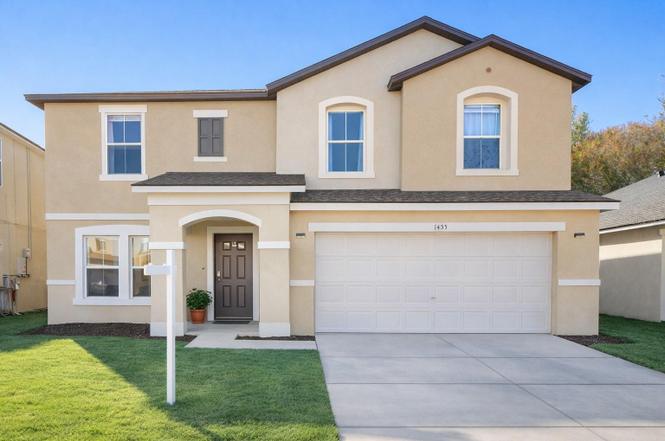
1455 Blue Horizon Dr · Four Corners, FL
Flood risk 1/10 · Minimal
- FEMA flood zone
- X (unshaded)
- Chance of flooding over 30 yrs
- 0.0%
- Est. flood insurance / yr
- $507 – $1,088
Fire risk 6/10 · Moderate
- Est. fire insurance / yr
- $947 – $1,759
Heat risk 9/10 · Severe
- Hot days now (above 107°F)
- 7 days/yr
- Hot days in 30 yrs
- 25 days/yr
Wind risk 9/10 · Severe
- Chance of severe wind over 30 yrs
- 99.0%
Air-quality risk 2/10 · Minimal
- Unhealthy air days now
- 1 days/yr
- Unhealthy air days in 30 yrs
- 1 days/yr
Risk factors via First Street. Map © Google.
Why this score? — see what drove the D+ grade
The composite is a weighted blend of 9 inputs, each scored 0–100. Each bar is that input's sub-score; the figure is the points it added to the 100-point composite (weight × sub-score).
- ARV discount +15.0/15.0
- Cash flow +10.6/30.0
- Appreciation +4.8/10.0
- Schools +4.2/10.0
- Livability +3.5/5.0
- 1% rule +3.1/10.0
- DSCR +3.0/10.0
- Condition / age +2.5/5.0
- Rent growth +1.6/5.0
$419,900
🖨 Deal sheet (PDF) 📄 Offer letter ✓ Due diligence
Listing remarks
Spacious 5-bedroom, 2.5-bath home ideally located just minutes from Walt Disney World and surrounded by everyday conveniences! Enjoy close proximity to Lowe’s, Walmart, a Publix-anchored shopping center, numerous restaurants, golf courses, great fishing spots, and quick access to Interstate 4. This open floor plan home offers exceptional interior space rarely found at this price point. The expansive living room measures an impressive 22' x 18', complemented by a generous 20' x 14' family room and a well-sized 14' x 12' kitchen—creating a seamless flow perfect for entertaining or large gatherings. You’d have to step outside to find a more open feel! Upstairs features
Key facts
- Well-sized kitchen
- Open floor plan
- Generous family room
Tags
Property features AI
Finance
- Other: Total acreage: less than 1/4 acre; Lot size approximately 0.13 acre; Building area reported (total): 3,309 sq ft; Living area reported: 2,919 sq ft
- HOA & community: HOA managed by Sentry Management; Monthly HOA fee approximately $52.50; Semi-annual association fee of $315; Association amenities: Park, Pool; Pets allowed (dogs OK); Sidewalks in the community
Exterior
- Parking: Attached 2-car garage (approx. 20 x 19); Driveway; Ground level parking
- Utilities: Public water; Public sewer; Water connected; Sewer connected
- Home design: Single family residence; Residential property; Planned unit development (PUD); Two-story home; Faces east; Entry level: Two levels
- Construction: Stucco exterior; Shingle roof; Slab foundation; Built with stucco construction
- Exterior features: Patio; Sidewalk; Sliding doors; Asphalt road access; Public maintained road
Interior
- Kitchen: Dishwasher; Microwave; Range; Refrigerator
- Bedrooms: 5 bedrooms
- Flooring: Carpet; Vinyl
- Bathrooms: 2 full bathrooms; 1 half bathroom
- Heating & cooling: Central heating (electric); Central air conditioning
- Interior features: Eat-in kitchen; Kitchen/family room combo; Open floorplan; Thermostat; Walk-in closets; Window treatments; Blinds, drapes and rods
- Laundry & utility: Inside laundry room; Washer hookup; Electric dryer hookup
Neighborhood map
What this means for you Summary
Snapshot
- This is a 6-bed/3.5-bath single-family listed at $420k.
Deal economics
- At list price, monthly cash flow is $-209 ($-3k/yr) — negative.
- To cash-flow at today's rent, offer at most $383k (8.8% below list).
- To meet the 1% rule (rent ≥ 1% of price), the offer needs to be $339k (19.4% below list).
- Recommended offer: $339k (19.4% below list) — sets the bar for 1% rule.
- Cap rate 5.7% vs local median 3.2% in Four Corners — top-decile yield for the area; either an underpriced asset or a hidden risk that comps aren't pricing in. Stress-test before assuming the spread holds.
Location & tenants
- Location reads 69/100 on livability (#453 in FL) — a middle-class / working-renter tenant base. Strengths: housing A+, cost of living A-; Watch: amenities F, health & safety F.
- Lake (suburban): math 49% / reading 50% proficiency, ranked #37 of 73 in FL (top 51%) — families likely to look elsewhere, expect single-tenant / working-renter base with shorter leases.
- Zoned schools: Sawgrass Bay Elementary School (math 45% / reading 46%, grade D-, #1,247 of 2,144 statewide, top 59%, 735 students, 42% FRL); Windy Hill Middle School (math 52% / reading 53%, grade C+, #213 of 571 statewide, top 38%, 1,280 students, 35% FRL); East Ridge High School (math 41% / reading 52%, grade D-, #216 of 667 statewide, top 33%, 2,604 students, 31% FRL).
- Market conditions: Rents falling (-3.5%/yr); 729 active listings in the ZIP; 6 comparable units currently listed for rent nearby; rentals at typical pace (median 20d on market — plan ~3-4 weeks tenant-placement turnaround); solid renter incomes; 4,799 units permitted in Lake County in 2024 (814 in 5+ unit buildings).
- At $3,386/mo this rent would consume 54% of the median local household income ($75k/yr) (locally 953% of renters already pay >50% of income on rent) — very limited rent-growth headroom before tenants either downsize or default.
Forward outlook
- In year one you build about $2k of equity ($3k loan paydown + $-1k appreciation (-0.3% local appreciation)).
- Lake County population projected at +37% by 2050 — long-run rental-demand tailwind backs the buy-and-hold thesis.
- By year 10, paydown + projected appreciation supports a ~$31k cash-out refi (75% LTV) — recoverable capital for the next deal without selling this one.
Negotiation context
- It's been on market 112 days — a 9% lower offer ($382k) is reasonable based on typical stale-listing flexibility.
- 9 sale attempts since 21y ago with the ask held roughly flat each time — persistent listings suggest the price (not the market) is what's stuck; bring a comps-based counter.
Risks & watch-outs
- Climate carrying-cost: severe wind risk, 99% chance of damaging wind over 30y; major wildfire risk; extreme-heat days projected 7→25/yr by 2055 (HVAC capex compounding) — expect insurance premiums to compound above CPI over the hold.
Questions for the listing agent
- What do current leases actually rent for vs. the listed asking? Can we see a recent rent roll and the last 12 months of T-12 income?
- It's been on market 112 days. Have you received any prior offers? Is the seller open to a 19% concession, seller financing, or rate buy-down credit?
- What does the HOA fee cover, when was the last increase, and are there any pending special assessments or reserve-fund shortfalls?
- Why hasn't it sold? Are there any deal-killer items the seller is aware of (foundation, flood, title, zoning, code violations)?
- Is there a deadline driving the sale (1031 exchange, divorce, estate, relocation)? That informs how much negotiation room exists.
- Schools are F-rated, which usually means shorter tenancies and higher turnover. Who's the typical renter profile here, and what's been the actual vacancy rate?
- The area grade is low — what's the realistic commute time and amenity access for the typical tenant pool here? Any planned neighborhood developments (good or bad) we should know about?
- What's the average days-on-market for RENTAL listings here right now (not sales)? A rising rental-DOM trend means longer vacancies and softer asking-rent achievability than the comps imply.
- What's the recent tenant-quality profile in this submarket — average credit score on applications, eviction rate, late-payment / NSF rate, and stable-employment percentage? A property-management company in the area should have these aggregated.
- How much new for-sale + rental construction is in the pipeline within 1–3 miles? Heavy new supply typically softens prices + rents 12–24 months out; constrained supply supports both.
Investment metrics
- 1% rule
- 0.81% ✗
- Cap rate
- 5.70%
- Cash-on-cash
- -2.14%
- DSCR
- 0.90
- GRM
- 10.3
CMA / ARV
- ARV (on-the-fly)
- $697,641
- Comps found
- 12
Show comp detail 12 sales within ~0.75 mi
| Address | Dist | Beds/Ba | Sqft | Sold | Price | $/sf | Match |
|---|---|---|---|---|---|---|---|
| 1434 Blue Horizon Dr | 0.06mi | 5/3.5 (-1) | 3,155 (+8%) | 2mo | $503,000 | $159 | 77 |
| 1513 Blue Sky Way | 0.06mi | 5/3.0 (-1) | 3,064 (+5%) | 12mo | $439,900 | $144 | 72 |
| 16838 Glenbrook Blvd | 0.21mi | 5/4.0 (-1) | 2,687 (-8%) | 13mo | $470,000 | $175 | 59 |
| 16837 Sunrise Vista Dr | 0.08mi | 6/5.0 | 3,167 (+8%) | 23mo | $500,000 | $158 | 57 |
| 1241 Emerald Row St | 0.68mi | 5/5.0 (-1) | 2,611 (-11%) | 17mo | $724,640 | $278 | 25 |
| 16237 Saint Kitts Cir | 0.60mi | 5/5.5 (-1) | 2,611 (-11%) | 23mo | $718,640 | $275 | 22 |
| 16211 Trinidad Way | 0.66mi | 5/5.5 (-1) | 2,611 (-11%) | 22mo | $748,980 | $287 | 20 |
| 16217 Saint Kitts Cir | 0.63mi | 7/5.5 (+1) | 3,286 (+13%) | 22mo | $784,830 | $239 | 18 |
| 16212 Saint Kitts Cir | 0.63mi | 5/5.5 (-1) | 3,286 (+13%) | 23mo | $748,970 | $228 | 17 |
| 16208 Saint Kitts Cir | 0.64mi | 7/5.5 (+1) | 3,286 (+13%) | 23mo | $799,000 | $243 | 17 |
| 16200 Saint Kitts | 0.66mi | 7/5.5 (+1) | 3,286 (+13%) | 23mo | $787,510 | $240 | 16 |
| 1253 Emerald Row St | 0.69mi | 7/5.5 (+1) | 3,286 (+13%) | 23mo | $779,540 | $237 | 14 |
Match score weights: distance 35% · size 25% · config 20% · recency 20%. Top-matched comps best support the ARV.
Projected returns pro-forma
-0.33% appreciation · 0.0% rent growth · sell at horizon
- IRR
- -8.0%
- Equity multiple
- 0.64×
- Total profit
- $-41,960
- Equity at exit
- $115,043
- IRR
- -4.0%
- Equity multiple
- 0.63×
- Total profit
- $-43,991
- Equity at exit
- $132,908
Cash invested: $117,572 (down + closing). Projections, not guarantees.
Landlord ↔ Tenant lean methodology
- Overall (STATE)
- 87 Strongly Landlord-Friendly
- State Florida
- 87 Strongly Landlord-Friendly · R+3
- County
- — inherits STATE
- City
- — inherits STATE
ZIP-level market 34714
- Home prices YoY
- -0.1%
- Rents YoY
- -3.5%
- Active inventory
- 729
- Price-to-rent
- 10.3×
Monthly cashflow live
- Estimated rent
- $3,386 high interval (Pro) →
- Mortgage (P&I)
- −$2,202
- Tax from tax record
- −$455 /mo · $5,458/yr
- Insurance
- −$175
- HOA
- −$52
- Vacancy / Maint / Mgmt
- −$711
- Net cashflow
- $-209
Break-even live
Sensitivity live
| Price | -10% $28 | -5% $-90 | +0% $-209 | +5% $-328 | +10% $-447 |
|---|---|---|---|---|---|
| Rent | -10% $-477 | -5% $-343 | +0% $-209 | +5% $-75 | +10% $58 |
| Rate | -1.0pp $2 | -0.5pp $-102 | base $-209 | +0.5pp $-318 | +1.0pp $-429 |
UW: 25.0% down · 7.5% · 30yr · 1.5% tax · 5.0% vac · 8.0% maint · 8.0% mgmt
Financing live
Cash to close
- Down payment
- $104,975
- Closing costs
- $12,597
- Reserves months
- —
- Total cash needed
- —
Loan-product check · same deal, 3 products live
Conventional
25% down · 7.5% · 30yr
- Down + closing
- —
- Monthly P&I
- —
- Monthly cashflow
- —
- DSCR
- —
- Eligible?
- —
Personal DTI + credit; lowest rate.
DSCR
20% down · 8.5% · 30yr
- Down + closing
- —
- Monthly P&I
- —
- Monthly cashflow
- —
- DSCR
- —
- Eligible?
- —
No personal income docs; deal must DSCR.
Hard money
10% down · 12.0% · 12mo
- Down + closing
- —
- Monthly P&I
- —
- Monthly cashflow
- —
- DSCR
- —
- Eligible?
- —
Short-term bridge; refi at stabilization.
Rent comps 6 comps
| Address | Beds | Baths | Sqft | Rent | $/sqft | DOM | Units | Dist |
|---|---|---|---|---|---|---|---|---|
| 17213 Cagan Crossings Blvd Clermont, FL | 5.0 | 3.0 | 2894 | $3,140 | $1.09 | 4d | 1 | 0.88mi |
| 17311 Million Lakes Ct Clermont, FL | 5.0 | 3.0 | 2894 | $3,140 | $1.09 | 26d | 1 | 0.97mi |
| 17311 Million Lakes Ct Clermont, FL | 5.0 | 3.0 | 2894 | $3,140 | $1.09 | 7d | 1 | 0.97mi |
| 17311 Million Lakes Ct Clermont, FL | 5.0 | 3.0 | 2894 | $3,140 | $1.09 | 5d | 1 | 0.97mi |
| 17315 Million Lakes Ct Clermont, FL | 5.0 | 3.5 | 2894 | $3,500 | $1.21 | 20d | 1 | 0.97mi |
| 12182 Eastmoor Dr Winter Garden, FL | 5.0 | 4.0 | 3826 | $4,300 | $1.12 | 26d | 1 | 1.47mi |
HOA detail
- Monthly dues
- $52 · $624/yr
Listing history 39 events
-
2026-06-21days on market $419,900 Active 112 DOM
-
2026-06-18days on market $419,900 Active 109 DOM
-
2026-06-17days on market $419,900 Active 108 DOM
-
2026-06-16days on market $419,900 Active 107 DOM
-
2026-06-15days on market $419,900 Active 106 DOM
-
2026-06-13days on market $419,900 Active 104 DOM
-
2026-06-09days on market $419,900 Active 100 DOM
-
2026-06-08days on market $419,900 Active 99 DOM
-
2026-06-07days on market $419,900 Active 98 DOM
-
2026-06-04days on market $419,900 Active 95 DOM
-
2026-06-03days on market $419,900 Active 94 DOM
-
2026-06-02days on market $419,900 Active 93 DOM
-
2026-06-01days on market $419,900 Active 92 DOM
-
2026-05-31days on market $419,900 Active 91 DOM
-
2026-04-27price $419,900
-
2026-04-14price $429,900
-
2026-03-01$434,900 Active
-
2026-02-23historical
-
2025-10-07$449,000 Active
-
2025-09-09historical
-
2025-07-28price $429,000
-
2025-05-14$437,999 Active
-
2022-05-04soldstatus $392,000
-
2022-04-22soldstatus $392,000 Closed
-
2022-03-07status Pending
-
2022-03-03status Active
-
2022-03-01status Pending
-
2022-02-24$430,000 Active
-
2019-01-22historical
-
2018-10-08price $249,950
-
2018-08-24price $254,950
-
2018-06-25$259,950 Active
-
2009-02-24soldstatus $125,000
-
2008-12-04$129,900
-
2008-09-11historical
-
2008-01-04$260,000
-
2005-06-14soldstatus $299,000
-
2005-04-27soldstatus $299,000
-
2005-02-14$299,000
ⓘ Source: listings_history table (triggers on properties + properties_extension) + one-shot
backfill from property_details.listing_events for pre-trigger history.
Tax reassessment forecast FL · Resets to sale price
- Current annual tax
- $5,458 · $455/mo
- Projected year-2 tax
- $5,458 · $455/mo
- Expected delta
- $0/yr ($0/mo · 0.0%)
ⓘ Screening estimate from a state-policy table — verify with the county assessor before closing.
Climate risk First Street
- Flood 1/10 Low FEMA zone X (unshaded) · 0% chance over 30 yrs
- Wildfire 6/10 Major
- Heat 9/10 Extreme 7 d/yr ≥107°F today · 25 d/yr by 30 yrs out
- Wind 9/10 Extreme 99% chance of damaging wind over 30 yrs
- Air quality 2/10 Low 1 unhealthy d/yr today · 1 by 30 yrs out
Nearby sold comps map
Loading sold comps map…
Walkable amenities ~0.75 mi
Loading nearby amenities…
Taxation est. · year 1
- Rental income
- $40,626
- − Mortgage interest
- −$23,521
- − Property taxes
- −$5,458
- − Insurance
- −$2,100
- − Repairs & maintenance
- −$3,250
- − Management
- −$3,250
- − HOA
- −$624
- − Depreciation
- −$12,215
- Taxable loss
- −$9,792
- Est. tax savings @ 24.0%
- +$2,350
- After-tax cash flow
- $-161/yr
For passive investors: Depreciation is non-cash, so a rental often shows a tax loss while cash-flowing — sheltering income. Rental losses are passive: they offset passive income freely, and up to $25,000/yr can offset ordinary (W-2) income if you actively participate and your MAGI is under $100k (phasing out to $0 by $150k); unused losses carry forward. On sale, claimed depreciation is recaptured at up to 25%, and gains may owe capital-gains tax (a 1031 exchange can defer both). Figures are a year-1 estimate at your 24.0% rate — not tax advice; consult a CPA.
Schools (NCES district)
- District
- Lake
- NCES district ID
- 1201050
- Math proficiency
- 49% ▼ -7.00%
- Reading proficiency
- 50% ▼ -4.00%
- Median HH income
- $46,632
- Composite
- 42.05/100
- National rank
- #3327
- State rank
- #37 of 73 in FL
Livability — Four Corners
- Score
- 69/100
- State rank
- #453
- US rank
- #8218
Category grades
Schools grade is shown separately in the Schools card above.
Census & demographics
- Census place
- Four Corners, FL
- County
- Lake County · 364,602 people
- City population
- 27,422
- Metro
- Orlando-Kissimmee-Sanford, FL
- Population (ZIP)
- 28,200
- Household income
- $75,392
- Rent vs Own
- Severe rent burden
- 953.0
Population outlook (Lake County) Hauer SSP2
- Today (2025)
- 386,640 people
- By 2030
- 417,107 · +7.9%
- By 2040
- 476,676 · +23.3%
- By 2050
- 531,296 · +37.4%
- By 2075
- 648,303 · +67.7%
- By 2100
- 698,530 · +80.7%
Race, ethnicity, and origin ACS 2023
- Neighborhood character
- Diverse neighborhood (Simpson 0.59)
- Race & ethnicity
- White 56% Hispanic / Latino 30% Two or more races 25% Black 6% Asian 1%
- Hispanic origin (detail)
- Mexican 2% Puerto Rican 17% Dominican 2%
- Common ancestry
- Romanian 3% Lithuanian 3% Italian 2%
- Foreign-born
- 13% · Canada, Jamaica
- Languages at home
- 76% English-only · Spanish 19% Other Indo-European 1% Other Asian/Pacific 1%
Political lean MEDSL · Lake
- 2024 margin
- Strong R (+24.7) · D 37.3% · R 62.0%
- 2008→2024 swing
- -11.2pp toward R · 2008: -13.5pp · 2024: -24.7pp
- All cycles
- 2024: R+24.7 2020: R+20.0 2016: R+23.1 2012: R+17.1 2008: R+13.5
Not yet ingested
- Civics
- —
Market trends
- HPI YoY
- ▼ -0.33%
- Current HPI
- 256.1331
- Rent YoY
- ▼ -3.46%
- Metro
- Orlando-Kissimmee-Sanford, FL
- State GDP YoY
- ▲ 3.28%
- F500 in state
- 36
Industry mix (Fortune 500 HQ in FL)
| Industry | F500 HQs | Revenue |
|---|---|---|
| Industrial Technology | 2 | $29B |
|
||
| Insurance | 2 | $17B |
|
||
| Retail | 1 | $60B |
|
||
| Technology Distribution | 1 | $58B |
|
||
| Homebuilding | 1 | $35B |
|
||
| Technology Manufacturing | 1 | $35B |
|
||
Price history
+40.4% since first listed25 events — show timeline
- 2026-04-27 Price Changed $419,900 Stellar MLS as Distributed by MLS Grid
- 2026-04-14 Price Changed $429,900 Stellar MLS as Distributed by MLS Grid
- 2026-03-01 Listed $434,900 Stellar MLS as Distributed by MLS Grid
- 2026-02-23 Listing Removed — Stellar MLS as Distributed by MLS Grid
- 2025-10-07 Listed $449,000 Stellar MLS as Distributed by MLS Grid
- 2025-09-09 Listing Removed — Stellar MLS as Distributed by MLS Grid
- 2025-07-28 Price Changed $429,000 Stellar MLS as Distributed by MLS Grid
- 2025-05-14 Listed $437,999 Stellar MLS as Distributed by MLS Grid
- 2022-05-04 Sold (Public Records) $392,000 Public Records
- 2022-04-22 Sold (MLS) $392,000 Stellar MLS as Distributed by MLS Grid
- 2022-03-07 Pending — Stellar MLS as Distributed by MLS Grid
- 2022-03-03 Relisted — Stellar MLS as Distributed by MLS Grid
- 2022-03-01 Pending — Stellar MLS as Distributed by MLS Grid
- 2022-02-24 Listed $430,000 Stellar MLS as Distributed by MLS Grid
- 2019-01-22 Listing Removed — Stellar MLS as Distributed by MLS Grid
- 2018-10-08 Price Changed $249,950 Stellar MLS as Distributed by MLS Grid
- 2018-08-24 Price Changed $254,950 Stellar MLS as Distributed by MLS Grid
- 2018-06-25 Listed $259,950 Stellar MLS as Distributed by MLS Grid
- 2009-02-24 Sold (MLS) $125,000 Stellar MLS as Distributed by MLS Grid
- 2008-12-04 Listed $129,900 Stellar MLS as Distributed by MLS Grid
- 2008-09-11 Listing Removed — Stellar MLS as Distributed by MLS Grid
- 2008-01-04 Listed $260,000 Stellar MLS as Distributed by MLS Grid
- 2005-06-14 Sold (Public Records) $299,000 Public Records
- 2005-04-27 Sold (MLS) $299,000 Stellar MLS as Distributed by MLS Grid
- 2005-02-14 Listed $299,000 Stellar MLS as Distributed by MLS Grid
Property tax history
+8.7%/yrLatest (2025): $5,458 · -0.2% YoY. Source: county tax records.
Cash-flow waterfall
monthlySold comps — $/sqft
last 12 mo · ≤1 miLoading sold comps…