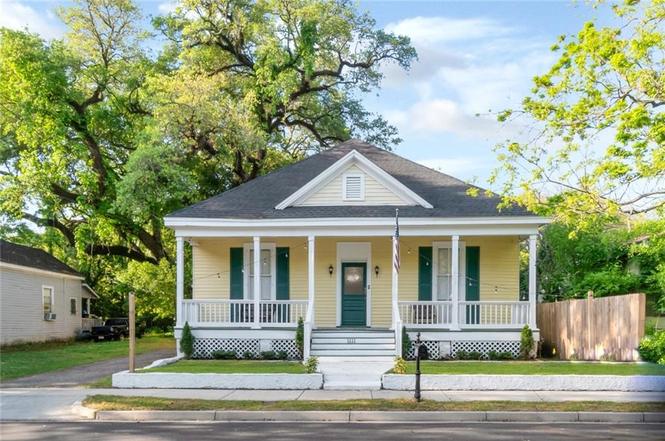
1111 Texas St · Mobile, AL
Flood risk 3/10 · Minor
- FEMA flood zone
- X (unshaded)
- Chance of flooding over 30 yrs
- 0.1%
- Est. flood insurance / yr
- $507 – $1,088
Fire risk 1/10 · Minimal
- Est. fire insurance / yr
- $916 – $1,700
Heat risk 9/10 · Severe
- Hot days now (above 105°F)
- 7 days/yr
- Hot days in 30 yrs
- 21 days/yr
Wind risk 9/10 · Severe
- Chance of severe wind over 30 yrs
- 99.0%
Air-quality risk 2/10 · Minimal
- Unhealthy air days now
- 1 days/yr
- Unhealthy air days in 30 yrs
- 1 days/yr
Risk factors via First Street. Map © Google.
Why this score? — see what drove the D+ grade
The composite is a weighted blend of 9 inputs, each scored 0–100. Each bar is that input's sub-score; the figure is the points it added to the 100-point composite (weight × sub-score).
- Cash flow +15.0/30.0
- ARV discount +15.0/15.0
- DSCR +4.6/10.0
- Livability +3.8/5.0
- 1% rule +3.4/10.0
- Rent growth +3.4/5.0
- Condition / age +2.5/5.0
- Schools +2.3/10.0
- Appreciation +0.0/10.0
$225,000
🖨 Deal sheet 📄 Offer letter ✓ Due diligence
Listing remarks
Come enjoy Southern porch life in this Oakleigh Garden District home! This 3/2 was completely remodeled and is turnkey ready. Lots of charm of yesteryear, yet super low maintenance. Formal living and dining rooms w/ high ceilings and lots of light and charm. The home has modern updates including a new kitchen with stone countertops, new baths and mechanicals. Freshly painted inside and out, plus gleaming wood floors. The 3 bedrooms are very flexible - with the primary suite located in the back and very private. Home is located a couple blocks away from Washington Square, restaurants, downtown and close to I-10 and Gulf Coast beaches. Home is also near the new international airport. * * Al
Key facts
- New kitchen
- New baths
- Completely remodeled
Tags
Property features AI
Exterior
- Parking: Driveway parking for 2 vehicles
- Utilities: Cable available; Electricity available (110 volts); Natural gas available; Phone available; Underground utilities; Sewer: other
- Home design: Single-family residence; Located in Oakleigh Historical District
- Construction: Built in 1920; Wood siding; Wood-framed windows; Composition/shingle roof; Block, brick/mortar, and pier/pillar foundation
- Exterior features: Wood backyard fencing; Property offers a view
Interior
- Kitchen: Dishwasher; Gas range; Microwave; Refrigerator; ENERGY STAR qualified appliances
- Bedrooms: 3 bedrooms
- Flooring: Ceramic tile; Hardwood
- Bathrooms: 2 full bathrooms
- Heating & cooling: Central heating; Central air conditioning
- Interior features: Crown molding; 9-foot (or taller) main-level ceilings; Separate dining room; Eat-in kitchen with white cabinets; Kitchen island; Breakfast bar; Stone counters
Neighborhood map
What this means for you Summary
Snapshot
- This is a 3-bed/2.0-bath single-family listed at $225k.
Deal economics
- At list price, monthly cash flow is $70 ($839/yr) — positive.
- The deal already cash-flows at list — no discount required.
- To meet the 1% rule (rent ≥ 1% of price), the offer needs to be $189k (16.0% below list).
- Recommended offer: $189k (16.0% below list) — sets the bar for 1% rule.
- Cap rate 6.7% vs local median 4.9% in Mobile — top-decile yield for the area; either an underpriced asset or a hidden risk that comps aren't pricing in. Stress-test before assuming the spread holds.
Location & tenants
- Location reads 75/100 on livability (#20 in AL, #4,262 nationally) — a middle-class / working-renter tenant base. Strengths: commute A+, cost of living A+, housing A+; Watch: crime F, employment D-.
- Mobile County (urban): math 15% / reading 39% proficiency, ranked #81 of 129 in AL (top 63%) — low school quality limits family demand, transient renter base, plan for 1-2y turnover; 67% free/reduced lunch — lower-income household profile, screen leases tightly.
- Zoned schools: Murphy High School (math 10% / reading 19%, grade F, #220 of 305 statewide, top 77%, 1,254 students, 66% FRL) — zoned schools at 66% FRL track the district average.
- Zoned-school proficiency averages 14% at this address vs 27% district-wide (-12 pts) — the specific schools serving this property underperform the Mobile County average; the district grade overstates school quality for this exact location.
- Market conditions: Rents rising (+3.8%/yr); 93 active listings in the ZIP; 19 comparable units currently listed for rent nearby; rentals lingering (median 44d on market — plan ~5-8 weeks vacancy on turnover, expect pricing pressure); 53% of comp listings sitting > 30 days — soft ceiling on asking rent; 1,678 units permitted in Mobile County in 2024 (264 in 5+ unit buildings).
- This rent runs 34% of the median local income ($66k/yr) — at the standard rent-burdened threshold; future hikes will face affordability resistance.
Forward outlook
- Local home prices are declining (-3.0%/yr); year-one equity from $2k of loan paydown is wiped out by about $7k of value loss. Plan a longer hold.
- Mobile County population projected to shrink 8% by 2050 — rents likely to lag national; underwrite the cash flow, not the appreciation.
Negotiation context
- It's been on market 369 days — a 12% lower offer ($198k) is reasonable based on typical stale-listing flexibility.
- 3 sale attempts; this cycle's ask has dropped $74k (25%) from the opening price — seller is motivated, your offer sets the floor, not the list.
Risks & watch-outs
- Watch-outs: built in 1920 — expect roof / HVAC / electrical / plumbing capex.
- Climate carrying-cost: severe wind risk, 99% chance of damaging wind over 30y; extreme-heat days projected 7→21/yr by 2055 (HVAC capex compounding) — expect insurance premiums to compound above CPI over the hold.
Questions for the listing agent
- It's been on market 369 days. Have you received any prior offers? Is the seller open to a 16% concession, seller financing, or rate buy-down credit?
- Built in 1920 — when were the roof, HVAC, electrical panel, plumbing, and water heater last replaced?
- Why hasn't it sold? Are there any deal-killer items the seller is aware of (foundation, flood, title, zoning, code violations)?
- Is there a deadline driving the sale (1031 exchange, divorce, estate, relocation)? That informs how much negotiation room exists.
- Schools are D-rated, which usually means shorter tenancies and higher turnover. Who's the typical renter profile here, and what's been the actual vacancy rate?
- Crime grade is F in this area — have there been break-ins, vandalism, or insurance claims at this property in the last 3 years? What carrier currently insures it and at what premium?
- The area grade is low — what's the realistic commute time and amenity access for the typical tenant pool here? Any planned neighborhood developments (good or bad) we should know about?
- What's the average days-on-market for RENTAL listings here right now (not sales)? A rising rental-DOM trend means longer vacancies and softer asking-rent achievability than the comps imply.
- What's the recent tenant-quality profile in this submarket — average credit score on applications, eviction rate, late-payment / NSF rate, and stable-employment percentage? A property-management company in the area should have these aggregated.
- How much new for-sale + rental construction is in the pipeline within 1–3 miles? Heavy new supply typically softens prices + rents 12–24 months out; constrained supply supports both.
Investment metrics
- 1% rule
- 0.84% ✗
- Cap rate
- 6.67%
- Cash-on-cash
- 1.33%
- DSCR
- 1.06
- GRM
- 9.9
CMA / ARV
- ARV (on-the-fly)
- $286,896
- Comps found
- 12
Show comp detail 12 sales within ~0.75 mi
| Address | Dist | Beds/Ba | Sqft | Sold | Price | $/sf | Match |
|---|---|---|---|---|---|---|---|
| 958 Elmira St | 0.25mi | 3/1.0 | 1,600 (-4%) | 6mo | $64,000 | $40 | 72 |
| 402 Chatham St | 0.17mi | 2/2.0 (-1) | 1,602 (-4%) | 11mo | $215,000 | $134 | 71 |
| 955 Charleston St | 0.44mi | 2/2.0 (-1) | 1,730 (+4%) | 1mo | $160,000 | $92 | 67 |
| 1123 Palmetto St | 0.26mi | 3/2.0 | 1,854 (+11%) | 6mo | $358,000 | $193 | 64 |
| 361 Regina Ave | 0.22mi | 3/2.0 | 1,860 (+12%) | 8mo | $265,000 | $142 | 64 |
| 350 Broad St S | 0.40mi | 3/2.5 | 1,731 (+4%) | 13mo | $300,000 | $173 | 62 |
| 308 S Ann St | 0.42mi | 2/2.0 (-1) | 1,717 (+3%) | 13mo | $329,000 | $192 | 60 |
| 1367 Brown St | 0.69mi | 2/2.0 (-1) | 1,700 (+2%) | 3mo | $293,000 | $172 | 57 |
| 300 Marine St | 0.39mi | 2/2.0 (-1) | 1,548 (-7%) | 9mo | $389,000 | $251 | 57 |
| 456 Broad St S | 0.34mi | 3/1.5 | 1,915 (+15%) | 1mo | $142,500 | $74 | 56 |
| 451 Wisconsin Ave | 0.70mi | 3/2.0 | 1,512 (-9%) | 1mo | $98,000 | $65 | 51 |
| 1509 Monroe St | 0.71mi | 3/2.0 | 1,430 (-14%) | 10mo | $287,000 | $201 | 35 |
Match score weights: distance 35% · size 25% · config 20% · recency 20%. Top-matched comps best support the ARV.
Projected returns pro-forma
-3.0% appreciation · 3.78% rent growth · sell at horizon
- IRR
- -13.4%
- Equity multiple
- 0.51×
- Total profit
- $-30,563
- Equity at exit
- $33,548
- IRR
- -3.4%
- Equity multiple
- 0.76×
- Total profit
- $-14,860
- Equity at exit
- $19,454
Cash invested: $63,000 (down + closing). Projections, not guarantees.
Landlord ↔ Tenant lean methodology
- Overall (STATE)
- 90 Strongly Landlord-Friendly
- State Alabama
- 90 Strongly Landlord-Friendly · R+15
- County
- — inherits STATE
- City
- — inherits STATE
ZIP-level market 36604
- Rents YoY
- 3.8%
- Active inventory
- 93
- Price-to-rent
- 9.9×
Monthly cashflow live
- Estimated rent
- $1,890 high interval (Pro) →
- Mortgage (P&I)
- −$1,180
- Tax from tax record
- −$149 /mo · $1,793/yr
- Insurance
- −$94
- HOA
- −$0
- Vacancy / Maint / Mgmt
- −$397
- Net cashflow
- $70
Break-even live
UW: 25.0% down · 7.5% · 30yr · 1.5% tax · 5.0% vac · 8.0% maint · 8.0% mgmt
Financing live
Cash to close
- Down payment
- $56,250
- Closing costs
- $6,750
- Reserves months
- —
- Total cash needed
- —
Loan-product check · same deal, 3 products live
Conventional
25% down · 7.5% · 30yr
- Down + closing
- —
- Monthly P&I
- —
- Monthly cashflow
- —
- DSCR
- —
- Eligible?
- —
Personal DTI + credit; lowest rate.
DSCR
20% down · 8.5% · 30yr
- Down + closing
- —
- Monthly P&I
- —
- Monthly cashflow
- —
- DSCR
- —
- Eligible?
- —
No personal income docs; deal must DSCR.
Hard money
10% down · 12.0% · 12mo
- Down + closing
- —
- Monthly P&I
- —
- Monthly cashflow
- —
- DSCR
- —
- Eligible?
- —
Short-term bridge; refi at stabilization.
Rent comps 19 comps
| Address | Beds | Baths | Sqft | Rent | $/sqft | DOM | Units | Dist |
|---|---|---|---|---|---|---|---|---|
| 957 Savannah St Mobile, AL | 2.0 | 1.5 | 1054 | $1,400 | $1.33 | 21d | 1 | 0.31mi |
| 711 Marine St Mobile, AL | 2.0 | 1.0 | 1100 | $1,150 | $1.05 | 44d | 1 | 0.44mi |
| 1141 Montauk Ave Unit 1043864P Mobile, AL | 3.0 | 2.0 | 1420 | $2,741 | $1.93 | 14d | 1 | 0.51mi |
| 1417 Monroe St Mobile, AL | 2.0 | 1.0 | 1064 | $1,350 | $1.27 | 44d | 1 | 0.58mi |
| 814 S Broad St Unit 1043690P Mobile, AL | 3.0 | 2.0 | 1991 | $3,562 | $1.79 | 14d | 1 | 0.62mi |
| 84 S Lafayette St Unit 1043577P Mobile, AL | 3.0 | 2.0 | 1496 | $3,116 | $2.08 | 14d | 1 | 0.75mi |
| 961 Old Shell Rd Unit A Mobile, AL | 3.0 | 2.5 | 1600 | $1,295 | $0.81 | 44d | 1 | 0.77mi |
| 107 Michael Donald Ave Unit 1043461P Mobile, AL | 4.0 | 3.5 | 2195 | $3,962 | $1.81 | 14d | 1 | 0.85mi |
| 57 N Ann St Unit 1043453P Mobile, AL | 2.0 | 2.0 | 1065 | $2,015 | $1.89 | 21d | 1 | 0.86mi |
| 811 Gorgas St Mobile, AL | 4.0 | 1.0 | 1300 | $1,310 | $1.01 | 44d | 1 | 0.89mi |
| 1204 Seneca St Mobile, AL | 3.0 | 2.0 | 1425 | $1,345 | $0.94 | 14d | 1 | 0.91mi |
| 500 Palmetto St Mobile, AL | 3.0 | 2.0 | 1786 | $1,450 | $0.81 | 44d | 1 | 0.93mi |
| 107 Macy Pl Mobile, AL | 3.0 | 2.0 | 1800 | $2,250 | $1.25 | 44d | 1 | 1.00mi |
| 1321 SpringHill Ave Unit B Mobile, AL | 2.0 | 1.0 | 2006 | $950 | $0.47 | 44d | 1 | 1.08mi |
| 1566 Dauphin St Unit Back Carriage House Mobile, AL | 3.0 | 1.0 | 1300 | $1,200 | $0.92 | 44d | 1 | 1.10mi |
| 1660 Laurel St Mobile, AL | 3.0 | 2.0 | 1768 | $2,200 | $1.24 | 14d | 1 | 1.12mi |
| 412 Dauphin St Mobile, AL | 2.0 | 1.0–2.5 | 1553 | $2,350 | $1.51 | 14d | 2 | 1.15mi |
| 1704 McGill Ave Unit B Mobile, AL | 3.0 | 2.5 | 1500 | $1,750 | $1.17 | 44d | 1 | 1.18mi |
| 122 Demouy Ave Unit 1/2 Mobile, AL | 2.0 | 1.0 | 1300 | $1,530 | $1.18 | 44d | 1 | 1.43mi |
Listing history 14 events
-
2026-05-01status Pending
-
2026-04-23price $225,000
-
2026-04-23status Active
-
2026-04-22historical
-
2026-03-04price $233,000
-
2026-02-04price $235,000
-
2026-01-14price $236,000
-
2025-10-21status Active
-
2025-10-16historical
-
2025-09-19price $237,000
-
2025-08-08price $268,000
-
2025-07-01price $275,000
-
2025-05-08price $289,000
-
2025-04-21$299,000 Active
ⓘ Source: listings_history table (triggers on properties + properties_extension) + one-shot
backfill from property_details.listing_events for pre-trigger history.
Tax reassessment forecast AL · Resets to sale price
- Current annual tax
- $1,793 · $149/mo
- Projected year-2 tax
- $1,793 · $149/mo
- Expected delta
- $0/yr ($0/mo · 0.0%)
ⓘ Screening estimate from a state-policy table — verify with the county assessor before closing.
Climate risk First Street
- Flood 3/10 Moderate FEMA zone X (unshaded) · 10% chance over 30 yrs
- Wildfire 1/10 Low
- Heat 9/10 Extreme 7 d/yr ≥105°F today · 21 d/yr by 30 yrs out
- Wind 9/10 Extreme 99% chance of damaging wind over 30 yrs
- Air quality 2/10 Low 1 unhealthy d/yr today · 1 by 30 yrs out
Nearby sold comps map
Loading sold comps map…
Walkable amenities ~0.75 mi
Loading nearby amenities…
Taxation est. · year 1
- Rental income
- $22,679
- − Mortgage interest
- −$12,603
- − Property taxes
- −$1,793
- − Insurance
- −$1,125
- − Repairs & maintenance
- −$1,814
- − Management
- −$1,814
- − Depreciation
- −$6,545
- Taxable loss
- −$3,017
- Est. tax savings @ 24.0%
- +$724
- After-tax cash flow
- $1,563/yr
For passive investors: Depreciation is non-cash, so a rental often shows a tax loss while cash-flowing — sheltering income. Rental losses are passive: they offset passive income freely, and up to $25,000/yr can offset ordinary (W-2) income if you actively participate and your MAGI is under $100k (phasing out to $0 by $150k); unused losses carry forward. On sale, claimed depreciation is recaptured at up to 25%, and gains may owe capital-gains tax (a 1031 exchange can defer both). Figures are a year-1 estimate at your 24.0% rate — not tax advice; consult a CPA.
Schools (NCES district)
- District
- Mobile County
- NCES district ID
- 0102370
- Math proficiency
- 15% ▼ -28.00%
- Reading proficiency
- 39% ▬ 0.00%
- Median HH income
- $42,455
- Composite
- 22.9/100
- National rank
- #8002
- State rank
- #81 of 129 in AL
Livability — Mobile
- Score
- 75/100
- State rank
- #20
- US rank
- #4262
Category grades
Schools grade is shown separately in the Schools card above.
Census & demographics
- Census place
- Mobile, AL
- County
- Mobile County · 246,577 people
- City population
- 205,729
- Metro
- Mobile, AL
- Population (ZIP)
- 8,836
- Household income
- $66,357
- Rent vs Own
- Severe rent burden
- 452.0
Population outlook (Mobile County) Hauer SSP2
- Today (2025)
- 415,303 people
- By 2030
- 411,755 · -0.9%
- By 2040
- 399,670 · -3.8%
- By 2050
- 382,616 · -7.9%
- By 2075
- 337,353 · -18.8%
- By 2100
- 283,391 · -31.8%
Race, ethnicity, and origin ACS 2023
- Neighborhood character
- Diverse neighborhood (Simpson 0.56)
- Race & ethnicity
- White 51% Black 42% Two or more races 3% Hispanic / Latino 2%
- Common ancestry
- Lithuanian 4% Serbian 2% Slovak 2%
- Foreign-born
- 2% · Canada, China
- Languages at home
- 97% English-only · Spanish 2%
Political lean MEDSL · Mobile
- 2024 margin
- R (+16.4) · D 41.3% · R 57.7%
- 2008→2024 swing
- -7.7pp toward R · 2008: -8.7pp · 2024: -16.4pp
- All cycles
- 2024: R+16.4 2020: R+11.9 2016: R+13.9 2012: R+9.3 2008: R+8.7
Not yet ingested
- Civics
- —
Market trends
- HPI YoY
- ▼ -143.27%
- Current HPI
- 205.7241
- Rent YoY
- ▲ 3.78%
- Metro
- Mobile, AL
- State GDP YoY
- ▲ 2.94%
- F500 in state
- 4
Industry mix (Fortune 500 HQ in AL)
| Industry | F500 HQs | Revenue |
|---|---|---|
| Financial Services | 1 | $8B |
|
||
| Healthcare | 1 | $5B |
|
||
Price history
-24.7% since first listed14 events — show timeline
- 2026-05-01 Pending — GCMLS AL
- 2026-04-23 Price Changed $225,000 GCMLS AL
- 2026-04-23 Relisted — GCMLS AL
- 2026-04-22 Delisted — GCMLS AL
- 2026-03-04 Price Changed $233,000 GCMLS AL
- 2026-02-04 Price Changed $235,000 GCMLS AL
- 2026-01-14 Price Changed $236,000 GCMLS AL
- 2025-10-21 Relisted — GCMLS AL
- 2025-10-16 Delisted — GCMLS AL
- 2025-09-19 Price Changed $237,000 GCMLS AL
- 2025-08-08 Price Changed $268,000 GCMLS AL
- 2025-07-01 Price Changed $275,000 GCMLS AL
- 2025-05-08 Price Changed $289,000 GCMLS AL
- 2025-04-21 Listed $299,000 GCMLS AL
Property tax history
+16.6%/yrLatest (2023): $1,793 · +68.1% YoY. Source: county tax records.
Cash-flow waterfall
monthlySold comps — $/sqft
last 12 mo · ≤1 miLoading sold comps…