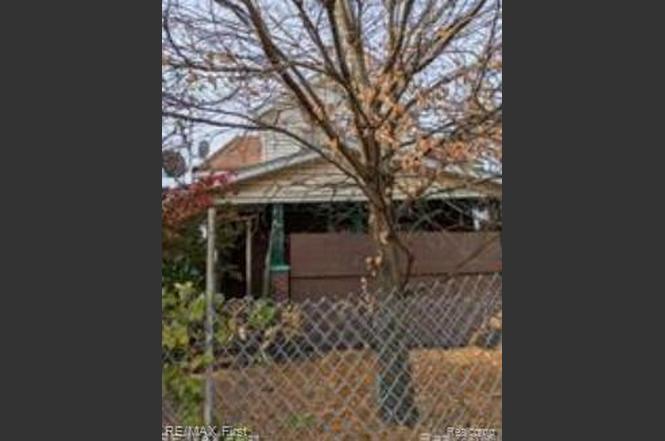
20105 Hawthorne St · Detroit, MI
Flood risk 3/10 · Minor
- FEMA flood zone
- X (unshaded)
- Chance of flooding over 30 yrs
- 0.2%
- Est. flood insurance / yr
- $473 – $860
Fire risk 1/10 · Minimal
- Est. fire insurance / yr
- $784 – $1,456
Heat risk 3/10 · Minor
- Hot days now (above 97°F)
- 7 days/yr
- Hot days in 30 yrs
- 15 days/yr
Wind risk 2/10 · Minimal
- Chance of severe wind over 30 yrs
- —
Air-quality risk 4/10 · Minor
- Unhealthy air days now
- 4 days/yr
- Unhealthy air days in 30 yrs
- 6 days/yr
Risk factors via First Street. Map © Google.
Why this score? — see what drove the B- grade
The composite is a weighted blend of 9 inputs, each scored 0–100. Each bar is that input's sub-score; the figure is the points it added to the 100-point composite (weight × sub-score).
- Cash flow +30.0/30.0
- 1% rule +10.0/10.0
- DSCR +10.0/10.0
- ARV discount +7.5/15.0
- Livability +3.7/5.0
- Rent growth +2.5/5.0
- Condition / age +2.5/5.0
- Schools +1.3/10.0
- Appreciation +0.0/10.0
$58,500
🖨 Deal sheet 📄 Offer letter ✓ Due diligence
Listing remarks MLS
Needs updating, but can be a real money maker. Bring your vision. The accuracy of all information, regardless of the source, is not guaranteed or warranted. All information should be indepdently verified. Buyer must provide proof of funds prior to showing. 2 additonal lot included
Key facts
- 3,485 sq ft lot
- Built 1926
- Listed 7 days
Tags
Property features AI
Finance
- Other: Pets not allowed
- Financial info: Operating as residential income (multi-family) with two 2-bedroom units; Unit 1 rent: $950 (unfurnished); Unit 2 rent: $800 (unfurnished)
Exterior
- Parking: On-street parking
- Utilities: Public water; Public sewer; Cable available
- Home design: Multi-family residential property; Two-story building; Residential zoning; 35 x 100 lot (0.08 acre)
- Construction: Shingle siding; Block foundation; Asphalt roof; Built area above grade: 1,764 (total above-grade finished area)
- Exterior features: Covered porch; Porch; Fenced yard; Paved road access
Interior
- Kitchen: No specific kitchen appliances listed
- Bedrooms: Two 2-bedroom units
- Bathrooms: Two full bathrooms (one in each unit)
- Heating & cooling: Forced air heating (natural gas); No central cooling
- Interior features: High speed internet; Gas water heater
- Laundry & utility: Washer hookup; Gas dryer hookup; Unfinished basement
Neighborhood map
What this means for you Summary
Snapshot
- This is a 4-bed/1.5-bath single-family listed at $58k.
Deal economics
- At list price, monthly cash flow is $942 ($11k/yr) — positive.
- The deal already cash-flows at list — no discount required.
- Meets the 1% rule at list price ($2k rent vs $58k).
- Cap rate 25.6% vs local median 10.2% in Detroit — top-decile yield for the area; either an underpriced asset or a hidden risk that comps aren't pricing in. Stress-test before assuming the spread holds.
Location & tenants
- Location reads 73/100 on livability (#218 in MI) — a middle-class / working-renter tenant base. Strengths: amenities A+, commute A+, cost of living A+; Watch: schools F, crime F, employment F.
- Detroit Public Schools Community District (urban): math 10% / reading 24% proficiency, ranked #499 of 540 in MI (top 92%) — low school quality limits family demand, transient renter base, plan for 1-2y turnover; 90% free/reduced lunch — lower-income household profile, screen leases tightly.
- Market conditions: 216 active listings in the ZIP; 9 comparable units currently listed for rent nearby; rentals leasing fast (median 11d on market — plan ~1-2 weeks tenant-placement turnaround); lower-income renter base — watch delinquency; 2,639 units permitted in Wayne County in 2024 (1,216 in 5+ unit buildings).
- At $1,745/mo this rent would consume 55% of the median local household income ($38k/yr) (locally 1192% of renters already pay >50% of income on rent) — very limited rent-growth headroom before tenants either downsize or default.
Forward outlook
- Local home prices are declining (-3.0%/yr); year-one equity from $404 of loan paydown is wiped out by about $2k of value loss. Plan a longer hold.
- Wayne County population projected at -17% by 2050 — secular population decline; favor cash flow + early exit over multi-decade hold.
- At projected returns (-3.0% appreciation + 3.0% rent growth), your $16k cash investment doubles in ~2 years — after that, you're playing with house money.
Negotiation context
- Only 7 days on market — expect competitive offers; lowballing is unlikely to land.
- 6 sale attempts since 18y ago with the ask held roughly flat each time — persistent listings suggest the price (not the market) is what's stuck; bring a comps-based counter.
Risks & watch-outs
- Watch-outs: built in 1926 — expect roof / HVAC / electrical / plumbing capex.
Questions for the listing agent
- Built in 1926 — when were the roof, HVAC, electrical panel, plumbing, and water heater last replaced?
- Is there a deadline driving the sale (1031 exchange, divorce, estate, relocation)? That informs how much negotiation room exists.
- Schools are F-rated, which usually means shorter tenancies and higher turnover. Who's the typical renter profile here, and what's been the actual vacancy rate?
- Crime grade is F in this area — have there been break-ins, vandalism, or insurance claims at this property in the last 3 years? What carrier currently insures it and at what premium?
- What's the average days-on-market for RENTAL listings here right now (not sales)? A rising rental-DOM trend means longer vacancies and softer asking-rent achievability than the comps imply.
- What's the recent tenant-quality profile in this submarket — average credit score on applications, eviction rate, late-payment / NSF rate, and stable-employment percentage? A property-management company in the area should have these aggregated.
- How much new for-sale + rental construction is in the pipeline within 1–3 miles? Heavy new supply typically softens prices + rents 12–24 months out; constrained supply supports both.
Investment metrics
- 1% rule
- 2.98% ✓
- Cap rate
- 25.61%
- Cash-on-cash
- 68.99%
- DSCR
- 4.07
- GRM
- 2.8
CMA / ARV
- ARV (on-the-fly)
- $134,064
- Comps found
- 12
Show comp detail 12 sales within ~0.75 mi
| Address | Dist | Beds/Ba | Sqft | Sold | Price | $/sf | Match |
|---|---|---|---|---|---|---|---|
| 20207 Russell St | 0.14mi | 3/2.0 (-1) | 1,777 (+1%) | 9mo | $135,000 | $76 | 78 |
| 19657 Cardoni St | 0.29mi | 3/1.0 (-1) | 1,765 (+0%) | 4mo | $22,000 | $12 | 76 |
| 20181 Lumpkin St | 0.66mi | 4/2.0 | 1,783 (+1%) | 1mo | $110,000 | $62 | 65 |
| 20172 Hull St | 0.24mi | 4/2.5 | 1,637 (-7%) | 15mo | $44,000 | $27 | 60 |
| 20070 Irvington St | 0.25mi | 3/1.5 (-1) | 1,515 (-14%) | 1mo | $89,900 | $59 | 59 |
| 1106 E Hayes Ave | 0.47mi | 3/2.0 (-1) | 1,936 (+10%) | 8mo | $260,000 | $134 | 48 |
| 20011 Hull St | 0.21mi | 3/2.5 (-1) | 1,500 (-15%) | 12mo | $35,000 | $23 | 46 |
| 1755 E George Ave | 0.62mi | 3/2.5 (-1) | 1,935 (+10%) | 1mo | $290,000 | $150 | 45 |
| 1429 E Milton Ave | 0.58mi | 3/1.0 (-1) | 1,975 (+12%) | 2mo | $190,000 | $96 | 44 |
| 1148 E George Ave | 0.42mi | 3/2.5 (-1) | 2,000 (+13%) | 11mo | $329,900 | $165 | 40 |
| 751 E Maxlow Ave | 0.73mi | 3/1.0 (-1) | 1,591 (-10%) | 8mo | $178,000 | $112 | 36 |
| 19976 Conant St | 0.71mi | 3/2.0 (-1) | 1,500 (-15%) | 12mo | $110,000 | $73 | 25 |
Match score weights: distance 35% · size 25% · config 20% · recency 20%. Top-matched comps best support the ARV.
Projected returns pro-forma
-3.0% appreciation · 3.0% rent growth · sell at horizon
- IRR
- 68.5%
- Equity multiple
- 4.09×
- Total profit
- $50,544
- Equity at exit
- $8,723
- IRR
- 72.6%
- Equity multiple
- 8.41×
- Total profit
- $121,432
- Equity at exit
- $5,058
Cash invested: $16,380 (down + closing). Projections, not guarantees.
Landlord ↔ Tenant lean methodology
- Overall (STATE)
- 62 Landlord-Friendly
- State Michigan
- 62 Landlord-Friendly · EVEN
- County
- — inherits STATE
- City
- — inherits STATE
ZIP-level market 48203
- Home prices YoY
- -23.3%
- Active inventory
- 216
- Price-to-rent
- 2.8×
Monthly cashflow live
- Estimated rent
- $1,745 high interval (Pro) →
- Mortgage (P&I)
- −$307
- Tax from tax record
- −$106 /mo · $1,269/yr
- Insurance
- −$24
- HOA
- −$0
- Vacancy / Maint / Mgmt
- −$366
- Net cashflow
- $942
Break-even live
UW: 25.0% down · 7.5% · 30yr · 1.5% tax · 5.0% vac · 8.0% maint · 8.0% mgmt
Financing live
Cash to close
- Down payment
- $14,625
- Closing costs
- $1,755
- Reserves months
- —
- Total cash needed
- —
Loan-product check · same deal, 3 products live
Conventional
25% down · 7.5% · 30yr
- Down + closing
- —
- Monthly P&I
- —
- Monthly cashflow
- —
- DSCR
- —
- Eligible?
- —
Personal DTI + credit; lowest rate.
DSCR
20% down · 8.5% · 30yr
- Down + closing
- —
- Monthly P&I
- —
- Monthly cashflow
- —
- DSCR
- —
- Eligible?
- —
No personal income docs; deal must DSCR.
Hard money
10% down · 12.0% · 12mo
- Down + closing
- —
- Monthly P&I
- —
- Monthly cashflow
- —
- DSCR
- —
- Eligible?
- —
Short-term bridge; refi at stabilization.
Rent comps 9 comps
| Address | Beds | Baths | Sqft | Rent | $/sqft | DOM | Units | Dist |
|---|---|---|---|---|---|---|---|---|
| 20008 Hull St Highland Park, MI | 5.0 | 2.0 | 1332 | $1,600 | $1.20 | 16d | 1 | 0.22mi |
| 1301 E Muir Ave Hazel Park, MI | 3.0 | 2.0 | 1236 | $1,600 | $1.29 | 21d | 1 | 0.44mi |
| 20015 Lumpkin St Detroit, MI | 4.0 | 3.0 | 2500 | $1,800 | $0.72 | 4d | 1 | 0.61mi |
| 19995 Goddard St Detroit, MI | 4.0 | 1.0 | 1292 | $1,400 | $1.08 | 21d | 1 | 0.78mi |
| 329 W Muir Ave Hazel Park, MI | 4.0 | 2.0 | 1606 | $2,000 | $1.25 | 10d | 1 | 0.81mi |
| 18503 Riopelle St Highland Park, MI | 3.0 | 1.0 | 1254 | $1,250 | $1.00 | 5d | 1 | 1.00mi |
| 1330 E Chesterfield St Ferndale, MI | 4.0 | 2.0 | 1795 | $2,800 | $1.56 | 1d | 1 | 1.06mi |
| 574 W Golden Gate Highland Park, MI | 3.0 | 1.0 | 1315 | $1,300 | $0.99 | 43d | 1 | 1.26mi |
| 19458 Binder St Detroit, MI | 3.0 | 1.5 | 1550 | $1,500 | $0.97 | 3d | 1 | 1.50mi |
Listing history 7 events
-
2026-06-18days on market $58,500 Active 7 DOM
-
2026-06-17days on market $58,500 Active 6 DOM
-
2026-06-16days on market $58,500 Active 5 DOM
-
2026-06-15days on market $58,500 Active 4 DOM
-
2026-06-13days on market $58,500 Active 2 DOM
-
2026-06-13remarks 281-char remark
-
2026-06-13$58,500 Active 1 DOM
ⓘ Source: listings_history table (triggers on properties + properties_extension) + one-shot
backfill from property_details.listing_events for pre-trigger history.
Tax reassessment forecast MI · Partial reset (capped growth)
- Current annual tax
- $1,269 · $106/mo
- Projected year-2 tax
- $1,269 · $106/mo
- Expected delta
- $0/yr ($0/mo · 0.0%)
ⓘ Screening estimate from a state-policy table — verify with the county assessor before closing.
Climate risk First Street
- Flood 3/10 Moderate FEMA zone X (unshaded) · 20% chance over 30 yrs
- Wildfire 1/10 Low
- Heat 3/10 Moderate 7 d/yr ≥97°F today · 15 d/yr by 30 yrs out
- Wind 2/10 Low
- Air quality 4/10 Moderate 4 unhealthy d/yr today · 6 by 30 yrs out
Nearby sold comps map
Loading sold comps map…
Walkable amenities ~0.75 mi
Loading nearby amenities…
Taxation est. · year 1
- Rental income
- $20,940
- − Mortgage interest
- −$3,277
- − Property taxes
- −$1,269
- − Insurance
- −$292
- − Repairs & maintenance
- −$1,675
- − Management
- −$1,675
- − Depreciation
- −$1,702
- Taxable income
- $11,050
- Est. tax owed @ 24.0%
- −$2,652
- After-tax cash flow
- $8,648/yr
For passive investors: Depreciation is non-cash, so a rental often shows a tax loss while cash-flowing — sheltering income. Rental losses are passive: they offset passive income freely, and up to $25,000/yr can offset ordinary (W-2) income if you actively participate and your MAGI is under $100k (phasing out to $0 by $150k); unused losses carry forward. On sale, claimed depreciation is recaptured at up to 25%, and gains may owe capital-gains tax (a 1031 exchange can defer both). Figures are a year-1 estimate at your 24.0% rate — not tax advice; consult a CPA.
Schools (NCES district)
- District
- Detroit Public Schools Community District
- NCES district ID
- 2601103
- Math proficiency
- 10% ▼ -2.00%
- Reading proficiency
- 24% ▲ 6.00%
- Median HH income
- $25,815
- Composite
- 13.06/100
- National rank
- #9564
- State rank
- #499 of 540 in MI
Livability — Detroit
- Score
- 73/100
- State rank
- #218
- US rank
- #5427
Category grades
Schools grade is shown separately in the Schools card above.
Census & demographics
- Census place
- Detroit, MI
- County
- Wayne County · 1,562,939 people
- City population
- 572,865
- Metro
- Detroit-Warren-Dearborn, MI
- Population (ZIP)
- 20,049
- Household income
- $38,404
- Rent vs Own
- Severe rent burden
- 1192.0
Population outlook (Wayne County) Hauer SSP2
- Today (2025)
- 1,675,273 people
- By 2030
- 1,620,300 · -3.3%
- By 2040
- 1,502,341 · -10.3%
- By 2050
- 1,384,039 · -17.4%
- By 2075
- 1,124,592 · -32.9%
- By 2100
- 881,193 · -47.4%
Race, ethnicity, and origin ACS 2023
- Neighborhood character
- Predominantly Black (85%)
- Race & ethnicity
- Black 85% White 8% Two or more races 5% Hispanic / Latino 2%
- Common ancestry
- Lithuanian 1%
- Foreign-born
- 2% · Canada
- Languages at home
- 95% English-only · Spanish 3% French/Haitian/Cajun 1%
Political lean MEDSL · Wayne
- 2024 margin
- Strong D (+29.0) · D 62.7% · R 33.7% · Other 3.6%
- 2008→2024 swing
- -20.5pp toward R · 2008: 49.5pp · 2024: 29.0pp
- All cycles
- 2024: D+29.0 2020: D+38.1 2016: D+37.3 2012: D+46.9 2008: D+49.5
Not yet ingested
- Civics
- —
Market trends
- HPI YoY
- ▼ -90.13%
- Current HPI
- 297.0176
- Rent YoY
- —
- Metro
- Detroit-Warren-Dearborn, MI
- State GDP YoY
- ▲ 1.37%
- F500 in state
- 28
Industry mix (Fortune 500 HQ in MI)
| Industry | F500 HQs | Revenue |
|---|---|---|
| Automotive Parts | 3 | $48B |
|
||
| Automotive | 2 | $372B |
|
||
| Chemicals | 1 | $45B |
|
||
| Automotive Retail | 1 | $29B |
|
||
| Healthcare / Medical Devices | 1 | $23B |
|
||
| Automotive Technology | 1 | $20B |
|
||
Price history
+631.2% since first listed10 events — show timeline
- 2026-06-09 Listed $58,500 REALCOMP
- 2026-06-09 Listed $58,500 MiRealSource-MiMLS
- 2025-01-24 Listing Removed — REALCOMP
- 2025-01-24 Listing Removed — MiRealSource-MiMLS
- 2024-10-31 Listed $49,900 REALCOMP
- 2024-10-27 Listed $49,900 MiRealSource-MiMLS
- 2009-05-04 Listing Removed — MiRealSource-MiMLS
- 2009-04-07 Listed $8,000 MiRealSource-MiMLS
- 2009-03-17 Listing Removed — MiRealSource-MiMLS
- 2008-12-17 Listed $8,000 MiRealSource-MiMLS
Property tax history
+0.1%/yrLatest (2025): $1,269 · +0.3% YoY. Source: county tax records.
Cash-flow waterfall
monthlySold comps — $/sqft
last 12 mo · ≤1 miLoading sold comps…