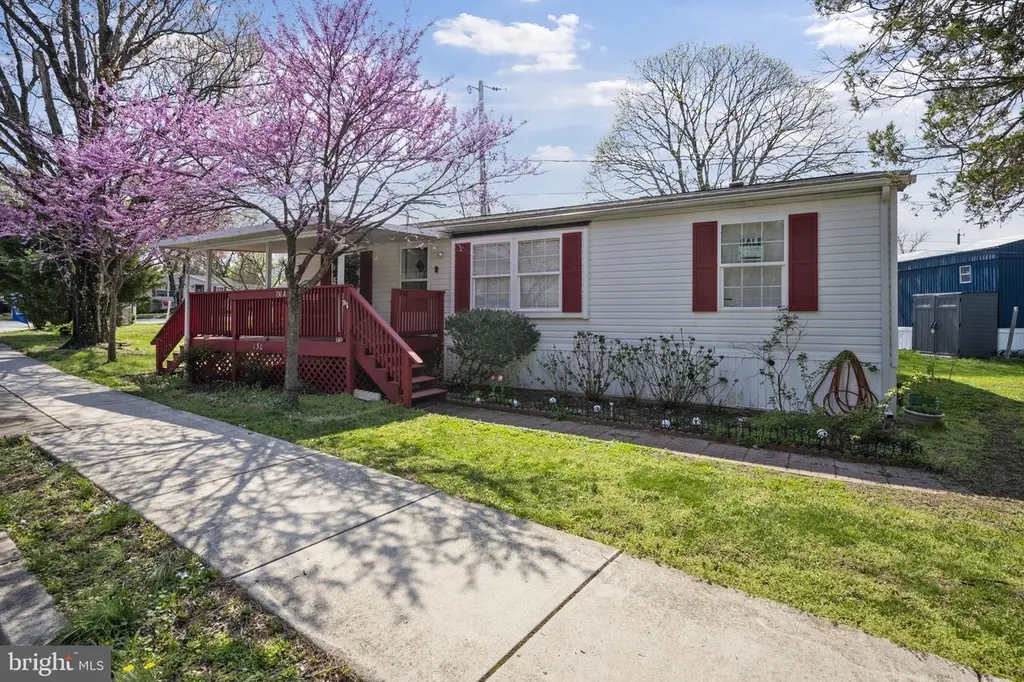
130 A Chesapeake Mobile Ct · Severn, MD
Flood risk No data
- FEMA flood zone
- —
- Chance of flooding over 30 yrs
- —
- Est. flood insurance / yr
- —
Fire risk No data
- Est. fire insurance / yr
- —
Heat risk No data
- Hot days now (above threshold)
- —
- Hot days in 30 yrs
- —
Wind risk No data
- Chance of severe wind over 30 yrs
- —
Air-quality risk No data
- Unhealthy air days now
- —
- Unhealthy air days in 30 yrs
- —
Risk factors via First Street. Map © Google.
Why this score? — see what drove the B grade
The composite is a weighted blend of 9 inputs, each scored 0–100. Each bar is that input's sub-score; the figure is the points it added to the 100-point composite (weight × sub-score).
- Cash flow +30.0/30.0
- 1% rule +10.0/10.0
- DSCR +10.0/10.0
- ARV discount +7.5/15.0
- Condition / age +3.8/5.0
- Livability +3.5/5.0
- Rent growth +2.9/5.0
- Schools +2.9/10.0
- Appreciation +0.0/10.0
$99,000
🖨 Deal sheet (PDF) 📄 Offer letter ✓ Due diligence
Listing remarks MLS
Welcome to 130 A Chesapeake Mobile Ct in Hanover, MD, a well kept 3 bedroom and 2 full bath manufactured home offering comfortable and convenient living. This home features a functional layout with a spacious kitchen that’s great for everyday cooking and gatherings. The primary bedroom includes its own full bathroom, giving you a private space to relax, while the additional bedrooms offer flexibility for family, guests, or a home office. Located in Anne Arundel County, you’re just minutes from Arundel Mills Mall, Live! Casino & Hotel Maryland, restaurants, shopping, and major highways, making it easy to get around and enjoy everything nearby. Don’t miss out on this affordable home in a convenient location!
Key facts
- Spacious kitchen
- Convenient location
- Private space
Tags
Neighborhood map
What this means for you Summary
Snapshot
- This is a 3-bed/2.0-bath single-family listed at $99k. Condition is rated good.
Deal economics
- At list price, monthly cash flow is $2k ($19k/yr) — positive.
- The deal already cash-flows at list — no discount required.
- Meets the 1% rule at list price ($3k rent vs $99k).
- Recommended offer: $93k (6.0% below list) — sets the bar for market timing.
- Cap rate 25.1% vs local median 4.0% in Severn — top-decile yield for the area; either an underpriced asset or a hidden risk that comps aren't pricing in. Stress-test before assuming the spread holds.
Location & tenants
- Location reads 70/100 on livability (#175 in MD) — a middle-class / working-renter tenant base. Strengths: employment A+, housing A+, health & safety A-; Watch: crime D+, amenities F, commute F.
- Anne Arundel County Public Schools (suburban): math 20% / reading 37% proficiency, ranked #10 of 24 in MD (top 42%) — low school quality limits family demand, transient renter base, plan for 1-2y turnover.
- Zoned schools: Monarch Global Academy Pcs Laurel Campus (math 13% / reading 28%, grade F, #341 of 860 statewide, top 40%, 830 students, 53% FRL); Macarthur Middle (math 13% / reading 36%, grade F, #108 of 225 statewide, top 50%, 878 students, 53% FRL); Meade High (math 25% / reading 50%, grade F, #138 of 222 statewide, top 63%, 2,330 students, 59% FRL) — zoned schools average 55% FRL vs 25% district-wide (29 pts higher); higher-poverty schools than district average — tighter screening recommended.
- Market conditions: Rents rising (+1.4%/yr); 149 active listings in the ZIP; 18 comparable units currently listed for rent nearby; rentals at typical pace (median 22d on market — plan ~3-4 weeks tenant-placement turnaround); high-income renter base; 1,303 units permitted in Anne Arundel County in 2024 (299 in 5+ unit buildings).
Forward outlook
- Local home prices are declining (-3.0%/yr); year-one equity from $684 of loan paydown is wiped out by about $3k of value loss. Plan a longer hold.
- Anne Arundel County population projected at +17% by 2050 — long-run rental-demand tailwind backs the buy-and-hold thesis.
- At projected returns (-3.0% appreciation + 1.4% rent growth), your $28k cash investment doubles in ~2 years — after that, you're playing with house money.
Negotiation context
- It's been on market 72 days — a 6% lower offer ($93k) is reasonable based on typical stale-listing flexibility.
- 3 sale attempts since 5y ago with the ask held roughly flat each time — persistent listings suggest the price (not the market) is what's stuck; bring a comps-based counter.
Questions for the listing agent
- It's been on market 72 days. Have you received any prior offers? Is the seller open to a 6% concession, seller financing, or rate buy-down credit?
- Why hasn't it sold? Are there any deal-killer items the seller is aware of (foundation, flood, title, zoning, code violations)?
- Is there a deadline driving the sale (1031 exchange, divorce, estate, relocation)? That informs how much negotiation room exists.
- Schools are D-rated, which usually means shorter tenancies and higher turnover. Who's the typical renter profile here, and what's been the actual vacancy rate?
- Crime grade is D in this area — have there been break-ins, vandalism, or insurance claims at this property in the last 3 years? What carrier currently insures it and at what premium?
- What's the average days-on-market for RENTAL listings here right now (not sales)? A rising rental-DOM trend means longer vacancies and softer asking-rent achievability than the comps imply.
- What's the recent tenant-quality profile in this submarket — average credit score on applications, eviction rate, late-payment / NSF rate, and stable-employment percentage? A property-management company in the area should have these aggregated.
- How much new for-sale + rental construction is in the pipeline within 1–3 miles? Heavy new supply typically softens prices + rents 12–24 months out; constrained supply supports both.
Investment metrics
- 1% rule
- 2.86% ✓
- Cap rate
- 25.08%
- Cash-on-cash
- 67.10%
- DSCR
- 3.99
- GRM
- 2.9
CMA / ARV
- ARV (median comp)
- $483,263
- List price
- $99,000
- Delta
- -79.51%
- Verdict
- UNDERPRICED
- Comps
- 20 within 1.0 mi
Show comp detail 12 sales within ~0.75 mi
| Address | Dist | Beds/Ba | Sqft | Sold | Price | $/sf | Match |
|---|---|---|---|---|---|---|---|
| 77 Chesapeake Mobile Ct | 0.06mi | 3/2.0 | 1,680 (+4%) | 18mo | $86,000 | $51 | 76 |
| 7708 Tobruk Ct | 0.50mi | 4/2.0 (+1) | 1,664 (+3%) | 11mo | $460,000 | $276 | 58 |
| 7535 Knoll Acres Rd | 0.62mi | 3/3.0 | 1,600 (-1%) | 9mo | $425,000 | $266 | 57 |
| 17 Greenknoll Blvd | 0.66mi | 3/2.0 | 1,576 (-3%) | 9mo | $395,000 | $251 | 57 |
| 7733 Aragorn Ct | 0.43mi | 3/2.5 | 1,782 (+10%) | 5mo | $520,000 | $292 | 57 |
| 7533 Lemon Tree Ct | 0.75mi | 4/2.0 (+1) | 1,584 (-2%) | 1mo | $455,000 | $287 | 56 |
| 7727 Acrocomia Dr | 0.62mi | 4/2.0 (+1) | 1,707 (+5%) | 12mo | $310,000 | $182 | 47 |
| 7735 Leaside Ct | 0.62mi | 3/1.0 | 1,490 (-8%) | 9mo | $390,000 | $262 | 46 |
| 3 Greenknoll Blvd | 0.71mi | 3/2.5 | 1,526 (-6%) | 12mo | $430,000 | $282 | 45 |
| 1474 Gesna Dr | 0.58mi | 3/2.0 | 1,422 (-12%) | 13mo | $350,000 | $246 | 42 |
| 7712 Tobruk Ct | 0.49mi | 4/2.5 (+1) | 1,834 (+13%) | 18mo | $490,000 | $267 | 33 |
| 9 Lexington Rd | 0.75mi | 3/3.5 | 1,854 (+14%) | 14mo | $515,000 | $278 | 24 |
Match score weights: distance 35% · size 25% · config 20% · recency 20%. Top-matched comps best support the ARV.
Projected returns pro-forma
-3.0% appreciation · 1.41% rent growth · sell at horizon
- IRR
- 64.6%
- Equity multiple
- 3.82×
- Total profit
- $78,266
- Equity at exit
- $14,761
- IRR
- 68.5%
- Equity multiple
- 7.41×
- Total profit
- $177,741
- Equity at exit
- $8,560
Cash invested: $27,720 (down + closing). Projections, not guarantees.
Landlord ↔ Tenant lean methodology
- Overall (STATE)
- 27 Tenant-Leaning
- State Maryland
- 27 Tenant-Leaning · D+14
- County
- — inherits STATE
- City
- — inherits STATE
ZIP-level market 21076
- Home prices YoY
- -33.9%
- Rents YoY
- 1.4%
- Active inventory
- 149
- Price-to-rent
- 2.9×
Monthly cashflow live
- Estimated rent
- $2,828 high interval (Pro) →
- Mortgage (P&I)
- −$519
- Tax est. 1.5%
- −$124 /mo · $1,485/yr
- Insurance
- −$41
- HOA
- −$0
- Vacancy / Maint / Mgmt
- −$594
- Net cashflow
- $1,550
Break-even live
Sensitivity live
| Price | -10% $1,618 | -5% $1,584 | +0% $1,550 | +5% $1,516 | +10% $1,482 |
|---|---|---|---|---|---|
| Rent | -10% $1,327 | -5% $1,438 | +0% $1,550 | +5% $1,662 | +10% $1,773 |
| Rate | -1.0pp $1,600 | -0.5pp $1,575 | base $1,550 | +0.5pp $1,524 | +1.0pp $1,498 |
UW: 25.0% down · 7.5% · 30yr · 1.5% tax · 5.0% vac · 8.0% maint · 8.0% mgmt
Financing live
Cash to close
- Down payment
- $24,750
- Closing costs
- $2,970
- Reserves months
- —
- Total cash needed
- —
Loan-product check · same deal, 3 products live
Conventional
25% down · 7.5% · 30yr
- Down + closing
- —
- Monthly P&I
- —
- Monthly cashflow
- —
- DSCR
- —
- Eligible?
- —
Personal DTI + credit; lowest rate.
DSCR
20% down · 8.5% · 30yr
- Down + closing
- —
- Monthly P&I
- —
- Monthly cashflow
- —
- DSCR
- —
- Eligible?
- —
No personal income docs; deal must DSCR.
Hard money
10% down · 12.0% · 12mo
- Down + closing
- —
- Monthly P&I
- —
- Monthly cashflow
- —
- DSCR
- —
- Eligible?
- —
Short-term bridge; refi at stabilization.
Rent comps 18 comps
| Address | Beds | Baths | Sqft | Rent | $/sqft | DOM | Units | Dist |
|---|---|---|---|---|---|---|---|---|
| 1624 Hardwick Ct #402 Hanover, MD | 2.0 | 2.0 | 1407 | $2,400 | $1.71 | 45d | 1 | 0.33mi |
| 1707 Fieldstone Ct Hanover, MD | 3.0 | 2.5 | 2100 | $3,400 | $1.62 | 23d | 1 | 0.34mi |
| 7557 Stoney Run Dr #101 Hanover, MD | 2.0 | 2.0 | 1407 | $2,350 | $1.67 | 45d | 1 | 0.43mi |
| 7521 Mundell Rd Hanover, MD | 3.0 | 3.5 | 1600 | $2,750 | $1.72 | 45d | 1 | 0.64mi |
| 1302 Hill Born Dr Hanover, MD | 4.0 | 3.5 | 2224 | $2,800 | $1.26 | 6d | 1 | 0.64mi |
| 1440 Strahorn Rd Hanover, MD | 2.0 | 2.5 | 1824 | $3,000 | $1.64 | 25d | 1 | 0.67mi |
| 7746 Kidwell Ct Hanover, MD | 3.0 | 3.0 | 1700 | $2,700 | $1.59 | 0d | 1 | 1.06mi |
| 1811 Battlement Ct Severn, MD | 2.0 | 1.0 | 1200 | $1,600 | $1.33 | 22d | 1 | 1.12mi |
| 7677 Fairbanks Ct Hanover, MD | 4.0 | 1.5 | 1761 | $2,250 | $1.28 | 4d | 1 | 1.15mi |
| 1447 Pangbourne Way Hanover, MD | 4.0 | 3.5 | 1450 | $2,800 | $1.93 | 45d | 1 | 1.16mi |
| 1432 Pangbourne Way Hanover, MD | 3.0 | 2.5 | 2176 | $3,050 | $1.40 | 19d | 1 | 1.19mi |
| 8001 Laketowne Ct Severn, MD | 2.0–3.0 | 1.0–1.5 | 1014 | $2,694 | $2.66 | 0d | 19 | 1.33mi |
| 1739 Theale Way Hanover, MD | 3.0 | 2.5 | 2104 | $3,200 | $1.52 | 6d | 1 | 1.34mi |
| 1739 Theale Way Hanover, MD | 3.0 | 2.5 | 2104 | $3,200 | $1.52 | 0d | 1 | 1.34mi |
| 2109 Piney Branch Cir Hanover, MD | 1.0–3.0 | 1.0–2.0 | 979 | $3,577 | $3.65 | 0d | 40 | 1.34mi |
| 1743 Theale Way Hanover, MD | 3.0 | 2.5 | 2074 | $3,250 | $1.57 | 25d | 1 | 1.34mi |
| 7694 Dorchester Blvd Hanover, MD | 2.0 | 1.0–2.0 | 855 | $3,198 | $3.74 | 0d | 13 | 1.46mi |
| 1806 Watch House Cir N Severn, MD | 3.0 | 2.5 | 1758 | $2,750 | $1.56 | 46d | 1 | 1.47mi |
Listing history 22 events
-
2026-06-21days on market $99,000 Active 72 DOM
-
2026-06-19price $99,000 Active 69 DOM
-
2026-06-18days on market $100,000 Active 69 DOM
-
2026-06-17days on market $100,000 Active 68 DOM
-
2026-06-16days on market $100,000 Active 67 DOM
-
2026-06-15days on market $100,000 Active 66 DOM
-
2026-06-13days on market $100,000 Active 64 DOM
-
2026-06-09days on market $100,000 Active 60 DOM
-
2026-06-08days on market $100,000 Active 59 DOM
-
2026-06-07days on market $100,000 Active 58 DOM
-
2026-06-04days on market $100,000 Active 55 DOM
-
2026-06-03days on market $100,000 Active 54 DOM
-
2026-06-02days on market $100,000 Active 53 DOM
-
2026-06-01days on market $100,000 Active 52 DOM
-
2026-05-31days on market $100,000 Active 51 DOM
-
2026-04-10$100,000 Active 739-char remark
Show marketing remark (739 chars)
Welcome to 130 A Chesapeake Mobile Ct in Hanover, MD, a well kept 3 bedroom and 2 full bath manufactured home offering comfortable and convenient living. This home features a functional layout with a spacious kitchen that’s great for everyday cooking and gatherings. The primary bedroom includes its own full bathroom, giving you a private space to relax, while the additional bedrooms offer flexibility for family, guests, or a home office. Located in Anne Arundel County, you’re just minutes from Arundel Mills Mall, Live! Casino & Hotel Maryland, restaurants, shopping, and major highways, making it easy to get around and enjoy everything nearby. Don’t miss out on this affordable home in a convenient location!
-
2021-09-20historical
-
2021-05-12price $80,000
-
2021-05-12$80,000 Active
-
2021-04-06price $90,000
-
2021-04-06historical Active Under Contract
-
2021-03-01$80,000 Active
ⓘ Source: listings_history table (triggers on properties + properties_extension) + one-shot
backfill from property_details.listing_events for pre-trigger history.
Nearby sold comps map
Loading sold comps map…
Walkable amenities ~0.75 mi
Loading nearby amenities…
Taxation est. · year 1
- Rental income
- $33,936
- − Mortgage interest
- −$5,546
- − Property taxes
- −$1,485
- − Insurance
- −$495
- − Repairs & maintenance
- −$2,715
- − Management
- −$2,715
- − Depreciation
- −$2,880
- Taxable income
- $18,101
- Est. tax owed @ 24.0%
- −$4,344
- After-tax cash flow
- $14,256/yr
For passive investors: Depreciation is non-cash, so a rental often shows a tax loss while cash-flowing — sheltering income. Rental losses are passive: they offset passive income freely, and up to $25,000/yr can offset ordinary (W-2) income if you actively participate and your MAGI is under $100k (phasing out to $0 by $150k); unused losses carry forward. On sale, claimed depreciation is recaptured at up to 25%, and gains may owe capital-gains tax (a 1031 exchange can defer both). Figures are a year-1 estimate at your 24.0% rate — not tax advice; consult a CPA.
Condition & rehab AI · 6 photos
This well-maintained and attractive manufactured home is move-in ready with good condition and minimal repairs needed. Potential buyers and renters will appreciate the updates that can be made to further enhance its value.
Value-add opportunities
- Both Painting exterior and interior — Enhances curb appeal and interior aesthetics
- Both Landscaping improvements — Enhances curb appeal and adds value
- Both New flooring in kitchen and bathrooms — Improves functionality and aesthetics
- Both New kitchen appliances — Enhances functionality and aesthetics
- Both New bathroom fixtures — Enhances functionality and aesthetics
Renovation cost estimate screening
Value-add ROI direction
- Both Painting exterior and interior — Enhances curb appeal and interior aesthetics ↑
- Both Landscaping improvements — Enhances curb appeal and adds value ↑
- Both New flooring in kitchen and bathrooms — Improves functionality and aesthetics ↑
- Both New kitchen appliances — Enhances functionality and aesthetics ↑
- Both New bathroom fixtures — Enhances functionality and aesthetics ↑
ⓘ Cost ranges are severity-bucket heuristics (US national rule-of-thumb). Get contractor quotes + a written scope before underwriting a rehab budget.
Schools (NCES district)
- District
- Anne Arundel County Public Schools
- NCES district ID
- 2400060
- Math proficiency
- 20% ▼ -21.00%
- Reading proficiency
- 37% ▼ -13.00%
- Median HH income
- $87,880
- Composite
- 28.52/100
- National rank
- #6733
- State rank
- #10 of 24 in MD
Livability — Severn
- Score
- 70/100
- State rank
- #175
- US rank
- #7833
Category grades
Schools grade is shown separately in the Schools card above.
Census & demographics
- Census place
- Severn, MD
- County
- Anne Arundel County · 535,653 people
- City population
- 37,118
- Metro
- Baltimore-Columbia-Towson, MD
- Population (ZIP)
- 24,268
- Household income
- $146,869
- Rent vs Own
- Severe rent burden
- 497.0
Population outlook (Anne Arundel County) Hauer SSP2
- Today (2025)
- 617,384 people
- By 2030
- 642,094 · +4.0%
- By 2040
- 686,621 · +11.2%
- By 2050
- 723,031 · +17.1%
- By 2075
- 809,346 · +31.1%
- By 2100
- 837,658 · +35.7%
Race, ethnicity, and origin ACS 2023
- Neighborhood character
- Highly diverse neighborhood (Simpson 0.73)
- Race & ethnicity
- White 37% Black 31% Asian 15% Hispanic / Latino 10% Two or more races 8%
- Hispanic origin (detail)
- Mexican 2% Puerto Rican 2% Dominican 1%
- Common ancestry
- Romanian 4% Slovak 3% Lithuanian 2%
- Foreign-born
- 20% · Canada, South Korea, China
- Languages at home
- 72% English-only · Spanish 8% Other Indo-European 5% Korean 4%
Political lean MEDSL · Anne Arundel
- 2024 margin
- D (+13.9) · D 55.7% · R 41.7% · Other 2.6%
- 2008→2024 swing
- +15.7pp toward D · 2008: -1.8pp · 2024: 13.9pp
- All cycles
- 2024: D+13.9 2020: D+14.5 2016: D+0.7 2012: R+0.9 2008: R+1.8
Not yet ingested
- Civics
- —
Market trends
- HPI YoY
- ▼ -131.77%
- Current HPI
- 257.5612
- Rent YoY
- ▲ 1.41%
- Metro
- Baltimore-Columbia-Towson, MD
- State GDP YoY
- ▲ 2.97%
- F500 in state
- 12
Industry mix (Fortune 500 HQ in MD)
| Industry | F500 HQs | Revenue |
|---|---|---|
| Aerospace / Defense | 1 | $71B |
|
||
| Utilities | 1 | $25B |
|
||
| Hotels | 1 | $24B |
|
||
| Consumer Goods | 1 | $7B |
|
||
| Real Estate | 1 | $6B |
|
||
| Chemicals | 1 | $2B |
|
||
Price history
+25.0% since first listed7 events — show timeline
- 2026-04-10 Listed $100,000 BRIGHT MLS
- 2021-09-20 Listing Removed — BRIGHT MLS
- 2021-05-12 Price Changed $80,000 BRIGHT MLS
- 2021-05-12 Listed $80,000 BRIGHT MLS
- 2021-04-06 Price Changed $90,000 BRIGHT MLS
- 2021-04-06 Contingent — BRIGHT MLS
- 2021-03-01 Listed $80,000 BRIGHT MLS
Cash-flow waterfall
monthlySold comps — $/sqft
last 12 mo · ≤1 miLoading sold comps…