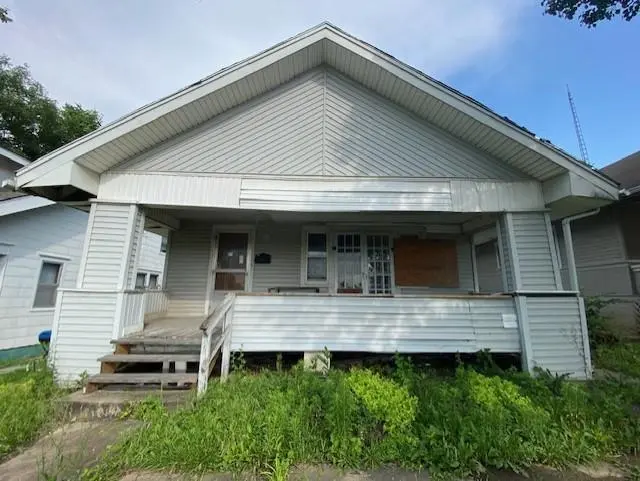
4011 King Hill Ave · St. Joseph, MO
Flood risk 1/10 · Minimal
- FEMA flood zone
- X
- Chance of flooding over 30 yrs
- 0.0%
- Est. flood insurance / yr
- $473 – $860
Fire risk 2/10 · Minimal
- Est. fire insurance / yr
- $1,054 – $1,958
Heat risk 4/10 · Minor
- Hot days now (above 107°F)
- 7 days/yr
- Hot days in 30 yrs
- 16 days/yr
Wind risk 2/10 · Minimal
- Chance of severe wind over 30 yrs
- —
Air-quality risk 2/10 · Minimal
- Unhealthy air days now
- 0 days/yr
- Unhealthy air days in 30 yrs
- 1 days/yr
Risk factors via First Street. Map © Google.
Why this score? — see what drove the B- grade
The composite is a weighted blend of 9 inputs, each scored 0–100. Each bar is that input's sub-score; the figure is the points it added to the 100-point composite (weight × sub-score).
- Cash flow +30.0/30.0
- 1% rule +10.0/10.0
- DSCR +10.0/10.0
- ARV discount +7.5/15.0
- Schools +2.8/10.0
- Rent growth +2.5/5.0
- Livability +2.5/5.0
- Condition / age +2.5/5.0
- Appreciation +0.0/10.0
$39,900
🖨 Deal sheet 📄 Offer letter ✓ Due diligence
Listing remarks MLS
Maintenance free exterior. This cottage home has 2 bedrooms and 1 bath. There's hardwood floors, kitchen equipped with disposal, dishwasher and range. There's a 1-car detached garage with new overhead door and opener.
Key facts
- Large windows
- Formal dining room
- Wood floors
Tags
Property features AI
Finance
- HOA & community: No association fees
Exterior
- Parking: Detached garage; Off-street parking
- Utilities: Public water; Public sewer
- Home design: Single-family residence; Bungalow / Ranch floor plan; Faces west; Residential property in fixer condition
- Construction: Frame construction with vinyl siding; Composition roof; Has full basement; Over 100 years old
- Exterior features: Porch; Partial fencing; Located within city limits
Interior
- Kitchen: Dishwasher; Electric range
- Bedrooms: 2 bedrooms
- Flooring: Wood floors
- Bathrooms: 1 full bathroom
- Heating & cooling: Forced air heating; Electric cooling
- Interior features: Formal dining area; Fixer condition
- Laundry & utility: Basement with inside entrance (unfinished)
Neighborhood map
What this means for you Summary
Snapshot
- This is a 2-bed/1.0-bath single-family listed at $40k.
Deal economics
- At list price, monthly cash flow is $474 ($6k/yr) — positive.
- The deal already cash-flows at list — no discount required.
- Meets the 1% rule at list price ($964 rent vs $40k).
- Cap rate 20.6% vs local median 4.7% in St. Joseph — top-decile yield for the area; either an underpriced asset or a hidden risk that comps aren't pricing in. Stress-test before assuming the spread holds.
Location & tenants
- Location reads: area grade B — affects rentability + tenant quality, not the cash-flow math above.
- St. Joseph (urban): math 28% / reading 38% proficiency, ranked #241 of 324 in MO (top 74%) — families likely to look elsewhere, expect single-tenant / working-renter base with shorter leases.
- Market conditions: 54 active listings in the ZIP; 2 comparable units currently listed for rent nearby; 70 units permitted in Buchanan County in 2024 (0 in 5+ unit buildings).
Forward outlook
- Local home prices are declining (-3.0%/yr); year-one equity from $276 of loan paydown is wiped out by about $1k of value loss. Plan a longer hold.
- Buchanan County population projected to shrink 6% by 2050 — rents likely to lag national; underwrite the cash flow, not the appreciation.
- At projected returns (-3.0% appreciation + 3.0% rent growth), your $11k cash investment doubles in ~3 years — after that, you're playing with house money.
Negotiation context
- Only 8 days on market — expect competitive offers; lowballing is unlikely to land.
- 3 sale attempts since 18y ago with the ask held roughly flat each time — persistent listings suggest the price (not the market) is what's stuck; bring a comps-based counter.
Risks & watch-outs
- Watch-outs: built in 1922 — expect roof / HVAC / electrical / plumbing capex.
Questions for the listing agent
- Built in 1922 — when were the roof, HVAC, electrical panel, plumbing, and water heater last replaced?
- Is there a deadline driving the sale (1031 exchange, divorce, estate, relocation)? That informs how much negotiation room exists.
- What's the average days-on-market for RENTAL listings here right now (not sales)? A rising rental-DOM trend means longer vacancies and softer asking-rent achievability than the comps imply.
- What's the recent tenant-quality profile in this submarket — average credit score on applications, eviction rate, late-payment / NSF rate, and stable-employment percentage? A property-management company in the area should have these aggregated.
- How much new for-sale + rental construction is in the pipeline within 1–3 miles? Heavy new supply typically softens prices + rents 12–24 months out; constrained supply supports both.
Investment metrics
- 1% rule
- 2.41% ✓
- Cap rate
- 20.56%
- Cash-on-cash
- 50.95%
- DSCR
- 3.27
- GRM
- 3.5
CMA / ARV
- ARV (on-the-fly)
- $91,580
- Comps found
- 12
Show comp detail 12 sales within ~0.75 mi
| Address | Dist | Beds/Ba | Sqft | Sold | Price | $/sf | Match |
|---|---|---|---|---|---|---|---|
| 3906 Terrace Ave | 0.07mi | 2/1.0 | 992 (+3%) | 4mo | $38,000 | $38 | 88 |
| 3815 E Ayrlawn Dr | 0.46mi | 2/1.0 | 984 (+2%) | 10mo | $139,900 | $142 | 67 |
| 5207 Pryor Ave | 0.70mi | 2/1.0 | 966 (+0%) | 1mo | $69,900 | $72 | 66 |
| 3903 King Hill Ave | 0.07mi | 2/1.0 | 1,050 (+9%) | 20mo | $99,900 | $95 | 65 |
| 402 Blake St | 0.65mi | 2/1.0 | 932 (-3%) | 1mo | $139,000 | $149 | 63 |
| 4009 Terrace Ave | 0.06mi | 1/1.0 (-1) | 832 (-14%) | 10mo | $69,900 | $84 | 61 |
| 205 E Kansas Ave | 0.48mi | 3/1.0 (+1) | 1,050 (+9%) | 1mo | $80,000 | $76 | 57 |
| 5325 Sawyer St | 0.72mi | 3/1.0 (+1) | 964 (0%) | 7mo | $84,500 | $88 | 56 |
| 906 Riverview Dr | 0.47mi | 2/1.0 | 832 (-14%) | 1mo | $146,800 | $176 | 54 |
| 524 E Kansas Ave | 0.49mi | 3/1.5 (+1) | 1,080 (+12%) | 6mo | $159,900 | $148 | 45 |
| 5307 Halsey St | 0.66mi | 3/1.5 (+1) | 844 (-12%) | 5mo | $49,900 | $59 | 37 |
| 920 Sunset Dr | 0.56mi | 1/1.0 (-1) | 850 (-12%) | 18mo | $89,000 | $105 | 34 |
Match score weights: distance 35% · size 25% · config 20% · recency 20%. Top-matched comps best support the ARV.
Projected returns pro-forma
-3.0% appreciation · 3.0% rent growth · sell at horizon
- IRR
- 48.8%
- Equity multiple
- 3.13×
- Total profit
- $23,767
- Equity at exit
- $5,949
- IRR
- 54.4%
- Equity multiple
- 6.34×
- Total profit
- $59,684
- Equity at exit
- $3,450
Cash invested: $11,172 (down + closing). Projections, not guarantees.
Landlord ↔ Tenant lean methodology
- Overall (STATE)
- 81 Strongly Landlord-Friendly
- State Missouri
- 81 Strongly Landlord-Friendly · R+10
- County
- — inherits STATE
- City
- — inherits STATE
ZIP-level market 64504
- Active inventory
- 54
- Price-to-rent
- 3.5×
Monthly cashflow live
- Estimated rent
- $964 medium interval (Pro) →
- Mortgage (P&I)
- −$209
- Tax from tax record
- −$61 /mo · $732/yr
- Insurance
- −$17
- HOA
- −$0
- Vacancy / Maint / Mgmt
- −$202
- Net cashflow
- $474
Break-even live
UW: 25.0% down · 7.5% · 30yr · 1.5% tax · 5.0% vac · 8.0% maint · 8.0% mgmt
Financing live
Cash to close
- Down payment
- $9,975
- Closing costs
- $1,197
- Reserves months
- —
- Total cash needed
- —
Loan-product check · same deal, 3 products live
Conventional
25% down · 7.5% · 30yr
- Down + closing
- —
- Monthly P&I
- —
- Monthly cashflow
- —
- DSCR
- —
- Eligible?
- —
Personal DTI + credit; lowest rate.
DSCR
20% down · 8.5% · 30yr
- Down + closing
- —
- Monthly P&I
- —
- Monthly cashflow
- —
- DSCR
- —
- Eligible?
- —
No personal income docs; deal must DSCR.
Hard money
10% down · 12.0% · 12mo
- Down + closing
- —
- Monthly P&I
- —
- Monthly cashflow
- —
- DSCR
- —
- Eligible?
- —
Short-term bridge; refi at stabilization.
Rent comps 2 comps
| Address | Beds | Baths | Sqft | Rent | $/sqft | DOM | Units | Dist |
|---|---|---|---|---|---|---|---|---|
| 5206 King Hill Ave Unit C St Joseph, MO | 2.0 | 1.0 | 1122 | $1,000 | $0.89 | 44d | 1 | 0.72mi |
| 2219 S 10th St Saint Joseph, MO | 2.0 | 1.0 | 800 | $900 | $1.12 | 44d | 1 | 1.21mi |
Listing history 8 events
-
2026-06-19days on market $39,900 Active 8 DOM
-
2026-06-18days on market $39,900 Active 7 DOM
-
2026-06-17days on market $39,900 Active 6 DOM
-
2026-06-16days on market $39,900 Active 5 DOM
-
2026-06-15days on market $39,900 Active 4 DOM
-
2026-06-14days on market $39,900 Active 2 DOM
-
2026-06-12remarks 458-char remark
-
2026-06-12$39,900 Active 1 DOM
ⓘ Source: listings_history table (triggers on properties + properties_extension) + one-shot
backfill from property_details.listing_events for pre-trigger history.
Tax reassessment forecast MO · Resets to sale price
- Current annual tax
- $732 · $61/mo
- Projected year-2 tax
- $732 · $61/mo
- Expected delta
- $0/yr ($0/mo · 0.0%)
ⓘ Screening estimate from a state-policy table — verify with the county assessor before closing.
Climate risk First Street
- Flood 1/10 Low FEMA zone X · 0% chance over 30 yrs
- Wildfire 2/10 Low
- Heat 4/10 Moderate 7 d/yr ≥107°F today · 16 d/yr by 30 yrs out
- Wind 2/10 Low
- Air quality 2/10 Low 0 unhealthy d/yr today · 1 by 30 yrs out
Nearby sold comps map
Loading sold comps map…
Walkable amenities ~0.75 mi
Loading nearby amenities…
Taxation est. · year 1
- Rental income
- $11,562
- − Mortgage interest
- −$2,235
- − Property taxes
- −$732
- − Insurance
- −$200
- − Repairs & maintenance
- −$925
- − Management
- −$925
- − Depreciation
- −$1,161
- Taxable income
- $5,385
- Est. tax owed @ 24.0%
- −$1,292
- After-tax cash flow
- $4,400/yr
For passive investors: Depreciation is non-cash, so a rental often shows a tax loss while cash-flowing — sheltering income. Rental losses are passive: they offset passive income freely, and up to $25,000/yr can offset ordinary (W-2) income if you actively participate and your MAGI is under $100k (phasing out to $0 by $150k); unused losses carry forward. On sale, claimed depreciation is recaptured at up to 25%, and gains may owe capital-gains tax (a 1031 exchange can defer both). Figures are a year-1 estimate at your 24.0% rate — not tax advice; consult a CPA.
Schools (NCES district)
- District
- St. Joseph
- NCES district ID
- 2927060
- Math proficiency
- 28% ▼ -6.00%
- Reading proficiency
- 38% ▼ -1.00%
- Median HH income
- $43,007
- Composite
- 27.99/100
- National rank
- #6853
- State rank
- #241 of 324 in MO
Livability — St. Joseph
No livability data for this city. (Only ~50 U.S. cities are tracked.)
Census & demographics
- Census place
- St. Joseph, MO
- City population
- 44,382
- Population (ZIP)
- 10,286
Population outlook (Buchanan County) Hauer SSP2
- Today (2025)
- 89,041 people
- By 2030
- 88,401 · -0.7%
- By 2040
- 86,220 · -3.2%
- By 2050
- 83,603 · -6.1%
- By 2075
- 76,750 · -13.8%
- By 2100
- 67,623 · -24.1%
Race, ethnicity, and origin ACS 2023
- Neighborhood character
- Predominantly White (83%)
- Race & ethnicity
- White 83% Hispanic / Latino 9% Two or more races 7% Black 3% Native American 1%
- Hispanic origin (detail)
- Mexican 4% Cuban 2%
- Common ancestry
- Lithuanian 2% Romanian 2% Slovak 2%
- Foreign-born
- 4% · Canada
- Languages at home
- 94% English-only · Spanish 5%
Political lean MEDSL · Buchanan
- 2024 margin
- Strong R (+28.0) · D 35.2% · R 63.3% · Other 1.5%
- 2008→2024 swing
- -28.2pp toward R · 2008: 0.1pp · 2024: -28.0pp
- All cycles
- 2024: R+28.0 2020: R+24.6 2016: R+26.2 2012: R+8.7 2008: D+0.1
Not yet ingested
- Civics
- —
Market trends
- HPI YoY
- ▼ -100.84%
- Current HPI
- 149.9895
- Rent YoY
- —
- Metro
- —
- State GDP YoY
- ▲ 1.84%
- F500 in state
- 20
Industry mix (Fortune 500 HQ in MO)
| Industry | F500 HQs | Revenue |
|---|---|---|
| Healthcare | 1 | $163B |
|
||
| Insurance | 1 | $21B |
|
||
| Industrial Technology | 1 | $17B |
|
||
| Retail | 1 | $16B |
|
||
| Industrial Distribution | 1 | $10B |
|
||
| Utilities | 1 | $9B |
|
||
Price history
-38.5% since first listed5 events — show timeline
- 2026-06-11 Listed $39,900 Heartland MLS as Distributed by MLS Grid
- 2010-12-01 Listed $57,000 Heartland MLS as Distributed by MLS Grid
- 2008-08-28 Listing Removed — Heartland MLS as Distributed by MLS Grid
- 2008-05-02 Listed $64,900 Heartland MLS as Distributed by MLS Grid
- 1999-07-26 Sold (Public Records) — Public Records
Property tax history
+2.7%/yrLatest (2025): $732 · +23.3% YoY. Source: county tax records.
Cash-flow waterfall
monthlySold comps — $/sqft
last 12 mo · ≤1 miLoading sold comps…