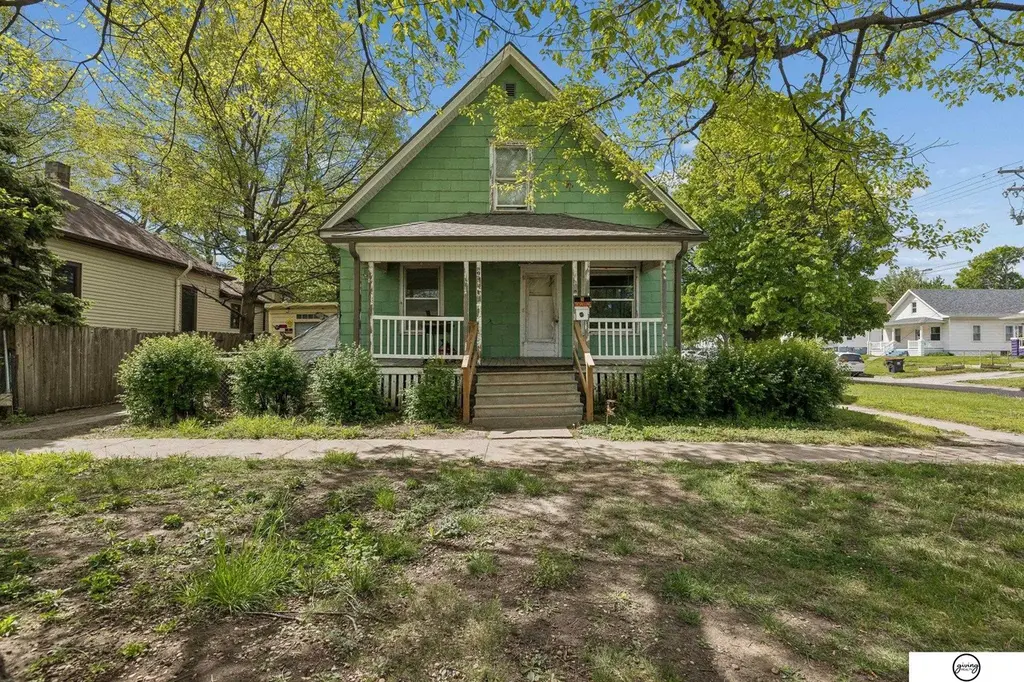
801 Peach St · Lincoln, NE
Flood risk 1/10 · Minimal
- FEMA flood zone
- X (unshaded)
- Chance of flooding over 30 yrs
- 0.0%
- Est. flood insurance / yr
- $473 – $860
Fire risk 1/10 · Minimal
- Est. fire insurance / yr
- $1,161 – $2,155
Heat risk 3/10 · Minor
- Hot days now (above 104°F)
- 7 days/yr
- Hot days in 30 yrs
- 16 days/yr
Wind risk 2/10 · Minimal
- Chance of severe wind over 30 yrs
- —
Air-quality risk 1/10 · Minimal
- Unhealthy air days now
- 0 days/yr
- Unhealthy air days in 30 yrs
- 0 days/yr
Risk factors via First Street. Map © Google.
Why this score? — see what drove the B- grade
The composite is a weighted blend of 9 inputs, each scored 0–100. Each bar is that input's sub-score; the figure is the points it added to the 100-point composite (weight × sub-score).
- Cash flow +28.3/30.0
- DSCR +10.0/10.0
- 1% rule +7.7/10.0
- ARV discount +7.5/15.0
- Schools +4.4/10.0
- Livability +4.2/5.0
- Rent growth +3.1/5.0
- Condition / age +2.5/5.0
- Appreciation +0.0/10.0
$105,000
🖨 Deal sheet 📄 Offer letter ✓ Due diligence
Listing remarks
Peach Street duplex on the market! Brings in decent rents and has great upside potential. Little TLC needed but seller is motivated to get it sold! As is sale. Long term tenants bringing in $1447 per month. Main floor unit is 2 bedroom and 1 bathroom. Upstairs unit is a studio with a full bathroom. Come see this duplex opportunity in South Lincoln!
Key facts
- 3,503 sq ft lot
- Built 1908
Property features AI
Exterior
- Parking: No garage
- Utilities: Public water; Public sewer
- Home design: Duplex residential property; One-and-one-half story; Built in 1908; Living area approximately 1,432 square feet
- Construction: Block foundation
- Exterior features: Front porch; Chain link and full yard fencing; Lot approximately 50 x 70 (about 0.08 acre)
Interior
- Bedrooms: Primary bedroom on the main floor; Second bedroom on the main floor; Third bedroom on the second floor
- Bathrooms: Two full bathrooms (one on the main level)
- Heating & cooling: Natural gas forced air heating; Window air conditioning units
- Interior features: Daylight basement; No fireplaces
Neighborhood map
What this means for you Summary
Snapshot
- This is a 3-bed/2.0-bath other listed at $105k.
Deal economics
- At list price, monthly cash flow is $338 ($4k/yr) — positive.
- The deal already cash-flows at list — no discount required.
- Meets the 1% rule at list price ($1k rent vs $105k).
- Cap rate 10.2% vs local median 3.0% in Lincoln — top-decile yield for the area; either an underpriced asset or a hidden risk that comps aren't pricing in. Stress-test before assuming the spread holds.
Location & tenants
- Location reads 85/100 on livability (#5 in NE, #545 nationally) — a professional / high-income tenant draw. Strengths: amenities A+, cost of living A+, housing A+; Watch: crime D+.
- Lincoln Public Schools (urban): math 50% / reading 53% proficiency, ranked #59 of 111 in NE (top 53%) — acceptable for families but not a draw, mixed tenant base, ~2y average lease.
- Zoned schools: Saratoga Elementary School (math 27% / reading 37%, grade F, #405 of 502 statewide, top 84%, 240 students, 70% FRL); Irving Middle School (math 50% / reading 55%, grade C+, #42 of 128 statewide, top 32%, 890 students, 46% FRL); Lincoln High School (math 38% / reading 41%, grade F, #184 of 261 statewide, top 76%, 2,196 students, 59% FRL) — zoned schools average 58% FRL vs 37% district-wide (21 pts higher); higher-poverty schools than district average — tighter screening recommended.
- Market conditions: Rents rising (+2.4%/yr); 137 active listings in the ZIP; 33 comparable units currently listed for rent nearby; rentals at typical pace (median 21d on market — plan ~3-4 weeks tenant-placement turnaround); 1,940 units permitted in Lancaster County in 2024 (895 in 5+ unit buildings).
Forward outlook
- Local home prices are declining (-3.0%/yr); year-one equity from $726 of loan paydown is wiped out by about $3k of value loss. Plan a longer hold.
- Lancaster County population projected at +37% by 2050 — long-run rental-demand tailwind backs the buy-and-hold thesis.
- At projected returns (-3.0% appreciation + 2.4% rent growth), your $29k cash investment doubles in ~9 years — after that, you're playing with house money.
Negotiation context
- Only 1 days on market — expect competitive offers; lowballing is unlikely to land.
Risks & watch-outs
- Watch-outs: built in 1908 — expect roof / HVAC / electrical / plumbing capex.
Questions for the listing agent
- Built in 1908 — when were the roof, HVAC, electrical panel, plumbing, and water heater last replaced?
- Is there a deadline driving the sale (1031 exchange, divorce, estate, relocation)? That informs how much negotiation room exists.
- Schools are A-rated — typically a magnet for longer-tenancy family renters. What's the average tenant stay here, and is there a school-zone premium baked into asking?
- Crime grade is D in this area — have there been break-ins, vandalism, or insurance claims at this property in the last 3 years? What carrier currently insures it and at what premium?
- What's the average days-on-market for RENTAL listings here right now (not sales)? A rising rental-DOM trend means longer vacancies and softer asking-rent achievability than the comps imply.
- What's the recent tenant-quality profile in this submarket — average credit score on applications, eviction rate, late-payment / NSF rate, and stable-employment percentage? A property-management company in the area should have these aggregated.
- How much new for-sale + rental construction is in the pipeline within 1–3 miles? Heavy new supply typically softens prices + rents 12–24 months out; constrained supply supports both.
Investment metrics
- 1% rule
- 1.27% ✓
- Cap rate
- 10.15%
- Cash-on-cash
- 13.78%
- DSCR
- 1.61
- GRM
- 6.5
CMA / ARV
No comps found within radius.
Projected returns pro-forma
-3.0% appreciation · 2.38% rent growth · sell at horizon
- IRR
- 3.3%
- Equity multiple
- 1.13×
- Total profit
- $3,680
- Equity at exit
- $15,656
- IRR
- 12.2%
- Equity multiple
- 1.94×
- Total profit
- $27,604
- Equity at exit
- $9,078
Cash invested: $29,400 (down + closing). Projections, not guarantees.
Landlord ↔ Tenant lean methodology
- Overall (STATE)
- 83 Strongly Landlord-Friendly
- State Nebraska
- 83 Strongly Landlord-Friendly · R+13
- County
- — inherits STATE
- City
- — inherits STATE
ZIP-level market 68502
- Rents YoY
- 2.4%
- Active inventory
- 137
- Price-to-rent
- 6.5×
Monthly cashflow live
- Estimated rent
- $1,339 high interval (Pro) →
- Mortgage (P&I)
- −$551
- Tax from tax record
- −$125 /mo · $1,506/yr
- Insurance
- −$44
- HOA
- −$0
- Vacancy / Maint / Mgmt
- −$281
- Net cashflow
- $338
Break-even live
UW: 25.0% down · 7.5% · 30yr · 1.5% tax · 5.0% vac · 8.0% maint · 8.0% mgmt
Financing live
Cash to close
- Down payment
- $26,250
- Closing costs
- $3,150
- Reserves months
- —
- Total cash needed
- —
Loan-product check · same deal, 3 products live
Conventional
25% down · 7.5% · 30yr
- Down + closing
- —
- Monthly P&I
- —
- Monthly cashflow
- —
- DSCR
- —
- Eligible?
- —
Personal DTI + credit; lowest rate.
DSCR
20% down · 8.5% · 30yr
- Down + closing
- —
- Monthly P&I
- —
- Monthly cashflow
- —
- DSCR
- —
- Eligible?
- —
No personal income docs; deal must DSCR.
Hard money
10% down · 12.0% · 12mo
- Down + closing
- —
- Monthly P&I
- —
- Monthly cashflow
- —
- DSCR
- —
- Eligible?
- —
Short-term bridge; refi at stabilization.
Rent comps 33 comps
| Address | Beds | Baths | Sqft | Rent | $/sqft | DOM | Units | Dist |
|---|---|---|---|---|---|---|---|---|
| 1708 S 6th St Unit 2 Lincoln, NE | 4.0 | 2.0 | 1444 | $1,800 | $1.25 | 13d | 1 | 0.19mi |
| 835 A St Lincoln, NE | 2.0 | 2.0 | 1000 | $1,200 | $1.20 | 43d | 1 | 0.35mi |
| 1446 S 11th St Unit 2 Lincoln, NE | 2.0 | 2.0 | 1100 | $1,600 | $1.45 | 43d | 1 | 0.39mi |
| 1618 S 14th St Apt 2 Lincoln, NE | 2.0 | 1.0 | 900 | $1,200 | $1.33 | 21d | 1 | 0.50mi |
| 1618 S 14th St Apt 3 Lincoln, NE | 3.0 | 1.0 | 1100 | $1,350 | $1.23 | 21d | 1 | 0.50mi |
| 1101 D St Unit A5 Lincoln, NE | 2.0 | 1.5 | 947 | $825 | $0.87 | 21d | 1 | 0.62mi |
| 1422 A St Unit 6 Lincoln, NE | 2.0 | 1.0 | 933 | $895 | $0.96 | 21d | 1 | 0.62mi |
| 920 E St Lincoln, NE | 4.0 | 2.0 | 1872 | $1,750 | $0.93 | 21d | 1 | 0.69mi |
| 1341 D St Unit 1 Lincoln, NE | 3.0 | 1.0 | 1300 | $1,100 | $0.85 | 43d | 1 | 0.71mi |
| 1020 S 13th St Unit 421 Lincoln, NE | 2.0 | 1.0 | 935 | $1,275 | $1.36 | 21d | 1 | 0.75mi |
| 1020 S 13th St Unit 418 Lincoln, NE | 2.0 | 1.0 | 895 | $1,225 | $1.37 | 21d | 1 | 0.75mi |
| 1736 Euclid Ave Lincoln, NE | 2.0 | 1.0 | 1120 | $850 | $0.76 | 21d | 1 | 0.75mi |
| 2068 S 18th St Unit 1 Lincoln, NE | 3.0 | 1.0 | 1048 | $1,295 | $1.24 | 43d | 1 | 0.79mi |
| 2428 S 18th St Lincoln, NE | 2.0 | 1.0 | 1782 | $1,295 | $0.73 | 21d | 1 | 0.85mi |
| 1730 B St Apt 2 Lincoln, NE | 2.0 | 1.0 | 911 | $950 | $1.04 | 43d | 1 | 0.86mi |
| 1929 Sumner St Lincoln, NE | 2.0 | 2.0 | 1236 | $1,575 | $1.27 | 21d | 1 | 0.90mi |
| 1560 S 20th St Lincoln, NE | 2.0 | 1.0 | 900 | $999 | $1.11 | 21d | 1 | 0.99mi |
| 705 Folsom Ln Lincoln, NE | 1.0–3.0 | 1.0–2.5 | 1173 | $2,105 | $1.79 | 13d | 16 | 1.17mi |
| 701 W C St Lincoln, NE | 2.0 | 1.0 | 1554 | $1,650 | $1.06 | 21d | 1 | 1.17mi |
| 1905 G St Unit 1 Lincoln, NE | 2.0 | 2.0 | 935 | $960 | $1.03 | 43d | 1 | 1.18mi |
| 2224 A St #1 Lincoln, NE | 2.0 | 1.0 | 1150 | $1,099 | $0.96 | 43d | 1 | 1.18mi |
| 1550 S 23rd St Lincoln, NE | 3.0 | 1.0 | 1560 | $1,495 | $0.96 | 13d | 1 | 1.18mi |
| 2209 D St Lincoln, NE | 1.0–2.0 | 1.0 | 760 | $914 | $1.20 | 13d | 3 | 1.24mi |
| 2335 B St Unit 5 Lincoln, NE | 2.0 | 1.0 | 920 | $875 | $0.95 | 21d | 1 | 1.26mi |
| 760 W C St Lincoln, NE | 1.0–3.0 | 1.0–2.0 | 1018 | $1,419 | $1.39 | 13d | 8 | 1.27mi |
| 300 S 16th St Apt 301 Lincoln, NE | 2.0 | 2.0 | 950 | $1,350 | $1.42 | 21d | 1 | 1.34mi |
| 420 S 18th St Lincoln, NE | 1.0–3.0 | 1.0–2.0 | 996 | $1,499 | $1.51 | 13d | 8 | 1.35mi |
| 1320 N St Lincoln, NE | 2.0 | 1.0 | 886 | $1,475 | $1.66 | 43d | 1 | 1.35mi |
| 1900 K St Lincoln, NE | 2.0 | 1.0–2.0 | 775 | $1,630 | $2.10 | 43d | 1 | 1.36mi |
| 2616 South St Lincoln, NE | 4.0 | 1.0 | 1734 | $1,995 | $1.15 | 43d | 1 | 1.37mi |
| 1735 M St Unit 1737 Lincoln, NE | 2.0 | 1.0 | 1047 | $875 | $0.84 | 13d | 1 | 1.40mi |
| 129 N 10th St Lincoln, NE | 2.0–3.0 | 1.0–2.0 | 1273 | $2,290 | $1.80 | 21d | 4 | 1.42mi |
| 2457 S 27th St Unit B Lincoln, NE | 2.0 | 1.0 | 950 | $1,450 | $1.53 | 43d | 1 | 1.48mi |
Listing history 4 events
-
2026-05-08status Pending 350-char remark
-
2026-05-07$105,000 New 350-char remark
-
2026-04-23soldstatus $82,489
-
2019-12-20soldstatus $45,000
ⓘ Source: listings_history table (triggers on properties + properties_extension) + one-shot
backfill from property_details.listing_events for pre-trigger history.
Tax reassessment forecast NE · Resets to sale price
- Current annual tax
- $1,506 · $125/mo
- Projected year-2 tax
- $1,816 · $151/mo
- Expected delta
- +$311/yr (+$26/mo · 20.6%)
ⓘ Screening estimate from a state-policy table — verify with the county assessor before closing.
Climate risk First Street
- Flood 1/10 Low FEMA zone X (unshaded) · 0% chance over 30 yrs
- Wildfire 1/10 Low
- Heat 3/10 Moderate 7 d/yr ≥104°F today · 16 d/yr by 30 yrs out
- Wind 2/10 Low
- Air quality 1/10 Low 0 unhealthy d/yr today · 0 by 30 yrs out
Nearby sold comps map
Loading sold comps map…
Walkable amenities ~0.75 mi
Loading nearby amenities…
Taxation est. · year 1
- Rental income
- $16,064
- − Mortgage interest
- −$5,882
- − Property taxes
- −$1,506
- − Insurance
- −$525
- − Repairs & maintenance
- −$1,285
- − Management
- −$1,285
- − Depreciation
- −$3,055
- Taxable income
- $2,527
- Est. tax owed @ 24.0%
- −$606
- After-tax cash flow
- $3,446/yr
For passive investors: Depreciation is non-cash, so a rental often shows a tax loss while cash-flowing — sheltering income. Rental losses are passive: they offset passive income freely, and up to $25,000/yr can offset ordinary (W-2) income if you actively participate and your MAGI is under $100k (phasing out to $0 by $150k); unused losses carry forward. On sale, claimed depreciation is recaptured at up to 25%, and gains may owe capital-gains tax (a 1031 exchange can defer both). Figures are a year-1 estimate at your 24.0% rate — not tax advice; consult a CPA.
Schools (NCES district)
- District
- Lincoln Public Schools
- NCES district ID
- 3172840
- Math proficiency
- 50% ▼ -6.00%
- Reading proficiency
- 53% ▼ -3.00%
- Median HH income
- $50,273
- Composite
- 44.05/100
- National rank
- #2880
- State rank
- #59 of 111 in NE
Livability — Lincoln
- Score
- 85/100
- State rank
- #5
- US rank
- #545
Category grades
Schools grade is shown separately in the Schools card above.
Census & demographics
- Census place
- Lincoln, NE
- County
- Lancaster County · 291,509 people
- City population
- 291,509
- Metro
- Lincoln, NE
- Population (ZIP)
- 25,846
- Household income
- $68,523
- Rent vs Own
- Severe rent burden
- 1252.0
Population outlook (Lancaster County) Hauer SSP2
- Today (2025)
- 352,806 people
- By 2030
- 377,899 · +7.1%
- By 2040
- 428,582 · +21.5%
- By 2050
- 483,103 · +36.9%
- By 2075
- 632,390 · +79.2%
- By 2100
- 759,513 · +115.3%
Race, ethnicity, and origin ACS 2023
- Neighborhood character
- Predominantly White (72%)
- Race & ethnicity
- White 72% Hispanic / Latino 13% Two or more races 11% Black 6% Asian 3%
- Hispanic origin (detail)
- Mexican 9%
- Common ancestry
- Portuguese 3% Romanian 2% Lithuanian 2%
- Foreign-born
- 10% · Canada, Vietnam, Philippines
- Languages at home
- 86% English-only · Spanish 9% Other Asian/Pacific 2% French/Haitian/Cajun 1%
Political lean MEDSL · Lancaster
- 2024 margin
- Toss-up / Even · D 51.4% · R 47.1% · Other 1.5%
- 2008→2024 swing
- -0.7pp no change · 2008: 5.0pp · 2024: 4.3pp
- All cycles
- 2024: D+4.3 2020: D+7.8 2016: D+0.1 2012: R+1.0 2008: D+5.0
Not yet ingested
- Civics
- —
Market trends
- HPI YoY
- ▼ -252.87%
- Current HPI
- 240.304
- Rent YoY
- ▲ 2.38%
- Metro
- Lincoln, NE
- State GDP YoY
- ▲ 0.68%
- F500 in state
- 2
Industry mix (Fortune 500 HQ in NE)
| Industry | F500 HQs | Revenue |
|---|---|---|
| Conglomerate | 1 | $371B |
|
||
Price history
+177.8% since first listed5 events — show timeline
- 2026-05-29 Sold (MLS) $125,000 GPRMLS
- 2026-05-08 Pending — GPRMLS
- 2026-05-07 Listed $105,000 GPRMLS
- 2026-04-23 Sold (Public Records) $82,489 Public Records
- 2019-12-20 Sold (Public Records) $45,000 Public Records
Property tax history
+3.9%/yrLatest (2025): $1,506 · -7.8% YoY. Source: county tax records.
Cash-flow waterfall
monthlySold comps — $/sqft
last 12 mo · ≤1 miLoading sold comps…