 🏷️ Likely Rental
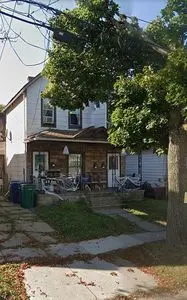
54 Dart St · Buffalo, NY
Flood risk 1/10 · Minimal
- FEMA flood zone
- X (unshaded)
- Chance of flooding over 30 yrs
- 0.0%
- Est. flood insurance / yr
- $507 – $1,088
Fire risk 1/10 · Minimal
- Est. fire insurance / yr
- $691 – $1,283
Heat risk 3/10 · Minor
- Hot days now (above 92°F)
- 7 days/yr
- Hot days in 30 yrs
- 15 days/yr
Wind risk 1/10 · Minimal
- Chance of severe wind over 30 yrs
- —
Air-quality risk 4/10 · Minor
- Unhealthy air days now
- 4 days/yr
- Unhealthy air days in 30 yrs
- 9 days/yr
Risk factors via First Street. Map © Google.
Why this score? — see what drove the A grade
The composite is a weighted blend of 9 inputs, each scored 0–100. Each bar is that input's sub-score; the figure is the points it added to the 100-point composite (weight × sub-score).
- Cash flow +30.0/30.0
- ARV discount +15.0/15.0
- 1% rule +10.0/10.0
- DSCR +10.0/10.0
- Appreciation +8.8/10.0
- Livability +3.9/5.0
- Schools +3.3/10.0
- Condition / age +2.5/5.0
- Rent growth +2.4/5.0
$139,000
🖨 Deal sheet 📄 Offer letter ✓ Due diligence
Multi-family units
County records classify this as Multi-Family (2-4 Unit). Listing-text estimate: 2 units. confirmed
Listing remarks
?? 54 Dart Street & acirc; & euro; & ldquo; Buffalo, NY 14213 Two-Unit Multifamily | 7 Bedrooms | Fully Occupied | Off-Street Parking ?? Investor Opportunity in Buffalo & acirc; & euro; & trade; s West Side! ?? Welcome to 54 Dart Street, a fully occupied two-family home generating immediate rental income in one of Buffalo & acirc; & euro; & trade; s consistently strong rental corridors. ?? Property Breakdown: Lower Unit: 4 Bedrooms & acirc; & euro; & ldquo; Currently Rented at $1,000/month Upper Unit: 3 Bedrooms & acirc; & euro; & ldquo; Currently Rented at $1,150/month Total Monthly Rent: $2,150 Annual Gross Income: $25,
Key facts
- Two-unit multifamily
- Large backyard
- Fully occupied
Tags
Property features AI
Exterior
- Home design: Built in 1890
- Construction: Original construction from 1890
- Exterior features: Located in the Forest subdivision
Neighborhood map
What this means for you Summary
Snapshot
- This is a 1×4bd/1.0ba + 1×3bd/1.0ba units multifamily listed at $139k.
Deal economics
- At list price, monthly cash flow is $2k ($24k/yr) — positive. Per door: $991/mo.
- The deal already cash-flows at list — no discount required.
- Meets the 1% rule at list price ($4k rent vs $139k).
- Cap rate 23.4% vs local median 8.0% in Buffalo — top-decile yield for the area; either an underpriced asset or a hidden risk that comps aren't pricing in. Stress-test before assuming the spread holds.
Location & tenants
- Location reads 77/100 on livability (#195 in NY, #3,011 nationally) — a middle-class / working-renter tenant base. Strengths: commute A+, housing A+, health & safety A+; Watch: crime F, employment D-.
- Buffalo City School District (urban): math 41% / reading 40% proficiency, ranked #535 of 590 in NY (top 91%) — families likely to look elsewhere, expect single-tenant / working-renter base with shorter leases; 75% free/reduced lunch — lower-income household profile, screen leases tightly.
- Market conditions: Rents soft (-0.5%/yr); 137 active listings in the ZIP; 3 comparable units currently listed for rent nearby; rentals lingering (median 44d on market — plan ~5-8 weeks vacancy on turnover, expect pricing pressure); 67% of comp listings sitting > 30 days — soft ceiling on asking rent; 1,244 units permitted in Erie County in 2024 (563 in 5+ unit buildings).
- At $3,553/mo this rent would consume 79% of the median local household income ($54k/yr) (locally 1501% of renters already pay >50% of income on rent) — very limited rent-growth headroom before tenants either downsize or default.
Forward outlook
- In year one you build about $11k of equity ($961 loan paydown + $10k appreciation (7.5% local appreciation)).
- At projected returns (7.5% appreciation + 0.0% rent growth), your $39k cash investment doubles in ~2 years — after that, you're playing with house money.
- By year 4, paydown + projected appreciation supports a ~$39k cash-out refi (75% LTV) — recoverable capital for the next deal without selling this one.
Negotiation context
- Only 6 days on market — expect competitive offers; lowballing is unlikely to land.
Risks & watch-outs
- Watch-outs: built in 1890 — expect roof / HVAC / electrical / plumbing capex.
Questions for the listing agent
- Can we see the unit-by-unit rent roll, current vacancy, and any below-market leases? What's the average tenancy length?
- What capital expenditures (roof, boiler, parking lot, exteriors) have been made in the last 5 years, and what's planned in the next 2?
- Built in 1890 — when were the roof, HVAC, electrical panel, plumbing, and water heater last replaced?
- Is there a deadline driving the sale (1031 exchange, divorce, estate, relocation)? That informs how much negotiation room exists.
- Crime grade is F in this area — have there been break-ins, vandalism, or insurance claims at this property in the last 3 years? What carrier currently insures it and at what premium?
- What's the average days-on-market for RENTAL listings here right now (not sales)? A rising rental-DOM trend means longer vacancies and softer asking-rent achievability than the comps imply.
- What's the recent tenant-quality profile in this submarket — average credit score on applications, eviction rate, late-payment / NSF rate, and stable-employment percentage? A property-management company in the area should have these aggregated.
- How much new apartment / multifamily construction is in the pipeline within 1–3 miles? Heavy new supply (>2% of stock underway) typically softens rents 12–24 months out; light construction supports rent growth.
Investment metrics
- 1% rule
- 2.56% ✓
- Cap rate
- 23.41%
- Cash-on-cash
- 61.14%
- DSCR
- 3.72
- GRM
- 3.3
CMA / ARV
- ARV (on-the-fly)
- $241,920
- Comps found
- 12
Show comp detail 12 sales within ~0.75 mi
| Address | Dist | Beds/Ba | Sqft | Sold | Price | $/sf | Match |
|---|---|---|---|---|---|---|---|
| 414 Hoyt St | 0.33mi | 5/2.0 | 2,640 (+5%) | 6mo | $209,900 | $80 | 71 |
| 81 East St | 0.51mi | 5/2.0 | 2,469 (-2%) | 5mo | $170,000 | $69 | 69 |
| 88 Pooley Pl | 0.17mi | 6/2.0 (+1) | 2,288 (-9%) | 7mo | $270,000 | $118 | 66 |
| 343 Baynes St | 0.48mi | 6/2.0 (+1) | 2,464 (-2%) | 10mo | $400,000 | $162 | 61 |
| 315 Herkimer St | 0.54mi | 6/2.0 (+1) | 2,303 (-9%) | 2mo | $148,000 | $64 | 54 |
| 433 Parkdale Ave | 0.29mi | 6/2.0 (+1) | 2,200 (-13%) | 9mo | $280,000 | $127 | 53 |
| 448 W Delavan Ave | 0.66mi | 4/4.5 (-1) | 2,477 (-2%) | 3mo | $488,750 | $197 | 49 |
| 215 Baynes St | 0.65mi | 6/2.0 (+1) | 2,660 (+6%) | 8mo | $255,000 | $96 | 48 |
| 289 Hoyt St | 0.50mi | 6/2.0 (+1) | 2,232 (-11%) | 8mo | $270,000 | $121 | 46 |
| 1130 West Ave | 0.62mi | 6/3.0 (+1) | 2,715 (+8%) | 8mo | $235,000 | $87 | 43 |
| 238 Barton St | 0.71mi | 6/2.0 (+1) | 2,246 (-11%) | 2mo | $195,000 | $87 | 42 |
| 330 Potomac Ave | 0.42mi | 6/4.0 (+1) | 2,896 (+15%) | 6mo | $263,000 | $91 | 38 |
Match score weights: distance 35% · size 25% · config 20% · recency 20%. Top-matched comps best support the ARV.
Projected returns pro-forma
7.51% appreciation · 0.0% rent growth · sell at horizon
- IRR
- 68.1%
- Equity multiple
- 5.34×
- Total profit
- $168,802
- Equity at exit
- $101,021
- IRR
- 62.8%
- Equity multiple
- 10.68×
- Total profit
- $376,753
- Equity at exit
- $196,309
Cash invested: $38,920 (down + closing). Projections, not guarantees.
Landlord ↔ Tenant lean methodology
- Overall (STATE)
- 15 Strongly Tenant-Friendly
- State New York
- 15 Strongly Tenant-Friendly · D+10
- County
- — inherits STATE
- City
- — inherits STATE
ZIP-level market 14213
- Home prices YoY
- 1.7%
- Rents YoY
- -0.5%
- Active inventory
- 137
- Price-to-rent
- 6.1×
Monthly cashflow live
- Estimated rent
- $3,553 high interval (Pro) →
- Mortgage (P&I)
- −$729
- Tax from tax record
- −$37 /mo · $446/yr
- Insurance
- −$58
- HOA
- −$0
- Vacancy / Maint / Mgmt
- −$746
- Net cashflow
- $1,983
Break-even live
2-unit breakdown (identical units grouped — click to expand)
| Units | Beds | Baths | Est. rent |
|---|---|---|---|
| 1× unit | 4 | 1 | $1,906 |
| 1× unit | 3 | 1 | $1,648 |
| Total (2 units) | $3,553 | ||
UW: 25.0% down · 7.5% · 30yr · 1.5% tax · 5.0% vac · 8.0% maint · 8.0% mgmt
Financing live
Cash to close
- Down payment
- $34,750
- Closing costs
- $4,170
- Reserves months
- —
- Total cash needed
- —
Loan-product check · same deal, 3 products live
Conventional
25% down · 7.5% · 30yr
- Down + closing
- —
- Monthly P&I
- —
- Monthly cashflow
- —
- DSCR
- —
- Eligible?
- —
Personal DTI + credit; lowest rate.
DSCR
20% down · 8.5% · 30yr
- Down + closing
- —
- Monthly P&I
- —
- Monthly cashflow
- —
- DSCR
- —
- Eligible?
- —
No personal income docs; deal must DSCR.
Hard money
10% down · 12.0% · 12mo
- Down + closing
- —
- Monthly P&I
- —
- Monthly cashflow
- —
- DSCR
- —
- Eligible?
- —
Short-term bridge; refi at stabilization.
Rent comps 3 comps
| Address | Beds | Baths | Sqft | Rent | $/sqft | DOM | Units | Dist |
|---|---|---|---|---|---|---|---|---|
| 836 Richmond Ave Buffalo, NY | 4.0 | 3.5 | 1982 | $4,500 | $2.27 | 43d | 1 | 0.58mi |
| 11 Hoyt St Buffalo, NY | 4.0 | 1.0 | 2848 | $1,775 | $0.62 | 14d | 1 | 0.95mi |
| 664 Auburn Ave Unit 1 Buffalo, NY | 4.0 | 2.5 | 3500 | $5,000 | $1.43 | 43d | 1 | 1.07mi |
Listing history 5 events
-
2026-06-15days on market $139,000 Active 6 DOM
-
2026-06-13days on market $139,000 Active 4 DOM
-
2026-06-13days on market $139,000 Active 3 DOM
-
2026-06-10remarks 639-char remark
-
2026-06-10$139,000 Active 1 DOM
ⓘ Source: listings_history table (triggers on properties + properties_extension) + one-shot
backfill from property_details.listing_events for pre-trigger history.
Tax reassessment forecast NY · Partial reset (capped growth)
- Current annual tax
- $446 · $37/mo
- Projected year-2 tax
- $1,397 · $116/mo
- Expected delta
- +$952/yr (+$79/mo · 213.5%)
ⓘ Screening estimate from a state-policy table — verify with the county assessor before closing.
Climate risk First Street
- Flood 1/10 Low FEMA zone X (unshaded) · 0% chance over 30 yrs
- Wildfire 1/10 Low
- Heat 3/10 Moderate 7 d/yr ≥92°F today · 15 d/yr by 30 yrs out
- Wind 1/10 Low
- Air quality 4/10 Moderate 4 unhealthy d/yr today · 9 by 30 yrs out
Nearby sold comps map
Loading sold comps map…
Walkable amenities ~0.75 mi
Loading nearby amenities…
Taxation est. · year 1
- Rental income
- $42,636
- − Mortgage interest
- −$7,786
- − Property taxes
- −$446
- − Insurance
- −$695
- − Repairs & maintenance
- −$3,411
- − Management
- −$3,411
- − Depreciation
- −$4,044
- Taxable income
- $22,844
- Est. tax owed @ 24.0%
- −$5,482
- After-tax cash flow
- $18,312/yr
For passive investors: Depreciation is non-cash, so a rental often shows a tax loss while cash-flowing — sheltering income. Rental losses are passive: they offset passive income freely, and up to $25,000/yr can offset ordinary (W-2) income if you actively participate and your MAGI is under $100k (phasing out to $0 by $150k); unused losses carry forward. On sale, claimed depreciation is recaptured at up to 25%, and gains may owe capital-gains tax (a 1031 exchange can defer both). Figures are a year-1 estimate at your 24.0% rate — not tax advice; consult a CPA.
Schools (NCES district)
- District
- Buffalo City School District
- NCES district ID
- 3605850
- Math proficiency
- 41% ▲ 11.00%
- Reading proficiency
- 40% ▲ 7.00%
- Median HH income
- $31,665
- Composite
- 33.17/100
- National rank
- #5544
- State rank
- #535 of 590 in NY
Livability — Buffalo
- Score
- 77/100
- State rank
- #195
- US rank
- #3011
Category grades
Schools grade is shown separately in the Schools card above.
Census & demographics
- Census place
- Buffalo, NY
- County
- Erie County · 714,559 people
- City population
- 440,021
- Metro
- Buffalo-Cheektowaga, NY
- Population (ZIP)
- 24,107
- Household income
- $53,870
- Rent vs Own
- Severe rent burden
- 1501.0
Population outlook (Erie County) Hauer SSP2
- Today (2025)
- 933,037 people
- By 2030
- 935,181 · +0.2%
- By 2040
- 928,531 · -0.5%
- By 2050
- 905,725 · -2.9%
- By 2075
- 834,037 · -10.6%
- By 2100
- 708,033 · -24.1%
Race, ethnicity, and origin ACS 2023
- Neighborhood character
- Highly diverse neighborhood (Simpson 0.70)
- Race & ethnicity
- White 46% Hispanic / Latino 20% Black 18% Asian 12% Two or more races 10%
- Hispanic origin (detail)
- Mexican 1% Puerto Rican 16% Dominican 1%
- Common ancestry
- Romanian 6% Slovak 3% Lithuanian 3%
- Foreign-born
- 16% · Philippines, Canada, India
- Languages at home
- 68% English-only · Spanish 12% Other Asian/Pacific 7% Arabic 3%
Political lean MEDSL · Erie
- 2024 margin
- Lean D (+9.7) · D 54.8% · R 45.2%
- 2008→2024 swing
- -7.9pp toward R · 2008: 17.5pp · 2024: 9.7pp
- All cycles
- 2024: D+9.7 2020: D+14.7 2016: D+4.8 2012: D+15.6 2008: D+17.5
Not yet ingested
- Civics
- —
Market trends
- HPI YoY
- ▲ 7.51%
- Current HPI
- 448.4879
- Rent YoY
- ▼ -0.49%
- Metro
- Buffalo-Cheektowaga, NY
- State GDP YoY
- ▲ 2.60%
- F500 in state
- 92
Industry mix (Fortune 500 HQ in NY)
| Industry | F500 HQs | Revenue |
|---|---|---|
| Financial Services | 10 | $950B |
|
||
| Consumer Goods | 9 | $162B |
|
||
| Insurance | 4 | $225B |
|
||
| Telecommunications | 2 | $144B |
|
||
| Pharmaceuticals | 2 | $112B |
|
||
| Media / Entertainment | 2 | $69B |
|
||
Price history
1 event — show timeline
- 2026-06-10 Listed $139,000 FSBO.com
Property tax history
+14.8%/yrLatest (2025): $446 · +165.2% YoY. Source: county tax records.
Cash-flow waterfall
monthlySold comps — $/sqft
last 12 mo · ≤1 miLoading sold comps…